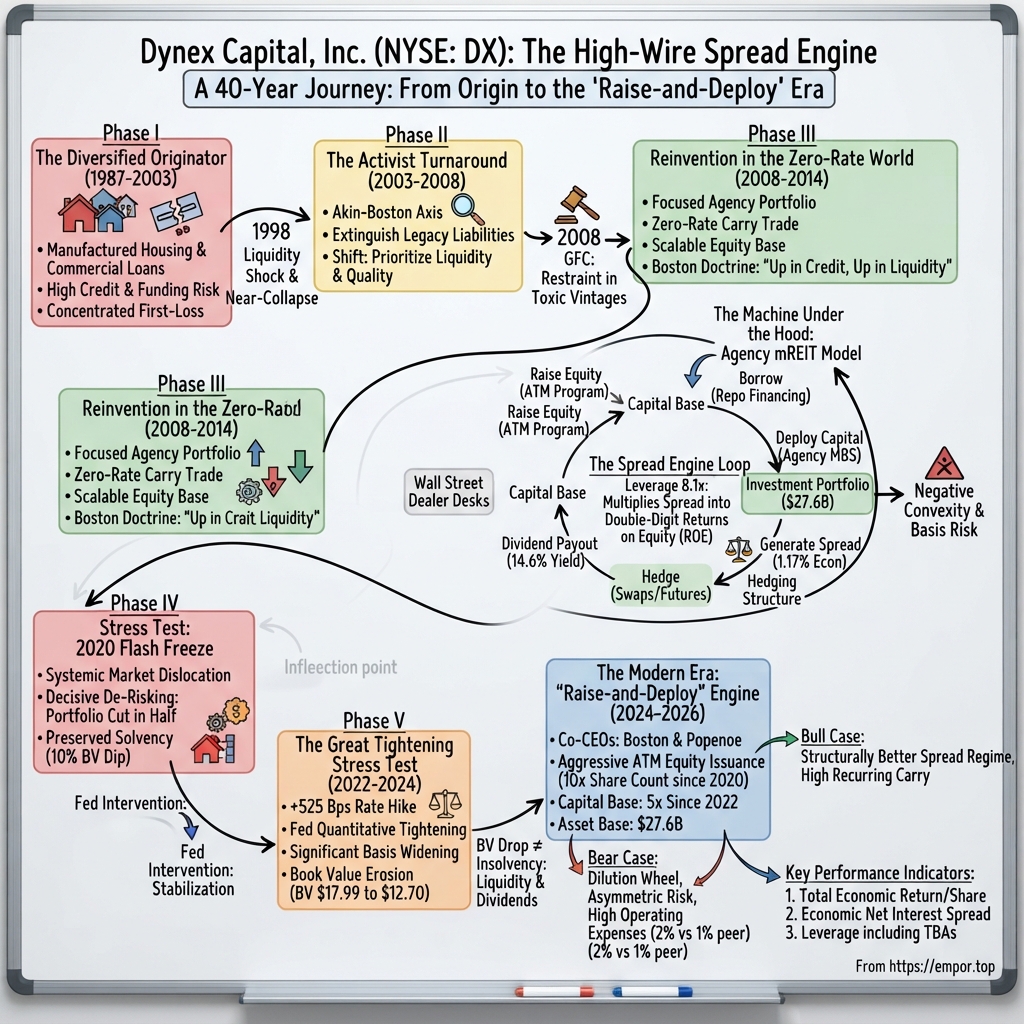
Dynex Capital, Inc. (NYSE: DX): The High-Wire Spread Engine
I. Introduction & Episode Roadmap [00:00 – 08:30]
In the final days of March 2020, trading desks in Glen Allen, Virginia, watched screens flash red—not in the typical pattern of a market sell-off, but in a disorienting breakdown of normal market mechanics. Treasury yields were plummeting, which should have buoyed fixed-income holdings. Instead, government-guaranteed mortgage-backed securities traded like distressed paper. Price quotes for identical bonds diverged wildly between Wall Street broker-dealers, while margin calls from derivative counterparties escalated rapidly. The leadership faced an immediate choice: liquidate holdings at depressed levels, or hold on and risk forced sales into an even deeper liquidity freeze.
Dynex Capital chose to sell. The mortgage real estate investment trust reduced its investment portfolio by roughly half over six weeks, preserving solvency and leaving book value bruised rather than eradicated.13 That defensive liquidation, along with risk-management decisions dating back to the late 1990s, reflects the central discipline required to operate the business.
Dynex has navigated near-insolvency, an activist intervention, an overhaul of its business model, and every major bond-market dislocation over three decades: the 1998 Russian default and the collapse of Long-Term Capital Management, the 2008 global financial crisis, the March 2020 cash squeeze, and the Federal Reserve's rapid 2022–2023 rate hikes. Many mortgage REITs operating in the 1990s failed to survive those cycles.
What Dynex actually is
The REIT label typically brings to mind landlords collecting rent on apartment buildings, suburban shopping centers, or office towers. Dynex owns no real property, collects no rent, and signs no commercial leases. The company operates as a leveraged fixed-income spread investor.
The business model functions by pairing shareholder equity with short-term debt. Dynex raises equity capital from public markets and borrows roughly seven to eight times that equity base, primarily via repurchase agreements—collateralized short-term loans, or repo, arranged with major financial institutions. It deploys that capital into residential and commercial mortgage securities backed by government-sponsored enterprises such as Fannie Mae and Freddie Mac, or government agencies like Ginnie Mae. Because the yield on those underlying mortgages exceeds the short-term borrowing costs, financial leverage amplifies the spread into double-digit returns on equity, the majority of which is returned to shareholders through dividend payouts.
As of June 30, 2026, the company managed a $27.6 billion investment portfolio, holding 99.99% of those assets in agency paper and operating at an economic leverage ratio of 8.1 times shareholders' equity, including forward mortgage contracts.2 Its quarterly dividend stood at $0.51 per common share.2 According to the company's proxy filing, its annualized common dividend yield was 14.6% as of December 31, 2025.4
The core paradox
The core structural paradox of Dynex lies in its credit profile versus its market volatility. The assets backing its balance sheet carry negligible credit default risk; if a homeowner in Ohio defaults on an agency mortgage, Fannie Mae or Freddie Mac guarantees payment of scheduled principal and interest. Yet the company's common shares do not trade with the defensive stability of government bonds. Dynex's book value per common share fell from $19.08 at the end of 2020 to $12.90 by mid-2026.142
The erosion in per-share book value illustrates that non-credit risks dominate the mortgage spread business. Book value fluctuates with broader interest-rate volatility, changes in borrower prepayment speeds, shifting yield spreads between mortgage bonds and benchmark Treasuries, and the risk that repo lenders demand higher collateral margins during periods of market stress.
Why this matters now
Throughout 2025 and 2026, Dynex accelerated its capital-raising activities. The company raised $1.2 billion of net new equity during 2025 and generated a 21.6% total economic return for the year, its strongest annual result of the decade.1 Expansion continued into 2026, with an additional $442 million raised in the first quarter and $391 million in the second.222 Management highlighted to investors that its capital base had expanded fivefold since 2022.24 To layer in additional financing, Dynex priced a new 9.375% preferred stock offering in September 2026.3
This balance-sheet expansion frames the current debate for investors: whether wide agency mortgage spreads offer an attractive environment for a scaled operator to capture steady net interest income, or whether managing a substantially larger balance sheet elevates vulnerability when interest-rate volatility resurfaces.
The roadmap
This analysis tracks Dynex's business across six parts. First, its initial history in manufactured-housing lending and the liquidity crisis that ended its original structure. Second, the activist turnaround and the executive leadership of Byron Boston. Third, the mechanics of agency REITs: repo financing channels, to-be-announced forward contracts, derivative hedging, and the math of negative convexity. Fourth, balance-sheet performance during the 2020 liquidity shock and the 2022–2023 rate-hiking cycle. Fifth, the co-CEO management transition and the programmatic issuance of common and preferred equity. Finally, a stress test of the model: peer positioning, interest-rate risk exposures, bull and bear arguments, and the key balance-sheet indicators that reveal whether the spread engine is performing effectively.
The analysis begins not on a fixed-income trading desk, but in the manufactured-housing finance market of the late 1990s.
 Subscribe on LinkedIn
II. Origins & The Near-Death Experience: From Manufactured Housing to Class-Action Abyss (1987–2003) [08:30 – 22:00]
In 1999, somewhere in the American South or Midwest, a borrower signed papers for a manufactured home. The loan was modest, the borrower's credit history was thin, and the lender was eager to close the deal because the asset was not intended to remain on its balance sheet for long. Within months, it was pooled alongside thousands of similar loans and packaged into bonds.
The lender behind many of those originations was a subsidiary of Dynex Capital called MERIT Securities Corporation, and the resulting bonds haunted the parent company for more than a decade.
A diversified lender in a hurry
Dynex was incorporated in Virginia in 1987.5 In its initial incarnation, it bore little resemblance to the modern agency-focused mortgage REIT. Throughout the 1990s, Dynex operated as a diversified originator and portfolio lender, underwriting single-family residential mortgages, commercial real estate loans, and manufactured-housing installment contracts, then funding that portfolio through asset-backed securitization.5 The structure mirrored the prevailing financial fashion of the era: originate loans, bundle them into debt securities, sell the investment-grade senior tranches to institutional buyers, and retain the higher-yielding, unrated residual pieces as an ongoing income stream.
The structural vulnerability of retaining those residual pieces was that credit losses fell on them first. When borrowers defaulted, write-downs immediately absorbed the subordinated equity tranches held by the originator. In a benign economic climate, that approach generated attractive equity yields; during an economic downturn, it concentrated severe credit risk on a leveraged balance sheet.
The MERIT bonds
Between 1996 and 1999, MERIT originated thousands of manufactured-housing loans. In March and August 1999, the subsidiary securitized those assets into two series of asset-backed bonds, designated Series 12 and Series 13.6 According to facts later detailed by the U.S. Court of Appeals for the Second Circuit, delinquency rates on the underlying collateral rose from 1.35% in August 1999 to 5.01% by November 2001.6 In October 2003, Dynex disclosed that it had understated repossession rates by roughly 34%, and market prices for the bonds eventually plummeted by as much as 85%.6
Manufactured-housing lending proved to be one of the most hazardous credit sectors of that cycle. Many borrowers were financially vulnerable, the homes depreciated rapidly like automobiles rather than appreciating like traditional site-built real estate, and liquidated collateral yielded meager recoveries. While several specialized lenders suffered severe losses during this downturn, Dynex had magnified its exposure by retaining leveraged first-loss positions.
1998: the liquidity shock
Credit deterioration alone might have been manageable over time. What proved nearly fatal was its convergence with an external liquidity crisis. In the autumn of 1998, the Russian sovereign debt default triggered the collapse of hedge fund Long-Term Capital Management. Global investors rapidly retreated from complex credit structures, freezing the private-label securitization market.
For an originator like Dynex, which relied on continuously packaging newly originated loans into public securities, that market freeze left loans stranded on short-term warehouse credit lines. As warehouse lenders tightened credit terms, Dynex halted common dividend distributions after 1998 and suspended preferred dividends in the third quarter of 1999.5 Beginning in 1999, the company turned its focus toward capital preservation and repaying recourse debt obligations rather than expanding its asset base.5
Shutting the doors
Management systematically dismantled the origination franchise. Dynex had already sold its single-family lending operations in 1996, followed by the sale of its manufactured-housing lending arm and model-home leaseback portfolio in 1999. Commercial mortgage originations were phased out entirely in 2000.5 A proposed $90 million merger agreement signed in the fourth quarter of 2000 was terminated in January 2001 after the prospective acquirer failed to satisfy closing conditions.5
By the end of 2001, Dynex had shrunk to a fraction of its former scale: staff stood at 73 employees, shareholders' equity had declined to $173.1 million, and the company still faced $58.0 million of recourse senior notes maturing in July 2002.5 Underscoring that distress, Dynex executed two tender offers in 2001 to repurchase preferred stock carrying a $40.9 million liquidation preference for $20.0 million—retiring its equity obligations at approximately fifty cents on the dollar.5
The activist arrives
With the company's valuation severely depressed, activist investor Thomas B. Akin acquired a substantial stake. A former investment banker at Salomon Brothers and Merrill Lynch, Akin had managed Sausalito, California-based Talkot Capital since 1995.8 He joined Dynex's board and assumed the chairmanship in 2003.8 Akin operated as a hands-on owner-activist rather than a conventional board overseer, working to extinguish legacy liabilities, stem cash outflows, and assess whether the corporate structure could be repurposed into a sustainable investment vehicle.
The courtroom shadow
The fallout from the MERIT securitizations lingered for years. In February 2005, the Teamsters Local 445 Freight Division Pension Fund filed a class-action lawsuit on behalf of investors who purchased Series 12-1 and Series 13 bonds between February 2000 and May 2004, alleging that Dynex, MERIT, and senior executives misrepresented the collateral's underwriting quality.7 Dynex's former president and chief executive officer and its then-chief operating officer were named as individual defendants.76
The litigation produced a prominent appellate precedent. On June 26, 2008, the U.S. Court of Appeals for the Second Circuit held that the complaint failed to establish a strong inference of corporate scienter and directed the dismissal of claims against Dynex and MERIT, while granting plaintiffs leave to replead.6
That appellate victory did not end the controversy. The plaintiffs amended their complaint, and the litigation dragged on for several more years. Dynex ultimately agreed to a $7.5 million settlement, which the district court approved in the first quarter of 2012, with Dynex funding the escrow account itself.7 Although the payout was manageable against the company's capital base, the legal battle tied up executive resources and clouded the firm's reputation for nearly seven years.
What the first life teaches
The original incarnation of Dynex foundered because it concentrated credit risk and warehouse funding risk on the same balance sheet. When underlying borrowers defaulted and securitization markets seized simultaneously, the business lacked a liquidity cushion to absorb both blows. The institutional scar tissue from that near-collapse formed the operational philosophy of the restructured firm—setting the stage for a new management team determined to avoid credit-sensitive originations entirely.
III. The Reinvention: The Akin-Boston Axis & Surviving the Great Financial Crisis (2003–2014) [22:00 – 37:30]
In January 2008, a veteran mortgage bond trader joined a small Virginia firm whose market value barely registered on major Wall Street trading desks. Byron L. Boston later recalled that Dynex's equity capitalization at the time stood only slightly above $100 million.9 Bear Stearns was two months from collapse, and subprime mortgage originators were unraveling across the industry. Entering a leveraged mortgage vehicle in the opening weeks of 2008 appeared counterintuitive—unless the strategy was to position a clean balance sheet to capitalize on the fallout once the crisis cleared.
Cleaning the attic: 2003 to 2007
Under Thomas Akin's chairmanship, Dynex spent the mid-2000s managing legacy assets in runoff mode. Securitized loan pools amortized, outstanding legal liabilities were gradually resolved, and management resisted reentering mortgage originations during the height of the housing bubble. That restraint proved to be a decisive pivot: by sitting out the subprime origination boom between 2004 and 2007, Dynex avoided the catastrophic credit losses that wiped out dozens of specialty finance competitors.
In February 2008, the board formally appointed Akin chief executive officer while retaining him as chairman.8 In that same disclosure, Dynex declared a common dividend of $0.10 per share—a modest but deliberate signal to the market that the company was transitioning from defensive balance-sheet triage to active portfolio management.8
Who is Byron Boston?
Boston's career path contrasted sharply with conventional Wall Street profiles. Raised in Mississippi as the son of a decorated World War II veteran who encountered systemic racial discrimination upon returning from the war, Boston developed an intense focus on discipline and preparation.9 He went on to play collegiate football at Dartmouth College, where he completed an economics degree, before earning an MBA in finance and accounting from the University of Chicago Booth School of Business.910 Boston has consistently credited his athletic background as the foundation of his competitive drive and emphasis on continuous operational refinement.9
He began his career in 1981 at Chemical Bank, soon transitioning to Credit Suisse First Boston's fixed-income division to trade mortgage-backed securities.9 Boston traded mortgage debt at CSFB and Lehman Brothers between 1986 and 1997, then joined Freddie Mac, where from 1997 to 2004 he designed and directed the initial investment strategy for the agency's retained mortgage portfolio.9 Between 2004 and 2006, he founded and served as chief executive of Sunset Financial Resources, a mortgage REIT that completed a $130 million initial public offering before being acquired in 2006.9
That institutional background provided practical insight across key corners of the mortgage ecosystem: the broker-dealer trading desk, the government-sponsored enterprise's balance sheet, and the operational hurdles of leading a publicly traded mortgage REIT.
The doctrine
Boston's operating philosophy, detailed across years of investor presentations and earnings calls, centered on three fundamental tenets: prioritize liquidity and asset quality above yield, plan for diverse macroeconomic outcomes, and avoid relying on precise interest-rate forecasts.9 During the market dislocations of 2020, he summarized this risk framework as staying "up in credit and up in liquidity."13
The rationale addressed the structural vulnerabilities that nearly unraveled Dynex a decade earlier. A leveraged spread investor can typically withstand severe bond price declines if its assets remain highly liquid and eligible for repo financing. It can also manage localized credit losses if its balance sheet is not dependent on short-term borrowings. When collateral values drop precipitously and short-term funding lines freeze simultaneously, insolvency follows quickly.
Did Dynex really "dodge" 2008?
Conventional retellings often suggest that Dynex weathered the 2008 financial crisis because it held an immaculate agency portfolio while competitors like Thornburg Mortgage, New Century Financial, and American Home Mortgage collapsed. The historical reality is more nuanced.
Dynex survived the 2008 crisis primarily because it had already shrunk its operations and refrained from underwriting subprime loans during the bubble's peak. It was not yet an exclusively agency-backed REIT. As late as March 31, 2012, its $3.3 billion investment portfolio included $466 million of non-agency mortgage-backed securities and $101 million of securitized mortgage loans alongside $2.66 billion of agency paper.7 The company survived not because it had completed its transition into an agency fortress, but because it had avoided originating the toxic 2005–2007 loan vintages.
Rebuilding in the zero-rate world
Following the 2008 collapse, macroeconomic conditions shifted heavily in favor of surviving spread investors. With the Federal Reserve holding short-term policy rates near zero, repurchase agreement borrowing costs plunged while long-term mortgage securities continued to offer substantial yield premiums. For leveraged balance sheets with active financing lines, the post-crisis carry trade generated robust double-digit returns on equity with minimal short-term funding strain.
Dynex deployed capital aggressively into that environment. Shareholders' equity expanded to $523 million by March 2012.7 Boston was appointed president in 2012 and elevated to chief executive officer in 2014.10 By 2023, Boston estimated that the company's capital base had expanded from roughly $100 million to approximately $850 million under his stewardship.9
The investor lesson from the rebuild
The company's post-2008 recovery demonstrated disciplined timing and balance-sheet opportunism: management avoided the worst credit vintages in modern mortgage history and then scaled into a historic monetary easing cycle. Yet that performance did not establish that Dynex possessed an unassailable competitive advantage. In a zero-rate environment supported by the Federal Reserve's quantitative easing, virtually any capitalized mortgage investor with repo market access could capture wide net interest spreads. The true test of the business model would emerge when monetary accommodation ended, the central bank stepped back as buyer of last resort, and violent interest-rate volatility returned. Understanding how Dynex managed those subsequent cycles requires examining the mechanics of the modern agency mortgage REIT engine itself.
IV. The Machine Under the Hood: Inside the Agency mREIT Business Model [37:30 – 58:00]
Operating an agency mortgage REIT is functionally comparable to running a commercial bank without retail branch deposits. Every morning, instead of customers depositing savings into checking accounts, managers call a roster of Wall Street broker-dealers to borrow capital against bond collateral for terms typically spanning thirty to ninety days. If dealers roll the financing, the business continues smoothly; if counterparties pull back simultaneously, liquidity evaporates immediately. That daily rollover represents the operational reality of the agency mortgage REIT model.
The asset side: government-backed, but not risk-free
Dynex's investment portfolio consists almost entirely of agency residential mortgage-backed securities (RMBS): pools of 30-year and 15-year fixed-rate residential loans guaranteed against credit default by Fannie Mae, Freddie Mac, or Ginnie Mae. As of June 30, 2026, residential agency securities accounted for $26.1 billion, or 95%, of the investment portfolio.2 The remaining $1.4 billion, roughly 5%, was held in agency commercial mortgage-backed securities (CMBS), primarily multifamily loans backed by the same government-sponsored enterprises.2
The agency guarantee insulates the investor from credit default risk: if an underlying homeowner defaults on a mortgage payment, the guaranteeing agency ensures the timely distribution of scheduled principal and interest. It does not, however, protect the portfolio from interest-rate fluctuations or secondary-market price declines. Because Dynex accounts for its assets on a mark-to-market basis, fluctuating bond values flow directly through shareholders' equity into book value per share.
The funding side: repo
Repurchase agreements represent the lifeblood of this financing architecture. In a standard repo transaction, Dynex transfers a bond to a dealer counterparty while committing to repurchase it on a specified future date at a slightly higher price, functioning economically as a secured loan. The dealer lends an amount below the bond's market value; this difference, known as the haircut, represents Dynex's equity cushion pledged to the trade.
The structural vulnerability lies in repo's short duration. Contracts typically roll on monthly or quarterly cycles at interest rates pegged to short-term benchmark rates. If collateral values drop, dealers issue margin calls requiring immediate cash or additional securities. If counterparties become risk-averse during broader market turbulence, they can widen haircuts or refuse to roll maturing agreements entirely—the exact liquidity mechanism that distressed Dynex in 1998 and forced widespread asset sales across the sector in 2008 and 2020.
Dynex defends against this fragility through balance-sheet liquidity, keeping unpledged securities and cash on hand to satisfy sudden margin requirements. As of June 30, 2026, that liquidity buffer stood at $1.6 billion, representing 51% of total shareholders' equity.2 In operational terms, this reserve functions like a reserve fuel tank on a long-haul flight: it produces no incremental yield, but it determines whether an unexpected liquidity drain results in a safe landing or forced asset sales.
The synthetic balance sheet: TBAs and dollar rolls
Beyond holding physical securities, Dynex establishes mortgage exposure through the forward to-be-announced (TBA) market, where participants contract to purchase generic agency mortgage pools for future settlement without identifying specific underlying loan pools.
The mechanism that transforms TBAs into an efficient synthetic financing vehicle is the dollar roll. In a dollar roll transaction, an investor sells a front-month TBA contract while concurrently purchasing a contract for delivery in the subsequent month. Over that settlement gap, the counterparty holds the underlying bonds and collects principal and interest cash flows. The price discount on the forward contract implies an effective financing rate. When market demand for immediate physical delivery is elevated, that implied rate can fall significantly below traditional repo borrowing costs—a dynamic trading desks refer to as "specialness."
While TBA contracts provide capital-efficient liquidity, they offer only generic pool exposure. In early 2026, Dynex reduced its TBA exposure from more than 16% of the portfolio to roughly 7%, contending that purchasing specified pools with favorable prepayment traits provided a more dependable path to outperformance.23 Chief Investment Officer T.J. Connelly summarized that approach on an earlier earnings call: "Security selection remains the most reliable and consistent source of alpha in agency MBS."25
Negative convexity, explained with a garden hose
The most complex structural challenge in the agency business model is negative convexity, an asymmetrical return profile stemming from borrower behavior.
Unlike corporate or sovereign debt, standard American residential mortgages grant homeowners an embedded call option: the right to prepay and refinance their debt at any time without penalty. When prevailing interest rates fall, homeowners refinance into lower-rate loans, returning principal to the bondholder at par just as reinvestment opportunities offer diminished yields. Conversely, when interest rates surge, prepayment activity halts and the expected life of the mortgage bond extends, leaving capital locked into below-market yields as bond prices drop.
The dynamic resembles a garden hose that shortens whenever more water is required and lengthens when less is needed. While standard benchmark Treasuries exhibit positive convexity—gaining more in price when rates drop than they lose when rates rise—mortgage-backed securities display negative convexity: price upside is constrained by early refinancing, while downside exposure remains unhedged against higher yields. Agency investors are effectively short an embedded prepayment option granted to millions of mortgage borrowers, receiving compensation for that asymmetrical risk through higher spread yields.
Hedging: the art of partial protection
To insulate book value against broad rate movements, Dynex deploys a derivative hedging program comprising pay-fixed interest-rate swaps, short Treasury futures positions, and swaptions. As of June 30, 2026, its hedge portfolio consisted of $14.09 billion in interest-rate swaps, $4.26 billion in short Treasury futures, and $750 million in swaptions.2 According to management, interest-rate swaps accounted for approximately 70% of the company's total hedging structure measured by interest-rate sensitivity.23
These instruments provide effective protection against parallel shifts in benchmark yield curves, but they offer little defense against changes in the mortgage basis itself: the yield spread between agency mortgages and benchmark Treasuries or interest-rate swaps. If that spread widens—meaning mortgage bond prices drop relative to Treasuries—the portfolio loses value even if benchmark rates remain unchanged, as the derivative gains fail to offset asset depreciation. This basis risk represents the foundational exposure Dynex is capitalized to manage and compensated to bear.
The economics in one sentence
During the second quarter of 2026, Dynex reported a net interest spread of 1.16% and an economic net interest spread—incorporating derivative hedge carry and TBA dollar-roll income—of 1.17%.2 That underlying spread of roughly 1.2 percentage points, multiplied across approximately eight times leverage and combined with unhedged equity yields, demonstrates how underlying mortgage assets yielding 5% to 6% can generate double-digit dividend distributions. That same leverage equation dictates balance-sheet vulnerability: a one percentage point decline in overall portfolio market value erodes approximately eight percent of common shareholders' equity.
Segment economics
The agency commercial mortgage portfolio serves a distinct structural function. Unlike residential loans, agency multifamily mortgages typically include prepayment lockout periods or yield-maintenance penalties, preventing commercial borrowers from refinancing when interest rates decline. This contractual friction neutralizes negative convexity, offering more stable cash flows through rate cycles. Dynex previously relied on that stability to anchor its balance sheet; in 2020, its portfolio was divided almost evenly between commercial and residential agency securities.12 By mid-2026, however, CMBS functioned primarily as a secondary holding, with the residential book driving the vast majority of net interest income and book-value volatility.
Operating this leveraged machinery in stable debt markets is straightforward; navigating unexpected liquidity shocks without destroying shareholder capital is an entirely different operational test. In March 2020, the engine confronted its most severe operational disruption since the liquidity freeze of 1998.
V. Surviving the Flash Freeze: The March 2020 Repo Margin Spiral & The 100% Agency Pivot [58:00 – 1:14:00]
On March 9, 2020, U.S. equity markets halted trading after prices crashed at the open.15 Within days, severe liquidity strains spread across benchmark debt markets. In the agency MBS market, the normal pricing relationship between specified loan pools and generic forward TBA contracts broke down so severely that the premium investors traditionally paid for prepayment-protected pools "totally disappeared and, strikingly, even turned into a discount," as researchers at the Federal Reserve Bank of New York later described it.15
For leveraged mortgage REITs, this created an immediate operational squeeze: secondary market liquidity for high-quality collateral deteriorated rapidly just as repo financing counterparties demanded additional margin.
The setup: a new partner and a cautious stance
Six years before the 2020 liquidity shock, Boston recruited a longtime colleague to help direct portfolio strategy. Smriti L. Popenoe joined Dynex in 2014 as executive vice president and co-chief investment officer.11 By the time of the company's 2026 proxy filing, the two executives had worked together across nearly three decades, including shared tenures at Freddie Mac and Sunset Financial Resources.4
Popenoe brought an atypical combination of technical and institutional experience to the executive suite. She earned a Bachelor of Science in chemistry and environmental science from St. Joseph's College in Bangalore, India, followed by an MBA from the University of Rochester and a master's-level diploma in French.4 Early in her career, she managed portions of a $400 billion fixed-rate MBS and whole-loan portfolio at Freddie Mac, served as a senior investment executive at Sunset between 2003 and 2006, and directed Wachovia's—and subsequently Wells Fargo's—more than $100 billion investment portfolio from 2006 to 2009, steering that balance sheet through the global financial crisis.4 She earned the Chartered Financial Analyst designation in 1997.4
In the years preceding the pandemic, Dynex under Boston characterized the global macroeconomic environment as "complex and uncertain," tilting asset allocations toward government-guaranteed securities.12 The portfolio leaned heavily into agency commercial MBS, which carried structural prepayment lockout protections and had appreciated meaningfully during the preceding credit cycle.
The March crunch
When market stress escalated in early March 2020, Dynex entered the freeze operating at an economic leverage ratio of approximately 9.0 times shareholders' equity.13 At that degree of financial leverage, even modest basis point declines in bond valuations can rapidly consume a significant portion of an institution's equity base.
Rather than waiting for market liquidity to recover, management liquidated assets early and decisively. Popenoe told analysts on the first-quarter earnings call that the company reduced its agency CMBS portfolio from $2.1 billion to $800 million, realizing $166 million in gains, much of it before mortgage spreads widened further later in the month.13 Through those proactive sales, the total investment portfolio contracted from roughly $5.0 billion to $2.4 billion by April 30, reducing economic leverage to approximately four times equity.13
Concurrently, facing heightened margin requirements from derivative counterparties, the company terminated most of its interest-rate swaps as its hedging requirements shifted alongside the smaller portfolio.14
The damage and the rescue
The defensive asset liquidations left clear balance-sheet marks. Dynex's book value per common share fell by $1.94 during the first quarter of 2020, a drop of approximately 10.8%.13 While substantial, the decline preserved the firm's capital base and avoided the severe distress suffered by hybrid and credit-focused mortgage REITs, several of which were forced into standstill and forbearance agreements with lenders. Subsequent research by the Federal Reserve documented how margin-call-driven liquidations by leveraged mortgage investors amplified that broader market dysfunction.15
Decisive central-bank intervention altered the trajectory of the market. On March 15, 2020, the Federal Reserve announced it would purchase at least $200 billion of agency MBS, and on March 23 expanded that mandate to open-ended purchases in whatever amounts were necessary to support smooth market functioning.15 For agency mortgage investors, this backstop proved decisive: the collateral securing their repo borrowing was the precise asset class the central bank intervened to stabilize.
By year-end, Dynex had stabilized and begun rebuilding. Book value per common share rose from $18.01 at the end of 2019 to $19.08 by year-end 2020. Factoring in $1.66 per share of dividends, the company delivered a 15.2% total economic return for 2020, finishing the year with economic leverage at a conservative 6.3 times equity.14
What 2020 proves, and what it does not
The 2020 market dislocation provided empirical support for management's central contention that a liquidity-first approach and high-quality collateral protect an institution through systemic freezes. Dynex entered the shock holding paper eligible for central-bank facilities, sold assets into secondary liquidity before bid-ask spreads unraveled completely, and completed the year with higher per-share book value than when it began.
Yet that outcome includes two important operational qualifications. First, the balance-sheet recovery relied directly on central-bank intervention. Without the Federal Reserve's emergency purchase programs, agency collateral valuations could have continued to deteriorate, leaving an entity capitalized at nine times leverage with virtually no room to absorb extended margin pressure. Second, aggressive de-risking carried an earnings cost: halving the balance sheet temporarily reduced net interest earning power just as borrowing costs dropped toward zero.
The enduring strategic consequence was a definitive transition toward an exclusively government-guaranteed portfolio. By mid-2026, agency paper accounted for 99.99% of the investment portfolio.2 Dynex traded away credit risk in exchange for pure interest-rate and mortgage-basis spread risk. That trade-off insulated the balance sheet from borrower defaults, but it left the portfolio fully exposed to interest-rate volatility—setting up the operational test that arrived when monetary policy tightened abruptly.
VI. The Great Tightening Stress Test: 525 Bps, Spread Widening & The Hedging Dilemma (2022–2024) [1:14:00 – 1:33:30]
For more than a decade, agency mortgage investors operated alongside a powerful institutional sponsor: the Federal Reserve, which had purchased trillions of dollars of mortgage-backed securities to stabilize debt markets and suppress long-term borrowing costs. In the spring of 2022, that monetary backstop ended, and the central bank began stepping back from the market entirely.
The fastest tightening in forty years
The Federal Reserve initiated interest-rate hikes in March 2022 and, by July 26, 2023, had lifted the federal funds target range by 525 basis points to between 5.25% and 5.50%.18 Concurrently, the central bank began shrinking its balance sheet through quantitative tightening. Starting June 1, 2022, it allowed up to $17.5 billion per month of agency debt and mortgage-backed securities to run off without reinvestment, raising that monthly runoff cap to $35 billion after three months.17
That shift delivered a compounding blow to the mortgage sector. Rapidly climbing interest rates pushed mortgage bond prices lower across the curve, while the departure of the market's largest, price-insensitive buyer effectively transformed the central bank into a passive net seller as portfolio cash flows rolled off.
The basis widening nightmare
Dynex's derivative hedges performed their primary function against rising benchmark interest rates. What they could not prevent was the widening of the mortgage basis. As the Federal Reserve retreated and commercial banks—historically major buyers of agency MBS—curtailed their purchases, mortgage bond yields had to rise relative to Treasuries to attract private capital.
The dynamic revealed the structural limits of interest-rate hedging. In practical terms, Dynex had insured its balance sheet against fire—broad increases in benchmark yields—but carried no protection against the neighborhood falling out of favor. When the relative valuation of mortgage collateral declined against benchmark debt, derivative rate hedges provided no offsetting payout.
For 2022, Dynex recorded a negative 9.5% total economic return, as book value per common share dropped from $17.99 to $14.73 even after factoring in $1.56 per share of dividends.16 Management maintained a defensive posture, running economic leverage at 6.1 times shareholders' equity at year-end to preserve balance-sheet capacity, stating that the company was "well-positioned to selectively add incremental assets when spreads widen."16
The SVB aftershock
Balance-sheet strains escalated in March 2023 when regional banking stress led to the failures of Silicon Valley Bank and Signature Bank, triggered in significant part by unrealized losses on fixed-rate securities holdings. On April 5, 2023, the Federal Deposit Insurance Corporation announced it would liquidate the retained securities portfolios of both institutions—encompassing approximately $27 billion from Signature and $87 billion from SVB in face value, primarily consisting of agency MBS, collateralized mortgage obligations, and agency commercial mortgage-backed securities.19 Even with a gradual, orderly liquidation process directed by BlackRock's financial advisory unit, the mortgage market was forced to absorb a massive supply overhang precisely when traditional bank buyers were retreating.19
By the end of 2023, Dynex's book value per common share stood at $13.31.20 Common dividends of $1.56 per share for the year offset the $1.42 per-share drop in book value, leaving the full-year economic return only marginally positive.20 Over that period, Dynex expanded its investment portfolio to $7.4 billion, lifted economic leverage to 7.8 times equity, and resumed equity capital raising, generating $42.6 million in net proceeds in 2023 that management reported was issued at a premium to book value.20
In 2024, the company generated a 7.4% total economic return, though book value per share slipped further to $12.70 from $13.31, with $1.60 per share in dividend distributions accounting for the positive economic performance.21
Historical falsification: the "macro hedging mastery" claim
A foundational premise of Dynex's investor communication is that its experienced leadership team can protect shareholder capital across full market cycles through disciplined macro hedging and active portfolio positioning. The operational record from 2021 through 2024 provides a clear empirical test of that thesis.
The evidence challenging the claim is substantial. Book value per common share declined from $17.99 at the close of 2021 to $12.70 at the end of 2024, a drop of approximately 29%.1621 Even after adding back dividend distributions, cumulative total economic return over those three years was only modestly positive. A shareholder who purchased common stock at book value at year-end 2021 and collected dividends in cash saw their invested principal erode considerably while receiving payouts.
Conversely, the record provides affirmative evidence of durable risk controls. Dynex avoided the severe liquidity breakdowns and forced fire sales that historically destabilized leveraged spread vehicles, sustained uninterrupted dividend payments without cutting distributions to zero, and never required emergency dilutive capital or creditor forbearance. Its 2022 losses were more contained than those of many leveraged fixed-income peers, and the firm maintained sufficient liquidity to redeploy capital as mortgage spreads widened to historic levels.
Evaluating both sides narrows management's claim rather than disproving it entirely. The defensible reality is that disciplined risk management can prevent a funding-driven insolvency and survive historic interest-rate shocks. The unsustainable claim is that active hedging can insulate per-share book value from a secular widening in the mortgage basis. No hedging framework can eliminate basis risk without also eliminating the net interest spread the business is capitalized to capture. Over a complete interest-rate cycle, the key performance indicator that confirms management's narrower claim is cumulative total economic return per share; the event that would falsify it is forced balance-sheet deleveraging at depressed market prices.
Having navigated the tightening cycle with its liquidity intact but its per-share capital base diminished, Dynex confronted a critical strategic choice: retreat into safety, or lean aggressively into the widest mortgage spreads in a generation. Management chose to lean in.
VII. The Modern Era & The "Raise-and-Deploy" Engine: Co-CEOs, ATM Expansion & Capital Allocation (2024–2026) [1:33:30 – 1:52:00]
In late January 2026, Smriti Popenoe opened Dynex's fourth-quarter earnings call by highlighting a milestone that would have seemed improbable during the depths of the tightening cycle: the company had crossed $3 billion in market capitalization after tripling its equity base in roughly thirteen months.25 For 2025, common shareholders had recorded a 29.4% total shareholder return.25
While that performance marked a notable rebound, it also signaled a fundamental transformation in how Dynex operated—raising critical questions about the risks embedded in rapid balance-sheet expansion.
The governance transition
In July 2024, Dynex formalized an executive succession plan by elevating Popenoe to co-chief executive officer alongside Boston, who continued as chairman and co-CEO.11 Boston described the appointment as "a natural step, given the key role she has played in growing Dynex."11 Lead independent director Julia Coronado, who had assumed that governance post in December 2023, characterized Popenoe as "an exceptional leader."114 Concurrently, Rob Colligan was promoted to chief financial officer and chief operating officer.11
The leadership bench continued to evolve over the subsequent eighteen months. T.J. Connelly was named chief investment officer, and by early 2026 Michael Sartori assumed the CFO post, while Colligan transitioned to senior advisor to the co-CEOs.234
The board framed the co-CEO arrangement as a "formalized continuation" of an executive partnership spanning nearly three decades.4 While dual-CEO models across corporate America often signal unresolved succession dynamics, Dynex's structure functioned as a phased transition: Boston, who reached retirement eligibility in November 2023 according to the proxy filing, maintained strategic oversight as chairman, while Popenoe directed day-to-day portfolio and corporate operations.4 For investors, the primary governance risk centers on key-person concentration: the firm's strategic edge and institutional memory reside within a remarkably small leadership circle.
Pay: what the proxy actually shows
Executive compensation reflected the company's surging capital base. For 2025, Boston received total compensation of $7.77 million and Popenoe earned $7.68 million.4 Each executive received a base salary of $900,000, equity awards carrying a grant-date value of approximately $3.12 million, and an annual cash incentive bonus of roughly $3.19 million.4 That cash incentive paid out at 177.4% of target.4 At the 2025 annual meeting, approximately 95% of votes cast supported the company's advisory say-on-pay proposal.4
The performance metrics governing those annual cash awards reveal how management's priorities are structured. Absolute total economic return accounted for 22.5% of the scorecard, paying out at the maximum level after Dynex generated a 21.6% return against an 8% target and a 12% ceiling.4 Relative total shareholder return contributed another 22.5%.4 Crucially, 25% of the bonus formula was tied directly to "Capital Growth"—measuring net equity raised against a threshold of $50 million, a target of $120 million, and a maximum of $250 million.4 Because Dynex raised $1.2 billion of new equity during the year, executives achieved the maximum payout on that component as well.4
Long-term equity grants incorporated tighter per-share performance hurdles, utilizing performance share units that vest based on three-year absolute total economic return per share alongside relative total economic return measured against peers.4
Myth vs. reality: "internal management removes the incentive to grow for growth's sake"
The conventional case for internally managed mortgage REITs emphasizes governance alignment. Unlike externally managed peers that pay outside advisers base management fees tied directly to gross assets or equity—incentivizing perpetual share issuance regardless of per-share dilution—an internally managed REIT pays salaried employees directly.
The company's proxy disclosures introduce important nuance to that distinction. With a quarter of the annual executive cash incentive tied explicitly to capital growth, management faced a direct pecuniary incentive to expand balance-sheet scale. While long-term equity units do incorporate per-share return hurdles, the structure demonstrates that internal management does not wholly eradicate asset-gathering incentives. In practice, executive compensation is partially aligned with per-share economic performance and partially driven by absolute balance-sheet expansion.
Executive stock ownership provides another calibration of alignment. As of March 25, 2026, Boston beneficially owned 862,422 common shares and Popenoe held 289,471 shares; all executive officers and directors as a group held approximately 1.58 million shares, representing less than 1% of outstanding equity.4 No external institutional investor held more than a 5% stake.4 While these holdings represent substantial personal wealth, they constitute a fractional interest in a vastly diluted equity base, providing moderate personal alignment rather than the concentrated owner-operator dynamic typical of founder-led firms.
The raise-and-deploy engine
The pace of capital generation reshaped Dynex's operational footprint. After raising $332.0 million of net equity in 2024 through at-the-market (ATM) continuous offering programs, which allow the company to issue shares incrementally into secondary trading markets,21 Dynex raised $1.2 billion in 2025.1 Issuance continued at scale into 2026, generating $442 million in the first quarter and $391 million in the second quarter, the latter through the sale of roughly 30 million shares.222
Portfolio expansion mirrored that equity influx. Total investment holdings climbed from $9.83 billion at the end of 2024 to $19.43 billion at year-end 2025, reaching $24.77 billion by March 2026 and $27.6 billion by June 2026.211222 Outstanding common shares expanded from 23.7 million at the end of 2020 to 57.0 million at year-end 2023, 84.5 million at the end of 2024, and 237.4 million by mid-2026.1420212 Over an interval of less than six years, the company's common share count expanded tenfold.
Management defended that rapid issuance by asserting that equity sales were completed at or above per-share book value and deployed into spreads exceeding the firm's hurdle rate. On the first-quarter 2026 earnings call, leadership reiterated the operating premise that its "cost of capital is lower than return on deployed capital."23 On the fourth-quarter 2025 call, Connelly estimated expected hedged returns in the "mid-teens" at approximately seven times leverage, rising to the "mid to high teens" at leverage ratios in the low eights.25
In September 2026, Dynex diversified its funding structure by tapping the fixed-income market. The company priced 4.8 million shares of 9.375% Series D cumulative redeemable preferred stock, targeting $120 million in gross proceeds with an underwriter over-allotment option for an additional 720,000 shares.3 The offering is scheduled to close on September 29, 2026, with the shares slated to trade under the ticker DXPRD.3 While preferred stock avoids diluting common book value per share, its 9.375% fixed dividend imposes a substantial structural hurdle that sits senior to common distributions and must be generated across every market environment.
Historical falsification: capital allocation discipline
The central premise underpinning management's strategy is that programmatic ATM equity issuance is opportunistic, non-dilutive, and enhances long-term per-share value.
The historical per-share performance presents substantial counterevidence to that thesis. Book value per common share fell from $19.08 at year-end 2020 to $12.90 by mid-2026, even as total shares outstanding multiplied tenfold.142 If balance-sheet scaling compounded per-share economic value, the combined trajectory of book value per share and cumulative dividend distributions should demonstrate steady growth. Instead, between year-end 2021 and mid-2026, book value per share contracted by $5.09 while cumulative common dividends totaled approximately $7.74 per share—yielding positive but modest net economic value creation over a four-and-a-half-year span.1622021122
The primary evidence supporting management's execution centers on 2025, when Dynex delivered a 21.6% total economic return alongside its most aggressive equity issuance, supported by disclosures that shares were issued at accretive levels relative to prevailing book value.124
The operational verdict remains nuanced: the historical record demonstrates that issuing stock at a premium to book value can generate incremental per-share accretion during benign market conditions, but it concurrently expands the capital base exposed to subsequent spread widening shocks. The ATM engine has operated primarily during a favorable spread environment. The true full-cycle test is whether cumulative total economic return per share across both tightening and easing regimes exceeds what a disciplined, stable-scale balance sheet would have delivered.
That outcome depends not only on internal execution, but on the competitive fixed-income landscape where Dynex must deploy its expanded capital base.
VIII. Competitive Landscape, Industry Structure & The Moat Falsification Test [1:52:00 – 2:09:00]
Imagine three ships navigating the same stretch of ocean: an aircraft carrier, a large cruiser, and a nimble frigate. They face identical winds and waves, purchase repo financing from the same dealer desks, and target the same net interest yield. The central competitive question is whether the frigate's agility offers a durable advantage when the entire ocean moves.
The peer group
Annaly Capital Management (NYSE: NLY) is the aircraft carrier. As of June 30, 2026, it reported a $109.4 billion total portfolio, comprising $95.0 billion of agency assets, $4.1 billion of mortgage servicing rights, and $10.4 billion of residential credit.27 It operates a more diversified business model, running at an economic leverage ratio of 5.6 times shareholders' equity.27 Annaly's structural advantage lies in scale and diversification: mortgage servicing rights, for instance, tend to appreciate when interest rates rise, partially offsetting agency bond price declines. Its operational drawback is that repositioning an eleven-figure balance sheet takes considerable time and risks moving secondary market prices.
AGNC Investment Corp. (Nasdaq: AGNC) represents the cruiser and provides the closest pure-play large-scale comparison. The company reported a $97.2 billion investment portfolio at mid-2026, including $9.7 billion in net forward TBA positions, while operating at a tangible leverage ratio of 7.4 times.26 Its operating expenses ran at an annualized rate of 0.96% of average stockholders' equity.26
Dynex functions as the frigate, managing a $27.6 billion portfolio.2 Following its aggressive equity expansion, the firm is large enough to secure competitive repo terms as a meaningful counterparty to Wall Street broker-dealers, yet small enough to shift allocations across coupon stacks or reallocate between physical pools and generic TBA contracts relatively quickly—as demonstrated when management curtailed TBA exposure in early 2026.23
Externally managed peers such as ARMOUR Residential REIT and Orchid Island Capital complete the pure-play agency landscape. Their external advisory fee structures provide the primary benchmark for Dynex's internal-management pitch—an argument the compensation analysis above showed to be partially nuanced by growth-linked incentive pay.
The cost gap
Operating expense efficiency is critical in a spread-lending business where net margins hover near one percentage point. AGNC maintained operating expenses below 1% of equity.26 By contrast, Rob Colligan, then chief financial officer, guided on Dynex's January 2026 earnings call that general and administrative expenses would remain near the "2% of capital range" as the company continues investing in human talent and analytics technology.25 That gap of approximately one percentage point of return on equity represents a structural drag that Dynex must overcome through superior security selection or tactical market timing. While balance-sheet expansion is theoretically supposed to dilute fixed overhead, the rate of expense convergence serves as an empirical test of whether rapid capital raising is generating genuine economies of scale for shareholders.
Hamilton Helmer's 7 Powers
Evaluating Dynex through Hamilton Helmer's 7 Powers strategy framework clarifies whether the company possesses a structural competitive advantage or merely executes a commoditized playbook with disciplined agility.
Scale economies: Present only marginally. Larger mortgage REITs can spread overhead across a broader equity base and may secure slightly tighter financing haircuts from repo lenders. In practice, however, that operational efficiency is easily overshadowed by mortgage spread volatility: a shift of just a few basis points in the mortgage basis, multiplied across eight times leverage, quickly eclipses any modest expense advantage.
Network effects: Absent. Accumulating additional mortgage bonds confers no incremental value or utility on other market participants.
Counter-positioning: Absent. Dynex operates the same underlying business model as commercial banks, fixed-income hedge funds, AGNC, and Annaly.
Switching costs: Absent on both sides of the ledger. Common shareholders can reallocate capital from DX to AGNC in seconds, while repo counterparties can easily redirect liquidity to any dealer or fund pledging eligible collateral.
Branding: Absent in asset pricing. An agency bond backed by Fannie Mae trades at the identical market price regardless of whether it resides on Dynex's balance sheet or sits with a sovereign wealth fund.
Cornered resource: Present only in the narrow, fragile sense of human capital. Boston and Popenoe bring decades of institutional memory and trading relationships across multiple market cycles. However, human talent inevitably retires, transitions, or departs—a reality reinforced by proxy disclosures documenting Boston's retirement eligibility.4
Process power: The only viable candidate for a structural edge. Dynex maintains that its comprehensive risk framework, multi-scenario modeling, and granular specified pool selection deliver superior risk-adjusted returns over time. The historical evidence is mixed: the rapid de-risking in March 2020 demonstrated exceptional agility, yet per-share book value erosion during the 2022–2024 tightening cycle mirrored broader industry declines, even if the 2025 rebound proved robust. Corporate disclosures offer one quantitative signal: 148% of the relative total economic return performance units granted in 2023 vested for the three-year performance cycle ending in 2025, confirming above-median peer performance over that specific window.4
Moat verdict
Dynex does not possess a structural economic moat in the Helmer framework. The firm operates as a skilled, disciplined fixed-income allocator within one of the most liquid, efficient, and heavily commoditized financial markets in the world. Its defensibility relies almost entirely on process discipline and executive talent—qualities that constitute a competitive edge only if they prove repeatable across leadership transitions and shifting monetary regimes. The historical record leaves that edge plausible but unproven over a complete cycle. The definitive performance indicator that would substantiate management's claim is sustained outperformance in cumulative total economic return per share relative to AGNC and Annaly over rolling three- to five-year periods.
In the absence of a structural moat, the fundamental question becomes who holds the real pricing power across the mortgage ecosystem—and the answer is rarely the mortgage REIT itself.
IX. Porter’s Five Forces Analysis [2:09:00 – 2:22:00]
Picture the morning after a volatile session in fixed-income markets. Somewhere, the head of a bank repo desk is deciding how much balance-sheet capacity to allocate to mortgage REITs for the coming month. Somewhere else, policymakers in Washington are assessing whether Fannie Mae and Freddie Mac should expand their mortgage bond purchases. Neither decision-maker is focused on Dynex, yet both will directly determine its quarterly performance.
1. Bargaining power of suppliers: extremely high
Dynex relies on two distinct groups of suppliers. The first is funding: the broker-dealer desks that provide repurchase agreements. In stable markets, repo financing is abundant and inexpensive. During periods of market dislocation, dealers widen haircuts and curtail credit lines, leaving leveraged borrowers with virtually no negotiating leverage. Dynex maintains a substantial liquidity buffer precisely because counterparty pricing power is so asymmetrical.
The second supplier is policy. The Federal Reserve and federal housing regulators control the net supply of agency mortgage-backed securities available to private capital. In January 2026, President Trump directed Fannie Mae and Freddie Mac to purchase $200 billion of mortgage bonds to exert downward pressure on mortgage rates, and the Federal Housing Finance Agency subsequently expanded the enterprises' portfolio caps, according to reporting by Fortune.28 On Dynex's fourth-quarter earnings call, Chief Investment Officer T.J. Connelly argued that the intervention would "reset the spread regime tighter while limiting spread widening."25
That policy support represents both a near-term tailwind and an enduring structural vulnerability. A policymaker who can compress mortgage spreads with an executive directive can just as easily reverse course or alter regulatory mandates, and an agency mortgage REIT has no seat at that decision-making table.
2. Bargaining power of buyers: high
When Dynex liquidates or rebalances its portfolio, it operates as a pure price-taker in a vast, liquid global market. It cannot command an illiquidity premium or negotiate custom pricing. The only "buyer" that dictates bond valuations is the marginal buyer of agency paper—an institutional role that has rotated across decades among the Federal Reserve, domestic commercial banks, foreign central banks, institutional money managers, and, most recently, the government-sponsored enterprises.
3. Threat of new entrants: moderate
Launching a private mortgage hedge fund is relatively straightforward for experienced fixed-income traders backed by institutional seed capital. Establishing an internally managed, publicly listed mortgage REIT—supported by dozens of active repo lending relationships, an established at-the-market equity program, and regular access to the preferred stock market—presents far steeper operational barriers. Yet that institutional structure insulates only Dynex's corporate entity, not its investment returns. Any commercial bank, sovereign wealth fund, or relative-value hedge fund can purchase identical agency mortgage pools and compete for the same net interest spread.
4. Threat of substitutes: very high
For the income-seeking investors who allocate capital to mortgage REITs, alternative yield vehicles are ubiquitous: short-term Treasury bills, investment-grade corporate credit, high-yield debt, business development companies, private credit funds, and competing mortgage REITs. When cash and short-term debt instruments offer attractive yields with minimal duration risk, a leveraged investment vehicle must offer an eye-catching dividend yield to attract and retain shareholder equity. That substitution pressure explains why Dynex's dividend yield hovers in the double digits: equity investors demand significant compensation for bearing the book-value volatility and spread risk they could avoid elsewhere.
5. Competitive rivalry: fierce
Every institutional participant in the agency mortgage ecosystem bids on the identical pool of government-guaranteed collateral and finances those positions across the same Wall Street repo desks. Excess economic spreads are competed away rapidly whenever secondary-market yields become attractive. As a result, the most compelling investment windows emerge precisely when broad market turmoil sidelines or constrains peer capital, as occurred in 2022 and 2023, and steadily compress as liquidity returns to the market.
What the Five Forces imply
The competitive architecture of the industry explains Dynex's financial performance far more reliably than any single management decision. Returns on equity surge when systemic fear is elevated and market capacity is constrained; they diminish when market calm returns and institutional capital floods the trade. That dynamic makes the disciplined timing of equity issuance the company's central strategic lever—and leaves its long-term performance heavily dependent on macroeconomic forces outside its control. That structural dependency frames the next critical question: what specific balance-sheet shocks could derail the spread engine from here?
X. Material Risk Radar & Skeptical-Investor Stress Test [2:22:00 – 2:34:00]
In the final week of March 2026, as the first quarter came to a close, mortgage spreads widened abruptly. Dynex had spent the opening three months deploying $6 billion of net new investments funded by newly raised capital and repurchase agreements.22 By the end of the quarter, book value per common share had dropped by $0.85 to $12.60, driven by a $140 million net loss on the investment portfolio after hedging.22 Just a few weeks later, management estimated that per-share book value had rebounded to $13.31.23 By June 30, it settled at $12.90, and by July 17 drifted to approximately $12.67.224
Those sharp fluctuations across a single four-month window illustrate the balance-sheet vulnerabilities in miniature.
1. Mortgage basis widening: the primary threat
The mechanics of basis risk were outlined earlier, but the defining change is the sheer scale at which Dynex now bears that exposure. Operating at an economic leverage ratio of 8.1 times shareholders' equity, the company's expanded asset base magnifies the dollar impact of any basis move far beyond what it experienced in 2022, when total assets stood at just over $3 billion.216 Potential catalysts for spread widening include a policy reversal on government-sponsored enterprise purchases, renewed balance-sheet retrenchment by commercial banks navigating regulatory capital rules, or heavy Treasury supply drawing institutional capital away from mortgages.
The opening quarter of 2026 offered a sharp test of that vulnerability. In January, Popenoe argued that GSE buying support had removed "big downside risk from spread widening."25 Within roughly ten weeks, a sudden widening episode triggered a negative total economic return for the first quarter.22 While the thesis may remain valid in the narrower sense that GSE intervention limits the extreme tail risk of spread widening, it failed to shield the expanded portfolio from an immediate and meaningful drawdown.
2. Prepayment and refinancing risk
Federal Reserve interest-rate reductions have lowered Dynex's short-term borrowing expenses, with repo funding costs declining by approximately 33 basis points quarter over quarter in early 2026.22 That reduction directly widens the gross funding spread. The countervailing risk is that if primary mortgage rates decline sufficiently, homeowners holding higher-rate mortgages refinance, returning principal at par on bonds Dynex acquired at a premium. This negative convexity dynamic is where granular specified pool selection must demonstrate its value, and where management's strategic decision to trim forward TBA allocations in favor of custom pools will be rigorously tested.
3. Repo disruption
An unexpected spike in short-term benchmark rates or balance-sheet rationing by Wall Street broker-dealers around quarter-end could squeeze the repo funding channel. Dynex's $1.6 billion liquidity reserve provides a meaningful cushion against short-term margin calls, representing half of shareholders' equity, but that buffer remains finite when matched against a $27.6 billion investment portfolio.2
4. Policy and political risk
The GSE purchase mandate introduced a powerful, politically sensitive variable into mortgage valuations. Fortune reported that market critics characterized the initiative as a temporary "sugar high," while noting that the Federal Housing Finance Agency later described the expanded portfolio caps as merely providing "legal flexibility."28 Any subsequent policy shifts—such as proposals to end government conservatorship for Fannie Mae and Freddie Mac, alter guarantee fees, or adjust enterprise balance-sheet limits—would directly alter secondary-market pricing and prepayment speeds across agency paper. Wall Street analysts underscored that uncertainty during the January 2026 earnings call, with Trevor Cranston of Citizens JMP probing the potential for additional government interventions and Bose George of KBW questioning whether the $200 billion directive represented a firm cap.25
5. The activist-style stress test
A skeptical institutional investor evaluating the balance sheet would focus on four core vulnerabilities:
Growth versus per-share value: Why has per-share book value failed to recover its prior highs even as the firm expanded its capital base fivefold since 2022? Management maintains that programmatic equity issuance occurred at accretive prices and captured compelling investment spreads, but a skeptical observer can counter that rapid balance-sheet expansion has multiplied gross risk exposure without yet establishing a durable record of per-share capital compounding.
Incentive design: Why is 25% of executive annual cash bonuses tied directly to gross capital raised? The compensation committee could easily redirect that weighting entirely toward per-share total economic return hurdles without diminishing operational incentives.4
Cost structure: Why do operating expenses hover near 2% of equity when larger peer AGNC operates below 1%, and at what asset threshold will scale economies meaningfully narrow that operating drag?2526
Leverage timing: Dynex's adjusted leverage ratio reached 8.6 times equity in March 2026, touching the upper boundary of the 7.5 to 8.5 times target range management subsequently framed.2224 Operating near the ceiling of historical leverage precisely when the absolute balance sheet is at its largest leaves minimal margin for error if market volatility returns.
Management's defense
Management's counter-thesis is internally consistent: leadership argues that agency mortgage spreads remain elevated relative to historical norms, presenting an attractive window to generate high cash carry. On the second-quarter 2026 call, Connelly suggested that current-coupon spreads relative to seven-year benchmark yields could settle between 100 and 120 basis points as a "potential equilibrium over time," while management characterized agency MBS as offering "the best risk-reward across our investment universe for this macro environment."24 Furthermore, maintaining 51% of total shareholders' equity in liquid reserves provides a formidable defense against forced deleveraging.2 That defense presents a reasoned economic argument for expected returns under benign or stable conditions. What it does not demonstrate is that underlying balance-sheet volatility has been neutralized. Those competing realities set up the final bull and bear debate.
XI. The Investment Spine: Bull Case, Bear Case & Critical KPIs [2:34:00 – 2:47:00]
Consider two analysts reviewing Dynex's second-quarter 2026 financial report. One focuses on a 6.4% quarterly total economic return and a net interest spread that expanded from 0.75% to 1.16% over six months.21 The other focuses on book value per share of $12.90, below where it began the year, alongside a common share count that nearly tripled in eighteen months.2121 Both readings reflect disclosed financial realities. The debate centers on which dynamic will dominate performance over the coming cycle.
The bull case
1. A structurally better spread regime. Re-entry by the government-sponsored enterprises as buyers and Federal Reserve interest-rate reductions have lowered short-term borrowing expenses. If mortgage spreads settle near management's projected equilibrium, the portfolio captures substantial net interest carry with less mark-to-market volatility than during the 2022–2023 tightening cycle.2425
2. The carry engine is stronger. Dynex's net interest spread improved from 0.75% at year-end 2025 to 1.16% by mid-2026 as repo financing costs dropped.12 Higher cash carry provides a thicker recurring income buffer to absorb adverse mark-to-market swings.
3. Capital raised in a good window. Dynex raised roughly $2.4 billion of net common equity between 2024 and mid-2026, deploying those proceeds into secondary spreads that management characterized as historically wide.211222 If those assets were acquired near peak spread levels, the enlarged capital base can compound earnings power across subsequent monetary easing cycles.
4. Proven survival instincts. Management's swift de-risking during the March 2020 liquidity freeze demonstrates an institutional willingness to cut risk early to preserve solvency during periods of acute financial stress.13
The bear case
1. Spread tightening already happened, and the risk is asymmetric. Because policy interventions and enterprise purchases have already compressed mortgage spreads from their cycle peaks, the headroom for incremental price appreciation has narrowed, leaving the portfolio vulnerable to spread widening if federal support recedes.28
2. The dilution wheel. Outstanding common shares have multiplied roughly tenfold since 2020.142 If an unexpected liquidity shock forces rapid balance-sheet deleveraging, Dynex could be compelled to liquidate assets at depressed valuations, while a lower stock price would render subsequent equity issuance sharply dilutive to existing shareholders.
3. Negative convexity whipsaw. Agency mortgages remain exposed to an asymmetrical convexity profile: falling benchmark yields accelerate homeowner prepayments and erode bond purchase premiums, while rising rates extend duration and depress prices. Both trajectories incur ongoing derivative rebalancing costs, and across a portfolio exceeding $27 billion, minor hedging inefficiencies or basis mismatches translate into substantial dollar losses.
4. Key-person and cost risk. Strategic execution depends on a small leadership circle, with Byron Boston already retirement-eligible under proxy disclosures, while general and administrative expenses near 2% of capital impose a persistent operational drag compared to AGNC's sub-1% cost structure.42526
Weighing the spine
The bull case is fundamentally an argument about the environment; the bear case is an argument about structure. Financial history indicates that market environments shift far faster than institutional structures. Dynex's operational structure—high financial leverage, short-term repo funding, and unhedged mortgage basis exposure—remains unchanged; what has expanded dramatically is its balance-sheet scale. The investment thesis therefore rests on an operational assumption that remains untested at this magnitude: that management can detect the next spread-widening regime early enough to deleverage defensively before market liquidity evaporates, replicating its 2020 execution across an asset base five times larger.
The three KPIs that matter
1. Total economic return per share. The change in book value per share plus dividends declared, divided by beginning book value. This metric cuts through statutory accounting noise and confirms whether the enlarged balance sheet is generating genuine per-share economic value over time.
2. Economic net interest spread. The yield spread between asset yields and all-in hedged borrowing costs, incorporating TBA dollar-roll income. It indicates whether the core carry engine is strengthening or eroding as interest rates, prepayment speeds, and derivative hedges evolve.
3. Leverage including TBAs at cost. Management's stated operating range spans 7.5 to 8.5 times shareholders' equity.24 Movement toward the upper boundary of that range during calm market conditions, or an inability to reduce leverage as spreads tighten, serves as an early indicator of whether balance-sheet discipline is holding.
These three indicators, tracked sequentially across quarterly reporting cycles, reveal whether the spread engine is functioning effectively. The final question is what broader lessons Dynex's multi-decade trajectory offers for the fixed-income markets.
XII. Playbook & Core Business Lessons [2:47:00 – 2:58:00]
Somewhere in a filing cabinet in Glen Allen, Virginia, there is presumably still a folder on the MERIT Series 13 bonds. It remains a telling artifact: virtually every operational rule in the modern Dynex playbook represents a direct reaction to the structural vulnerabilities preserved in that file.
Lesson 1: Separate credit risk from liquidity risk
The original incarnation of Dynex combined borrower credit default risk with short-term warehouse funding lines—a convergence that brought the firm to the brink of insolvency in the late 1990s.5 In its second iteration, Dynex eliminated underlying borrower credit risk by shifting entirely into government-guaranteed paper, retaining only interest-rate, basis, and repo funding exposure. That singular focus enabled the firm to navigate the March 2020 liquidity freeze with its capital base intact.1314 The broader institutional takeaway extends across banks, insurers, and specialty lenders: a leveraged balance sheet can often absorb a localized credit downturn or an isolated liquidity squeeze, but coupling correlated credit and funding risks on high leverage is historically how financial institutions fail.
The critical caveat is that insulating the balance sheet from borrower defaults does not extinguish risk; it concentrates vulnerability into the mortgage basis and interest-rate volatility. As the 2022–2023 monetary tightening cycle demonstrated, that concentrated spread risk can severely impair per-share book value even when borrower default rates remain near zero.16
Lesson 2: Governance structure shapes behavior, but details matter
An internal management structure is broadly considered superior to an external management model because it eliminates the most glaring conflict of interest: paying an outside adviser asset-gathering fees regardless of shareholder returns. Yet Dynex's executive compensation disclosures illustrate that structural independence alone does not dictate executive incentives. When a corporate scorecard ties a substantial portion of annual cash bonuses directly to gross equity raised, it introduces a structural bias toward balance-sheet expansion that can run counter to per-share value compounding.4 For investors evaluating specialty finance vehicles, reading the granular incentive tables in the proxy statement matters far more than accepting broad governance labels.
Lesson 3: The myth of the perfect hedge
In leveraged fixed-income investing, a derivative structure designed to eliminate all market risk would simultaneously eradicate the net interest spread. Dynex hedges benchmark interest-rate movements through swaps and futures, but it deliberately leaves the mortgage basis exposed because capturing that spread is the foundational premise of the business model. Every high-yielding financial intermediary generates returns by taking a directional view on specific risks. The central analytical question for investors is identifying precisely which risk remains unhedged, and whether management is adequately capitalized to absorb the downside when that risk materializes.
Lesson 4: Capital allocation is a timing business
For spread investors, counter-cyclical capital allocation is paramount: the most advantageous window to raise equity and deploy leverage arrives when market spreads are historically wide and competing capital is constrained, while the most hazardous period occurs when spreads are tight and dividend yields appear deceptively secure. Dynex adhered to that discipline during the recent cycle, maintaining reduced leverage and preserving liquidity through 2022 before aggressively expanding its equity base and asset holdings across 2024, 2025, and into 2026.16211 However, the counter-cyclical playbook requires knowing not only when to accelerate capital raising, but also when to halt issuance and de-risk as spreads compress—an operational discipline that Dynex's enlarged balance sheet has yet to test over a full easing regime.
Lesson 5: Survival is a strategy
It can be tempting to view Dynex's nearly four-decade survival as a series of fortunate market cycles. Yet the roster of specialty finance firms and mortgage REITs that collapsed over that same span—from the 1998 Russian default through the 2008 financial crisis and the March 2020 liquidity freeze—demonstrates that survival often hinged on a handful of risk-management choices executed across a few critical days. Solvency across multiple cycles is not definitive proof of long-term capital compounding, but in a highly leveraged spread business, enduring each liquidity shock remains the indispensable prerequisite for everything else.
XIII. Epilogue [2:58:00 – 3:06:00]
Nearly four decades after its incorporation, Dynex Capital bears little resemblance to the originator that financed manufactured housing in the 1990s. Today, it manages a $27.6 billion, almost entirely agency mortgage portfolio directed by a compact internal team, funded through repurchase agreements, hedged with interest-rate swaps and futures, and supported by a common equity base that expanded faster over the past two years than at any prior point in its history.2
Where it stands today
The co-CEO leadership of Byron Boston and Smriti Popenoe represents a deliberate effort at institutional continuity: two executives whose careers intertwined at Freddie Mac and Sunset Financial now share executive oversight, with a next generation of investment and finance leaders developing beneath them.424 The board, led on the independent side by Julia Coronado, confronts a defining governance challenge over the coming years: preserving the risk-management discipline that protected the company in 2020 as the architects of that operational culture eventually step back.4
Dynex has also defined its macro positioning clearly. Management has leaned into what it characterizes as a historically favorable spread environment, supported by declining short-term borrowing costs and renewed buying support from the government-sponsored enterprises, funding that posture with common equity, repurchase agreements, and a new 9.375% preferred stock layer priced in late September 2026.3
Own for decades, or trade the cycle?
The underlying reality is that Dynex's economics are cyclical by construction. Per-share returns depend on mortgage spreads, interest-rate volatility, and regulatory policy far more than on internal operational levers. What management controls is when to expand the balance sheet, when to de-risk, and how large a liquidity cushion to maintain. Over the modern era, leadership has demonstrated disciplined execution at de-risking and liquidity preservation. The aggressive post-2024 expansion represents the defining test of whether it can manage rapid growth just as effectively.
Investors who allocate capital to Dynex are, in practice, underwriting a specific premise: that an executive team that repeatedly navigated severe dislocations in fixed-income markets will identify the next liquidity freeze early enough to de-risk, even while managing the largest asset base in the company's history. The critical indicators to monitor remain total economic return per share, economic net interest spread, and balance-sheet leverage including forward contracts.
In leveraged spread investing, high-carry quarters and bold trades often capture market attention. But the institutions that endure across cycles are those that remain capitalized when trades turn against them. For Dynex, balance-sheet survival has always been the indispensable prerequisite for generating shareholder returns—and with its asset base at record scale, the operational high wire has never been longer.
References
-
Dynex Capital, Inc. Announces Fourth Quarter and Full Year 2025 Results (Form 8-K Exhibit 99.1) — U.S. Securities and Exchange Commission, 2026-01-26 ↩↩↩↩↩↩↩↩↩↩
-
Dynex Capital, Inc. Announces Second Quarter 2026 Results (Form 8-K Exhibit 99.1) — U.S. Securities and Exchange Commission, 2026-07-20 ↩↩↩↩↩↩↩↩↩↩↩↩↩↩↩↩↩↩↩↩↩↩↩↩↩↩
-
Dynex Capital, Inc. Announces Pricing of Public Offering of Series D Fixed-Rate Cumulative Redeemable Preferred Stock — Dynex Capital, Inc., 2026-09-22 ↩↩↩↩
-
Dynex Capital, Inc. Definitive Proxy Statement (DEF 14A) — Dynex Capital, Inc. / SEC, 2026-04-07 ↩↩↩↩↩↩↩↩↩↩↩↩↩↩↩↩↩↩↩↩↩↩↩↩↩↩↩
-
Dynex Capital, Inc. Form 10-K for Fiscal Year 2001 — U.S. Securities and Exchange Commission, 2002-03-27 ↩↩↩↩↩↩↩↩↩
-
Teamsters Local 445 Freight Division Pension Fund v. Dynex Capital Inc., 531 F.3d 190 (2d Cir. 2008) — FindLaw, 2008-06-26 ↩↩↩↩↩
-
Dynex Capital, Inc. Form 10-Q for the Quarter Ended March 31, 2012 — U.S. Securities and Exchange Commission, 2012 ↩↩↩↩↩
-
Dynex Capital, Inc. Form 8-K (Appointment of Thomas B. Akin as Chief Executive Officer) — U.S. Securities and Exchange Commission, 2008-02-04 ↩↩↩↩
-
LEADERS Interview with Byron L. Boston, Chief Executive Officer and Co-Chief Investment Officer, Dynex Capital — LEADERS Magazine, 2023-07 ↩↩↩↩↩↩↩↩↩
-
Glen Allen's Dynex Capital names co-CEO — Virginia Business, 2024-08-05 ↩↩↩↩↩
-
The Strategic Evolution of mREIT Dynex Capital — Nareit REIT Magazine, 2020-03 ↩↩
-
Dynex Capital Inc (DX) Q1 2020 Earnings Call Transcript — The Motley Fool, 2020-05-06 ↩↩↩↩↩↩↩↩
-
Dynex Capital, Inc. Reports Fourth Quarter and 2020 Full Year Results (Form 8-K Exhibit 99.1) — U.S. Securities and Exchange Commission, 2021-02-04 ↩↩↩↩↩↩↩
-
MBS Market Dysfunctions in the Time of COVID-19 — Federal Reserve Bank of New York, Liberty Street Economics, 2020-07 ↩↩↩↩
-
Dynex Capital, Inc. Announces Fourth Quarter and Full Year 2022 Results (Form 8-K Exhibit 99.1) — U.S. Securities and Exchange Commission, 2023-01-30 ↩↩↩↩↩↩↩
-
Plans for Reducing the Size of the Federal Reserve's Balance Sheet — Board of Governors of the Federal Reserve System, 2022-05-04 ↩
-
Federal Reserve Issues FOMC Statement — Board of Governors of the Federal Reserve System, 2023-07-26 ↩
-
FDIC Announces Plans for Sale of Securities Portfolios of Signature Bank and Silicon Valley Bank — Federal Deposit Insurance Corporation, 2023-04-05 ↩↩
-
Dynex Capital, Inc. Announces Fourth Quarter and Full Year 2023 Results — Dynex Capital, Inc., 2024-01-29 ↩↩↩↩↩
-
Dynex Capital, Inc. Announces Fourth Quarter and Full Year 2024 Results (Form 8-K Exhibit 99.1) — U.S. Securities and Exchange Commission, 2025-01-27 ↩↩↩↩↩↩↩↩↩
-
Dynex Capital, Inc. Announces First Quarter 2026 Results (Form 8-K Exhibit 99.1) — U.S. Securities and Exchange Commission, 2026-04-20 ↩↩↩↩↩↩↩↩↩↩
-
Dynex Capital Q1 Earnings Call Highlights — Yahoo Finance, 2026-04 ↩↩↩↩↩↩
-
Dynex Capital Q2 Earnings Call Highlights — Yahoo Finance, 2026-07 ↩↩↩↩↩↩↩↩
-
Dynex Capital (DX) Q4 2025 Earnings Transcript — The Globe and Mail, 2026-01-26 ↩↩↩↩↩↩↩↩↩↩↩
-
AGNC Investment Corp. Announces Second Quarter 2026 Financial Results (Form 8-K Exhibit 99.1) — U.S. Securities and Exchange Commission, 2026-07-20 ↩↩↩↩↩
-
Annaly Capital Management, Inc. Reports 2nd Quarter 2026 Results (Form 8-K Exhibit 99.1) — U.S. Securities and Exchange Commission, 2026-07-21 ↩↩
-
What happened to Trump's mortgage bond plan — Fortune, 2026-01-24 ↩↩↩
 LinkedIn
 WhatsApp
 Reddit
 Hacker News
 Email
Email Kindle
 RSS Feed
 Spotify
 Apple Podcasts
 Amazon Music
 Audible
 YouTube