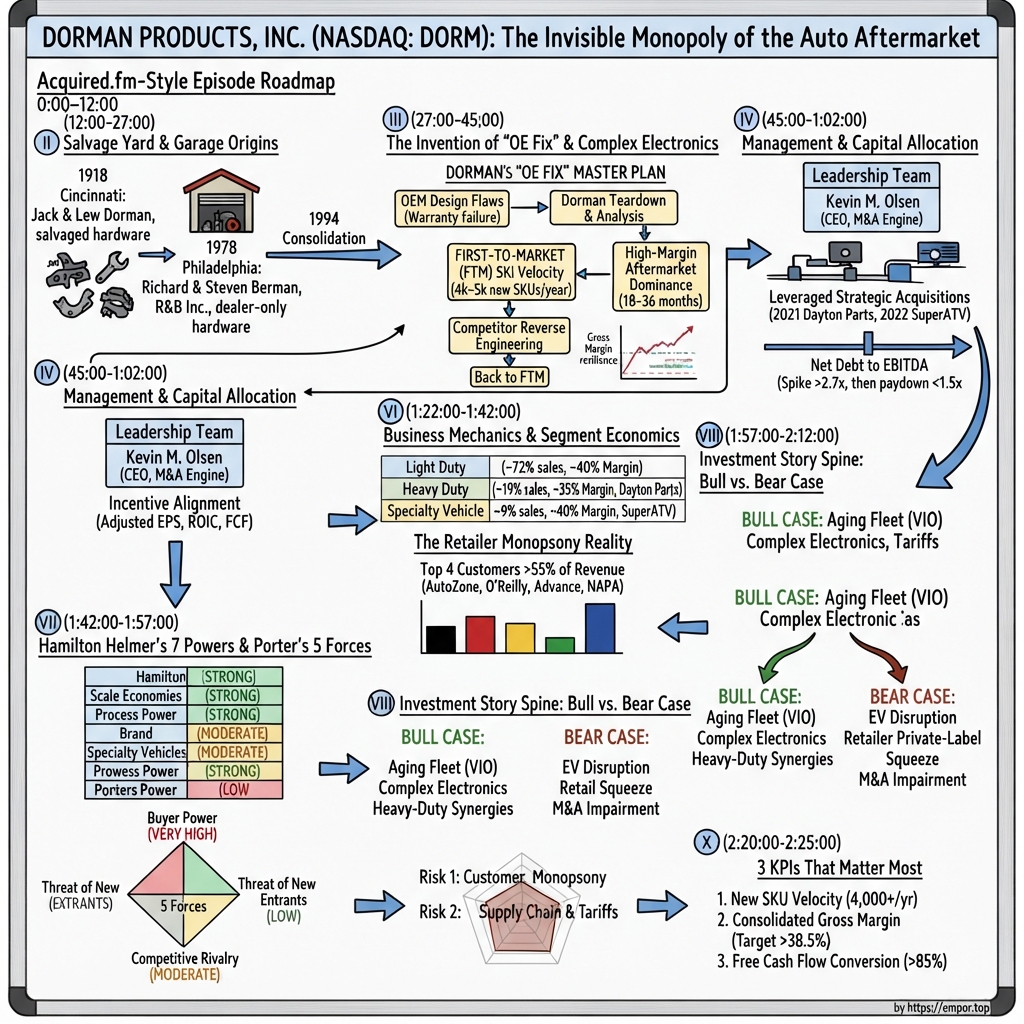
Dorman Products, Inc. (NASDAQ: DORM): The Invisible Monopoly of the Auto Aftermarket
I. Introduction & Episode Roadmap (0:00 – 12:00)
There is a specific aisle in every AutoZone, O'Reilly, and NAPA store in America that almost nobody photographs. It is not the glossy oil display or the wall of wiper blades. It is a rack of small red-and-yellow cards, each holding a plastic clip, a vacuum elbow, a window regulator bracket, or a drain plug — parts so unglamorous that they carry virtually no consumer brand equity, yet so specific that if a 2013 Chevrolet Equinox needs one, nothing else will substitute.
That rack represents the visible tip of a business that, in the fiscal year ended December 31, 2025, sold $2.13 billion in automotive replacement parts and marketed roughly 144,000 distinct part numbers.1 Dorman Products, Inc. does not manufacture most of what it sells, does not own the retail stores where its products sit, and maintains virtually no consumer advertising presence. Yet its shares traded near $129 in late August 2026, giving it a market value close to $3.9 billion — a dramatic evolution from March 2003, when the company (then named R&B, Inc.) reported an aggregate market value of stock held by non-affiliates of just $41.3 million.23
The premise of this analysis centers on a fundamental question: what exactly did Dorman build between those two valuations, and how durable is that business?
The company's core strategy relies on a trademarked concept — OE FIX — which management positions as solving design flaws inherent in original equipment parts. When an original equipment manufacturer designs a part that predictably fails after warranty expiration and restricts replacement units to its dealer network at elevated prices, Dorman reverse-engineers the part, identifies the failure mode, redesigns it, and sells an improved version into the aftermarket at a lower price point. In the second quarter of 2026, management highlighted an aluminum oil pan for Ford F-150s as a primary example, replacing an original plastic unit prone to warping and leaks with a design featuring a magnetic drain plug on an angled boss for complete fluid drainage.4 The product encapsulates Dorman's model: addressing a mundane part with a genuine engineering flaw at a price point main dealers cannot match.
The business operates across three primary segments, though financial performance is heavily concentrated in its core business. In fiscal 2025, Light Duty — covering passenger cars and light trucks — generated $1.69 billion in net sales, or roughly 79% of total revenue, and $347.3 million in segment operating income. Heavy Duty — commercial truck parts built around the 2021 acquisition of Dayton Parts — generated $232.6 million in sales and $5.1 million in segment operating income. Specialty Vehicle — powersports, side-by-sides, and ATVs expanded via the 2022 acquisition of SuperATV — produced $205.7 million in sales and $26.9 million in segment operating income.1
In summary, Light Duty accounts for 79% of revenue and roughly 92% of total segment operating profit. Meanwhile, the two acquisitions that cost Dorman approximately $855 million in cash between 2021 and 2022 together generate about 21% of sales and just 8% of segment operating profit. This earnings concentration forms the central tension of the investment case.
Key questions framing this story include:
How did Dorman build a catalog that auto retailers effectively must carry — and is retailer dependency as absolute as management suggests?
What risks emerge when two major customers account for 40% of net sales, and the four largest customers represent 78% of total receivables?1
Did management overpay at the top of the market cycle? In the fourth quarter of 2025, Dorman wrote off the entire $56.7 million goodwill balance of its Heavy Duty reporting unit.1 That impairment reflects an explicit accounting recognition that the Dayton Parts transaction underperformed expectations. Meanwhile, SuperATV missed the initial performance targets attached to its earn-out structure.5
How exposed is an internal-combustion catalog to long-term fleet electrification? Management noted on its first-quarter 2026 earnings call that battery-electric vehicles still represent under 2% of the North American light-duty fleet and projected that fleet mix transition will take "a very long time" to materialize.6 While this reflects current fleet demographics, it remains a critical structural variable to monitor.
Evaluating Dorman in mid-2026 is particularly relevant due to recent financial distortions. Over the past two years, income statements reflected significant tariff volatility — with duties initially absorbed, passed through into pricing, capitalized into inventory, and subsequently partially refunded following a Supreme Court ruling in February 2026.14 This sequence created temporary distortions across reported margins and cash flows. Management published reconciliations to adjust for this tariff windfall, offering visibility into core operating performance ahead of normalized comparison periods in 2027.
While Dorman is often characterized as an invisible monopoly, financial evidence supports only part of that narrative — and understanding where that characterization falls short is key to assessing its underlying valuation.
 Subscribe on LinkedIn
II. The Salvage Yard & The Garage: Two Roots of an Aftermarket Empire (1918–1994) (12:00 – 27:00)
Every good origin story has a garage. This one has two, separated by sixty years and six hundred miles.
The first was in Cincinnati, Ohio, in 1918, where a business named Dorman began selling hard-to-find parts and automotive hardware into an emerging aftermarket — a period when automobiles were novel, dealerships were sparse, and a broken bracket often required custom metalworking or salvage.7 For most of the twentieth century, Dorman operated primarily as a fastener and hardware brand, putting its name on boxes of drain plugs and body clips rather than functioning as an engineering firm.
The second garage opened in suburban Philadelphia in October 1978. Richard N. Berman, then 22, and his brother Steven L. Berman, then 19, incorporated R&B, Inc. in Pennsylvania with four employees.38 Rather than creating a new product category, the Bermans addressed a persistent operational bottleneck for local repair shops: replacement components restricted to original vehicle manufacturers, sold at dealer prices with extended delivery times. Sourcing or specifying those parts and delivering them directly to repair shops established R&B's initial business model.
R&B's early Securities and Exchange Commission filings framed the category plainly: "hard-to-find" parts meant "those which were traditionally available to consumers only from original equipment manufacturers or junk yards."8 The company's initial competition was not rival aftermarket suppliers, but the auto salvage economy itself.
The retail boom that made the model work. During the 1980s and 1990s, the American automotive aftermarket consolidated into major retail chains, including AutoZone, O'Reilly, Advance Auto Parts, Pep Boys, and the NAPA distribution network. This retail expansion created ideal conditions for R&B. Store operators required standardized, pre-packaged, barcoded, planogram-ready merchandise that store clerks could locate without relying on paper catalogs. R&B delivered blister-packed carded hardware under the HELP! brand, designed for self-service retail shelves. By 1996, the company serviced roughly 10,000 active accounts, with AutoZone accounting for approximately 14% of sales. In 1994, AutoZone and Pep Boys combined to generate 28% of total revenue.8
That customer concentration was not a temporary phenomenon; it has remained a defining structural condition of the business for over three decades.
The economics of carded hardware explain how R&B scaled and why its operating margins remained modest. R&B did not manufacture its products. Instead, it specified part dimensions, outsourced production to third-party manufacturers, received bulk shipments at facilities in the United States and Canada, inspected samples, and processed items through custom packaging lines — using blister, skin film, clamshell, bagging, and boxing machinery.1 The company's core intellectual property consisted of its proprietary part numbering system and fitment databases, while capital expenditure concentrated in packaging automation and warehousing. Retail buyers understood this model, as the underlying objective was establishing interchangeable inventory across store displays.
While that operational model produces steady cash flows at scale, it leaves smaller operators vulnerable. The 1990s provided R&B with distribution scale, but building a durable competitive advantage required higher-margin capabilities.
The consolidation. Effective January 1, 1995, R&B acquired the Dorman Products division from SDI Operating Partners L.P.8 The company had previously completed an initial public offering on March 12, 1991, at $7.63 per share, raising approximately $11.4 million while the Berman family retained roughly 75% equity ownership.3 The acquisition provided R&B with a century-old brand name and an established fastener line to complement its specialized replacement parts catalog. For a decade, the combined entity managed over 50 product brands — including Motormite, HELP!, Pik-A-Nut, Champ, Conduct-Tite, Look!, and Mighty Flow — before consolidating under its primary brand. In late 2005, management launched the "Dorman — NEW SINCE 1918" marketing campaign, and on May 26, 2006, shareholders approved renaming the corporate entity Dorman Products, Inc., changing its Nasdaq ticker from RBIN to DORM.7
Historical falsification pass: was the hardware franchise ever a moat?
Conventional narratives suggest that early distribution dominance with red HELP! card displays established an unassailable competitive moat. However, financial filings from that period demonstrate significant operational volatility and limited pricing power.
In fiscal 1999, R&B generated $236.7 million in net sales but posted a net loss of $3.6 million on operating income of $1.6 million. The loss resulted from an $11.4 million fourth-quarter restructuring charge ($7.5 million net of tax, or $0.90 per share), primarily reflecting inventory write-downs to eliminate underperforming items, the closure of a distribution facility in Carrollton, Georgia, and a reduction of 158 staff members.9
Top-line growth subsequently stalled. Net sales contracted to $201.4 million in 2000 and stood at $201.7 million in 2001 — representing a 15% revenue decline from the 1999 peak that required three years to recover.9 Gross margins averaged 34.1% in 2000 and 34.4% in 2001, reaching 36.7% in 2002 only after fiscal 2001 absorbed a $3.6 million inventory provision.9
Disclosures regarding revenue recognition further clarify the company's market position at the time. R&B noted that customer credit allowances included "the cost of competitors' products that are purchased from the customer in order to induce a customer to purchase new product lines from the Company."9 To secure retail shelf placement, Dorman frequently bought out incumbent competitor inventory from store operators. These concessions indicate a vendor bidding for retail access rather than a supplier exercising pricing power. Furthermore, by the end of fiscal 2002, the company's five largest customers represented 73% of total accounts receivable.9
Weighed conclusion. Historical financial data contradicts the premise that early hardware distribution established an intrinsic competitive moat. Throughout the late 1990s and early 2000s, Dorman generated mid-30% gross margins, underwent corporate restructurings, experienced top-line contractions, and funded inventory buybacks to secure retail positioning. The competitive advantages Dorman holds today were built through subsequent engineering and reverse-engineering capabilities rather than inherited from its fastener operations. This historical record illustrates Dorman's baseline performance when distributing commodity hardware against interchangeable rivals: approximately 34% gross margins, low single-digit operating margins, and limited pricing leverage.
This historical baseline context frames the company's subsequent strategic transition from hardware distribution to reverse-engineered replacement components.
III. The Invention of "OE Fix" & The Complex Electronics Pivot (1995–2015) (27:00 – 45:00)
Picture a windowless room in Colmar, Pennsylvania, filled with failed auto parts: a cracked plastic intake manifold, a window regulator with a disintegrated nylon cable guide, and an electronic control module that ceased communicating after years of engine heat cycles. Inside that facility, technicians disassemble failed components to address a question original vehicle manufacturers rarely prioritize: why did the part fail, and how can it be redesigned to last?
That teardown discipline represents Dorman’s core operational asset. While packaging lines, distribution facilities, and overseas supply networks can be duplicated with sufficient capital, reverse-engineering failure modes transformed a distributor generating 34% gross margins into an engineering-driven business achieving 42% gross margins.
The structural opportunity. Modern automobiles contain thousands of components that automakers design once for assembly lines and distribute as replacement parts through franchised dealer networks at substantial markups. Automakers face minimal incentive to over-engineer components beyond warranty periods, while maintaining strong incentives to retain replacement sales within dealer channels. The resulting price gap between original manufacturing cost and post-warranty dealer pricing creates Dorman’s addressable market opportunity.
Dorman avoids simply copying original equipment designs, which would trigger price competition against low-cost overseas manufacturers. Instead, the strategy focuses on engineering improvements — substituting aluminum for failure-prone plastic, enhancing heat dissipation, upgrading internal sensors, or strengthening connector seals. Branded as OE FIX solutions, management positions these items as "better repair solutions than the OEMs' alternative."1 For example, management highlighted a redesigned air suspension compressor for GM SUVs where the original unit frequently failed due to thermal stress, causing broader system damage. Dorman’s patent-pending replacement improves heat dissipation by roughly 25%, adds thermal protection, and uses proprietary software to manage performance.6
How Dorman knows what to build. Identifying replacement opportunities relies on structured data analytics rather than intuition. Dorman categorizes pipeline opportunities into three channels: parts available only from OEMs, components with recurring failure modes, and novel solutions non-existent in either channel.1 The company tracks vehicle fleet demographics — focusing on vehicles aged seven to fourteen years — alongside repair shop failure trends. Macroeconomic indicators frame this demand pool: total U.S. vehicles in operation reached 302.7 million in 2025, up about 1%; the average vehicle age on American roads rose to 12.9 years as of October 2025 from 12.8 a year earlier; and miles driven through October 2025 rose 1.0% year over year.1
However, an aging vehicle fleet generates broad repair demand rather than guaranteed volume for specific part numbers. Dorman captures revenue only when the correct replacement part is stocked in a local retail store when needed. Catalog management and supply chain logistics remain critical: of Dorman's 3,871 employees, 2,910 work in operations, while 233 work in product development and 256 in quality and engineering.1 A relatively small engineering core operates within an extensive distribution network.
From teardown to shelf. The product pipeline expands through three primary channels: parts available only from the OEM, parts with recurring failure modes, and genuinely new parts that exist in neither channel and improve the vehicle.1 Releases include entirely new aftermarket product categories as well as line extensions that broaden application coverage across additional vehicle makes, models, and model years. Line extensions yield steady incremental revenue on established designs with minimal risk, whereas launching a first-to-market part grants temporary exclusivity over a specific part number.
In 2025, light-duty product launches featured OE FIX exhaust manifolds, metal heater hose connectors, aluminum oil filter housings, active grille shutters, front impact sensors, and an expanding set of control modules and sensors, alongside additions to active suspension components, loaded knuckles, and chassis parts.1 This ongoing introduction cycle drives catalog expansion.
The velocity claim. Dorman’s growth strategy emphasizes speed to market: introducing part numbers quickly to capture initial high-margin demand before defending shelf placement through catalog depth and product quality. Disclosed introduction figures illustrate this operational cadence. The company introduced 6,106 distinct parts in 2023, 5,335 in 2024, and 5,560 in 2025. Within that, parts genuinely new to the aftermarket — the first-to-market subset, the ones nobody else sells at all — were 1,791 in 2023, 1,659 in 2024, and 1,608 in 2025.1
Notably, first-to-market product releases declined for three consecutive years.
Historical falsification pass: does launch speed actually protect the margin?
Testing the premise that launch velocity and proprietary engineering preserve gross margins against competitor entry highlights several operational constraints within company disclosures.
First, patent protection covers a small fraction of the catalog. As of December 31, 2025, Dorman held 132 patents and 82 pending applications worldwide — against roughly 144,000 marketed part numbers.1 Legal patent protection does not shield the vast majority of products.
Second, company disclosures explicitly cite fast-follower risk. Regulatory filings warn that Dorman cannot assure investors competitors will not "adopt fast follower strategies, based on our new product launches."1 This admission underscores constant pressure to maintain launch momentum.
Third, recent gross margin expansion resulted primarily from tariff timing rather than product mix changes. Consolidated gross margin went from 32.6% in fiscal 2022 to 35.5% in 2023, 40.1% in 2024, and 42.1% in 2025.1 Over that same span, first-to-market product launches steadily decreased. Management attributed 2025 margin gains primarily to tariff-related price increases taking effect before higher-cost tariffed inventory flowed through cost of goods sold under FIFO accounting, supplemented by supplier diversification and productivity work.110 On the fourth-quarter 2025 earnings call, outgoing leadership quantified the tariff benefit at approximately $1.25 of full-year adjusted diluted EPS of $8.87, a windfall management explicitly labeled a timing artifact and stripped out to produce a "comparable" 2025 base of $7.62.10
This transparent breakdown provided necessary context, preventing market participants from misinterpreting a temporary accounting benefit as a permanent structural gain.
Fourth, Dorman manufactures products for competitor private-label brands. In 2025, roughly 76% of products were sold under brands Dorman owns; the remainder went out under customers' private labels, other brands, or in bulk.1 Nearly a quarter of total revenue depends on supplying retailers' house brands.
Fifth, customer purchasing agreements remain non-binding. Supply arrangements with national retail chains do not obligate retailers to carry specific SKUs. Shelf space is reassessed during periodic line reviews, and regulatory filings acknowledge that retailers "may seek to purchase products from fewer but stronger suppliers" — a dynamic that works in Dorman's favor when it wins a review and against it when it doesn't.1
Weighed conclusion. While financial data confirms Dorman’s ability to convert engineering capabilities into premium margins — maintaining gross margins roughly twelve percentage points above direct peers like Standard Motor Products, which reported $541.0 million of gross profit on $1.79 billion of net sales in 2025, about 30.2% — that margin premium reflects an active operational lead rather than an unassailable moat.11 Superior profitability depends on continually launching unserved part numbers rather than relying on structural patents or exclusive contracts. Crucially, first-to-market product introductions contracted for three consecutive years even as reported gross margins expanded due to transient tariff dynamics.
If first-to-market introductions continue to slow as tariff timing benefits abate, gross margins will likely trend back toward the high-30% range. Management acknowledged this trajectory by guiding gross margin to exit 2026 at "approximately 40%" and calling that "a structural rate."4
A short detour on what "complex electronics" actually means
Evaluating Dorman’s long-term competitive position requires distinguishing traditional mechanical replacement components from complex electronic modules.
A conventional hardware part depends on physical shape and metallurgy; reproducing an exhaust manifold involves measuring dimensions and matching casting specifications. In contrast, a complex electronic component involves digital communication protocols. A modern fuel pump driver module does not merely supply power — it exchanges real-time data across vehicle networks, monitors system diagnostics, and alters behavior based on vehicle operational states. Developing a replacement requires reverse-engineering both physical hardware and digital protocols to satisfy OEM vehicle control units and avoid false diagnostic codes.
Consequently, Dorman emphasizes more than fifteen years of data-logging, electronics design, and co-development capability as the foundation of the effort, emphasizing software-enabled solutions rather than parts alone.10 Software-integrated components command higher average selling prices and carry stronger pricing leverage. As CEO Kevin Olsen noted, competing exclusively against original equipment manufacturers rather than aftermarket rivals yields the company's "highest level of gross margin percentage."16
However, verifying the magnitude of this competitive advantage remains difficult. Management has declined to disclose revenue figures or catalog counts for its complex-electronics portfolio, telling analysts the company does not break it out "for competitive reasons" and that it wants to "protect that moat."16 While commercially prudent, this lack of detailed disclosure leaves a central qualitative claim unverified by external financial reports, requiring investors to assess the strategy without direct segment reporting.
IV. Current Management, Governance & Capital Allocation (45:00 – 1:02:00)
On April 2, 2026, Dorman's board named Kevin Olsen chairman, consolidating the Chairman, President, and Chief Executive Officer roles into a single position. Steven Berman, who had served as chairman since 2011 and whose family still beneficially owns roughly 13% of the company's shares, remained on the board. Lead independent director Richard Riley framed the move as a planned succession executed "at a time of strength," noting that combining the roles "provides unified leadership and direction."121
While Dorman retains an independent lead director to maintain oversight, combining the top leadership positions reduced board independence while completing the founding family's transition out of the chair. As a result, the governance counterweight to executive authority became purely structural rather than personal. Shareholders, however, have voiced little dissent: approximately 97% of votes cast at the 2025 annual meeting favored the advisory say-on-pay resolution.13
Who Olsen is. Olsen’s background reflects financial operations in industrial conglomerates rather than traditional automotive manufacturing. He began his career in public accounting at PricewaterhouseCoopers before holding operational and financial roles at Danaher, Netshape Technologies, Crane Energy Flow Solutions, and Precision Castparts' Forged Products Aero Turbine division. He served as CFO of Colfax Fluid Handling from 2013 to 2016, then joined Dorman as CFO in July 2016, advancing to President and Chief Operating Officer in August 2018 and Chief Executive Officer in January 2019.1
That professional path highlights the operational playbook governing Dorman's recent strategy. Danaher and Colfax are well-known training grounds for continuous improvement and bolt-on acquisitions: rigorous metric tracking, steady productivity initiatives, and balance-sheet deployment into adjacent niches. Under Olsen, Dorman has executed this model directly — alongside its primary risk, which involves paying full valuation for adjacent businesses and finding that standard integration frameworks do not transfer seamlessly.
The chief financial officer seat transitioned in early 2026. David Hession, CFO since 2019, retired following the close of fiscal 2025, and Charles Rayfield assumed the role in January 2026.106 Hession's planned departure provided an orderly transition. Rayfield, joining from prior public and private CFO roles, expanded reporting transparency during his first two quarters by introducing adjusted EBITDA margin as a core metric and publishing reconciliation schedules that isolated the impact of tariff refunds across line items.64 Providing additional analytical detail during periods of peak reported earnings represents a noteworthy disclosure practice.
The board maintains standard governance protections, including clawback provisions covering cash and equity, anti-hedging and anti-pledging restrictions for officers and directors, stock ownership guidelines, caps on annual and long-term incentive payouts, and an executive severance plan without tax gross-ups.13 KPMG LLP continues as independent auditor, with no going-concern warnings, restatements, or material weakness disclosures in the fiscal 2025 annual report.113 While these policies are baseline governance standards, their presence ensures essential oversight.
What management is paid for. Executive compensation disclosure in the 2026 proxy details the company's incentive metrics. The 2025 annual cash bonus for corporate executives was tied 50% to adjusted pre-tax income, 25% to net sales, and 25% to free cash flow conversion measured as a percentage of net income. Long-term equity performance restricted stock units were divided equally between three-year relative total shareholder return against the Nasdaq US Benchmark Auto Parts Index and average return on invested capital.13
This incentive framework balances earnings growth, capital efficiency, and cash generation. However, the 2025 operational results revealed a distinct divergence between accounting performance and cash flow.
Adjusted pre-tax income reached $355.2 million, surpassing the target of $309.2 million and maximum payout threshold of $329.3 million to achieve a 200% payout factor. Net sales of $2,130.3 million exceeded the $2,089.6 million target, yielding a 167% payout. In contrast, free cash flow conversion reached 37% of net income, falling short of the 70% minimum threshold and 85% target, resulting in a zero payout for that component. The combined annual bonus payout equaled 142% of target.13
Evaluating compensation outcomes alongside tariff accounting reveals the driver of this disparity. The tariff price-before-cost timing dynamic that raised 2025 pre-tax income also required Dorman to fund higher-cost inventory. Inventory investments absorbed $250.4 million in cash during 2025, causing free cash flow to drop to $75.7 million from $191.6 million in 2024.1 Consequently, the incentive plan paid maximum awards on tariff-driven accounting earnings while providing no payout for cash conversion, netting out at a 142% total bonus. Although the formula was applied strictly without board intervention, the outcome highlights how accounting timing can temporarily decouple executive payouts from underlying cash conversion.
The capital allocation record. On the first-quarter 2026 earnings call, Rayfield outlined management's capital allocation priorities: maintaining target leverage, funding high-return internal investments ("where we see our greatest returns"), pursuing strategic acquisitions, and executing opportunistic share buybacks. Total capital deployed across these channels since 2020 reached approximately $1.8 billion.6
Deleveraging following recent acquisitions progressed rapidly. Net debt decreased to $391 million at year-end 2025, bringing the net leverage ratio to 0.89 times adjusted EBITDA compared to 1.12 times a year earlier. By the end of the second quarter of 2026, net debt fell to approximately $318 million, leverage reached 0.69 times, and total liquidity stood at $931 million.104 Management maintains a target leverage range below 2.0 times under normal operations, expanding up to 3.0 times for twelve months following a major transaction.6
Share repurchase activity has responded directly to market valuation. Dorman repurchased $41 million of shares in 2025 at an average price of roughly $127 per share. Following a stock price decline, the company deployed $51 million in the first quarter of 2026 to repurchase approximately 435,000 shares at an average price near $118, followed by $47 million in the second quarter to buy roughly 398,000 shares at the same $118 level. Rayfield attributed the increased buyback pace to "a dislocation in the market valuation for our stock."1364 Approximately $363 million remained under the existing share repurchase authorization at the end of the second quarter of 2026, extending through 2027.4
Recent debt financing reflects an emphasis on capital structure flexibility. In June 2026, despite net leverage remaining below 1.0 times, Dorman expanded its revolving credit facility from $600 million to $800 million, extending its maturity to 2031. Concurrently, the company issued $450 million of 6.250% senior unsecured notes due 2034, applying the proceeds to refinance a term loan originally maturing in October 2027.144 Replacing floating-rate debt with long-term fixed financing locks in borrowing costs, though carrying a 6.25% coupon at low leverage levels represents a deliberate expense to secure capital flexibility. On the second-quarter earnings call, Olsen pointed to an expanding M&A environment, citing increased deal flow compared to prior years, a predictable tariff landscape, stabilized interest rates, and target sellers who "have kind of reset with more rational valuations."16
That positioning underscores the strategic importance of management's capital allocation track record in prospective transactions.
Credibility scorecard. Management's operational reporting presents a balanced record. On execution transparency, leadership identified five strategic priorities for 2025 and reported specific progress on each, achieving its objective to reduce Chinese sourcing to below 40% of total spend. Management also disclosed detailed calculations isolating tariff timing effects from baseline earnings and provided forward margin guidance during periods of accounting complexity, stating on the call that "this is more color than we ordinarily provide."16 Conversely, fourth-quarter 2025 results fell "below our internal expectations" due to a major retail customer reducing orders by nearly 40% quarter-over-quarter during a distribution center consolidation. Although ordering patterns subsequently normalized, the event highlighted quarterly revenue sensitivity to major retail customers.106 Furthermore, in August 2026, management lowered full-year 2026 sales growth guidance from 7–9% to 3–5%, citing lower tariff-related pricing pass-through alongside volume softness in the first half of the year.4 While price adjustments reflect changing input costs, underlying volume trends remain a key metric for evaluating organic demand.
V. The M&A Expansion Engine: Dayton Parts & The SuperATV Stress Test (2021–2025) (1:02:00 – 1:22:00)
In the summer of 2021, macroeconomic conditions appeared ideal for expansion: freight rates reached record highs, commercial fleets faced tractor shortages, outdoor recreational spending surged, and interest rates sat near zero. In hindsight, it proved a difficult environment in which to purchase a cyclical commercial-vehicle supplier, followed shortly by a severe contraction in discretionary powersports demand.
Dorman executed both acquisitions.
What makes this sequence instructive is that both transactions aligned with Dorman's strategic model. Over two decades, the company built a core capability around identifying chronic component failure modes, engineering redesigned replacement parts, and distributing them faster than original equipment suppliers. That engineering framework is vehicle- and drivetrain-agnostic. Applying it to Class 4 through Class 8 commercial trucks and powersports side-by-sides represented a logical operational extension rather than unfocused diversification. The analytical question is whether an engineering capability that transfers conceptually also transfers economically — and at what purchase price.
The heavy-duty pivot. On August 10, 2021, Dorman acquired DPL Holding Corporation — known as Dayton Parts — a manufacturer and distributor of heavy-duty truck components, for $344.9 million in cash net of $8.8 million in acquired cash. The purchase price allocation recorded $106.8 million in goodwill and $160.4 million in identifiable intangible assets.515
The strategic rationale addressed a distinct market dynamic. Commercial fleet operators face downtime costs that dwarf the price of individual replacement parts, making fleet buyers receptive to suppliers offering immediate availability and reliable engineering — mirroring the value proposition Dorman established in light-duty parts. Furthermore, the heavy-duty aftermarket remains highly fragmented. Chief Executive Officer Kevin Olsen has consistently described Dorman as "a very small player in a very large market" within commercial vehicles.16
The specialty vehicle bet. On October 4, 2022, Dorman acquired Super ATV, LLC for aggregate cash consideration of $509.8 million net of cash acquired, plus a potential earn-out of up to $100 million tied to SuperATV achieving specified revenue and gross margin targets in 2023 and 2024. The purchase price allocation recorded $247.5 million in goodwill and $157.5 million in identifiable intangibles — comprising an $82.5 million product portfolio, $48.4 million in trade names, and $26.6 million in customer relationships.5
SuperATV introduced a direct-to-consumer and direct-to-dealer distribution channel, selling discretionary performance upgrades directly to powersports enthusiasts: portal gear lifts, windshields, custom doors, and power steering kits. This channel offered higher gross margins and faster product development cycles in a category expanding faster than passenger car repair.
The acquisition also expanded Dorman's portfolio to include specialized enthusiast brands: Keller Performance Products for specialty-vehicle ball joints, Assault Industries for West Coast-styled accessories, Gboost for clutching products, and GDP for transmissions, portals, and differentials.1 Unlike routine maintenance components, enthusiast brand revenues fluctuate more dramatically with consumer confidence and discretionary spending.
Management's operational thesis posited that SuperATV's product development speed — highlighted by first-to-market releases like a vented windshield for CFMoto's Z10 sport platform and specialized portal gear lifts for the UForce U10 — would compound under Dorman's supply chain and capital.410
Historical falsification pass: is Dorman's M&A playbook disciplined?
Evaluating the claim that management consistently executes disciplined, high-return acquisitions reveals significant financial underperformance across both transactions, as documented in regulatory filings.
Dayton Parts: full goodwill impairment. Heavy Duty segment operating income reached $29.7 million on $258.2 million in sales during fiscal 2022, representing an 11.5% segment operating margin. Operating income dropped to $14.5 million in 2023, $6.5 million in 2024, and $5.1 million on $232.6 million in sales in 2025 — reducing segment operating margin to 2.2%.15 In the fourth quarter of 2025, performing a quantitative impairment test, management concluded that the carrying value of the Heavy Duty reporting unit exceeded its fair value and recorded a non-cash impairment of $56.7 million — eliminating the entire remaining goodwill balance of that unit — citing continued demand deterioration across the domestic heavy-duty trucking industry.1
This margin contraction stemmed largely from a prolonged downturn across the domestic freight sector. Management noted that an industry-wide freight recession persisted through the second quarter of 2026, with Olsen reporting that although freight rates began stabilizing as excess carrier capacity exited, overall trucking mileage and tonnage showed no meaningful growth in 2026.4 Excluding tariff refund timing benefits, Heavy Duty segment operating margin stood at 2.3% in the second quarter of 2026.4 Management maintains a long-term goal of achieving mid-teens segment operating margins, though executive communications acknowledge that ongoing commercialization investments create "an inherent hurdle on the margin front."104
SuperATV: zero earn-out payout. The SuperATV transaction provided an explicit contractual benchmark for performance. As of December 31, 2022, Dorman carried a $20.0 million fair-value liability for expected earn-out payments. During 2023, management recorded a $20.5 million reduction in that fair value after financial modeling indicated SuperATV would not achieve the revenue and gross margin targets established in the purchase agreement, leaving the accrual at zero.5
Because the $20.5 million fair-value reduction was recognized as a credit within selling, general, and administrative expenses, it temporarily elevated fiscal 2023 reported operating income despite reflecting an operational miss. Specialty Vehicle net sales totaled $210.4 million in 2023, $212.1 million in 2024, and $205.7 million in 2025, while segment operating income dropped from $31.6 million (a 15.0% margin) to $32.3 million in 2024 and $26.9 million (a 13.1% margin) in 2025.15 In the second quarter of 2026, segment sales fell about 1% to $54 million.4
Management attributes this slowdown to shifting consumer purchasing patterns. While overall powersports riding activity remains stable, original equipment manufacturers increasingly sell high-end models fully equipped from the factory, reducing post-purchase accessory demand, while entry-level machines from newer entrants like CFMoto and Segway ship decontented and attach well.4
Weighed conclusion. The disciplined-M&A claim is refuted in its strong form. Dorman deployed approximately $855 million in net cash across the Dayton Parts and SuperATV acquisitions. In fiscal 2025, the two combined segments generated $438.3 million in net sales and $32.0 million in segment operating profit — compared to the core Light Duty segment, which earned $347.3 million.1 One acquired business suffered a complete goodwill write-off, while the other failed to meet its contractual earn-out targets.
However, management exercised post-acquisition financial restraint: funding both deals without equity dilution, reducing net leverage back below 1.0 times within three years, maintaining share buybacks, and pausing major M&A from 2023 through 2025 to focus on organic growth.10
Key monitoring metrics going forward remain clear. For Specialty Vehicle: organic revenue growth turning positive and segment operating margin re-approaching management's high-teens target. For Heavy Duty: segment operating margin sustainably above low single digits driven by volume growth and commercialization of the emissions and aftertreatment portfolio.64 Finally, the allocation of capital from the $450 million in senior notes issued in mid-2026 will serve as the ultimate test of management's M&A discipline.
VI. Business Mechanics & Segment Economics (1:22:00 – 1:42:00)
Behind the narrative of product development, Dorman functions primarily as a working capital engine built around an engineering core. Evaluating how cash flows through the business separates investors assessing its fundamental mechanics from those relying on general fleet demographics.
Where the money is made. In fiscal 2025, the Light Duty segment generated $1.69 billion in net sales and $347.3 million in segment operating income — delivering a 20.5% operating margin, up from 18.2% in 2024. Management attributed the margin expansion to tariff price-before-cost timing benefits, favorable product mix from new product releases, operational productivity initiatives, and operating leverage on higher sales volume.1 Meanwhile, Heavy Duty and Specialty Vehicle collectively generate roughly one-fifth of net sales and less than one-tenth of segment operating profit.
The practical implication is clear: Dorman remains, economically, a light-duty automotive aftermarket enterprise with two speculative option positions attached. Any investment thesis relying on segment diversification to mitigate downside risk rests on acquisitions that have yet to demonstrate meaningful profit contribution.
The buyer problem. While Dorman does not disclose the names of its primary retail partners in public filings, its disclosed revenue concentration reveals significant customer dependency. In fiscal 2025 and 2024, two major retail customers each accounted for more than 10% of net sales, together representing 40% and 39% of total revenue, respectively; in 2023, three customers each surpassed the 10% threshold to combine for 44% of sales. All of these major accounts sit within the Light Duty segment.1 Furthermore, the company's four largest customers represented 78% of total accounts receivable as of December 31, 2025.1
Regulatory filings outline the operational consequences of this monopsonistic buyer structure. Management acknowledges that due to customer concentration and aggressive market competition, Dorman experiences ongoing pressure to "lower prices, extend payment terms, increase marketing and transportation allowances, provide enhanced rebates, discounts, rights of return and credits." Annual disclosures further highlight a structural threat: given the scale of these retail buyers, "their ability to forge direct relationships with our suppliers could cause those customers to reduce their purchases from us or to cease purchasing from us altogether."1
This operational vulnerability underscores Dorman's reliance on reverse engineering and catalog breadth. Because the company relies on third-party contract manufacturers — primarily located in Asia — its national retail customers possess the resources to bypass Dorman and source simple commodity parts directly from overseas factories. Consequently, Dorman's competitive defense depends on its proprietary engineering, fast-to-market teardowns, and comprehensive catalog depth rather than basic supply-chain exclusivity.
Extended terms, and the plumbing that makes them survivable. To accommodate the extended payment windows demanded by major auto retailers, Dorman sells substantial volumes of its customer accounts receivable to financial institutions through structured factoring programs. Under these agreements, retail buyers obtain extended payment terms, Dorman receives cash within days, and participating banks collect a financing discount tied to floating benchmark rates, specifically Term SOFR.
Financial disclosures illustrate the magnitude of this off-balance-sheet rate sensitivity: a one-percentage-point increase in discount rates would have increased Dorman's annual factoring expenses by approximately $11.3 million in 2025.1 By comparison, an equivalent one-percentage-point rate increase on the company's direct credit facility borrowings would have added roughly $4.6 million in interest expense.1 Consequently, Dorman carries more than double the interest-rate exposure through its customers' payment terms than through its own funded debt. While management characterizes the operating model as capital-light, financing extended retailer payment terms represents a persistent off-balance-sheet capital requirement.
Fiscal 2023 highlighted how this financial structure impacts operating margins: selling, general, and administrative expenses increased to 24.4% of net sales from 22.7% in 2022, driven primarily by higher benchmark interest rates on customer receivable factoring programs alongside the integration of SuperATV's higher operating expense profile.5 Benchmark rate hikes directly compress operating margins through elevated SG&A expenses rather than showing up below the line in net interest expense.
Inventory, fill rates, and the FIFO whipsaw. To support roughly 144,000 distinct part numbers and fulfill the order completion rates required by national retail chains, Dorman must maintain inventory across slow-moving replacement SKUs. A specialized component that fails on only a small fraction of vehicles still requires immediate availability when a vehicle enters a repair bay. In fiscal 2025, working capital investments in inventory absorbed $250.4 million in cash as the company accumulated inventory ahead of anticipated tariff adjustments, reducing operating cash flow to $113.6 million from $231.0 million in 2024 and lowering free cash flow to $75.7 million from roughly $191.6 million.1
Because Dorman applies first-in, first-out (FIFO) inventory accounting, input cost adjustments reach the income statement on a significant lag. Chief Executive Officer Kevin Olsen noted that input cost variations typically require "about 7 to 8 months" to cycle through inventory into cost of goods sold.16 This accounting mechanism explains the margin volatility recorded between 2024 and 2026. Tariff-driven price increases took effect before higher-cost inventory cleared, artificially expanding reported gross margins in 2025. When that higher-cost inventory subsequently flowed through in early 2026, first-quarter adjusted gross margin contracted by 490 basis points to 36.0%, adjusted operating margin declined to 12.1%, and adjusted EPS fell roughly 22% to $1.57 — matching management's explicit forward guidance.6
The productivity offset. Offsetting working capital friction, Dorman has pursued operational productivity initiatives across its logistics network. Management describes distribution center automation as a multi-year effort in its early stages, aimed at improving direct-labor productivity and order fulfillment metrics while leveraging a global supply chain organization to optimize landed component costs.16 Illustrating this operational leverage, Olsen highlighted that the company generated record new-product sales and expanded SKU introductions in fiscal 2025 "without adding that commensurate level of resources."16 These process efficiencies provide concrete backing for the structural 40% gross margin baseline guided by executive leadership.
Sourcing, and the tariff whiplash. International sourcing dynamics introduce additional financial complexity. In fiscal 2025, approximately 77% of Dorman's products were sourced from suppliers outside the United States — up from 72% in 2024 — with China representing the largest single country of origin.1 Management achieved its goal of reducing Chinese sourcing below 40% of total spend in 2025 and established a target of roughly 30% for 2026.10
Regulatory shifts disrupted this supply chain strategy in early 2026. On February 20, 2026, the U.S. Supreme Court invalidated certain tariffs imposed under the International Emergency Economic Powers Act, prompting federal administrative replacement actions including broad Section 122 duties.16 Subsequent tariff refunds received during the second quarter of 2026 added approximately $1.18 to reported adjusted diluted EPS of $3.08 and roughly $82 million to reported free cash flow of $144 million.4 Excluding these refund benefits, comparable adjusted EPS was $1.90 and comparable free cash flow was approximately $62 million.4
Management maintains a dollar-for-dollar tariff pass-through policy: absorbing initial duties, adjusting wholesale prices to reflect net cost changes, and implementing price reductions when tariffs decline. In line with this framework, Dorman initiated price cuts in the second quarter of 2026 and projected further reductions through the second half of the year.4 Because price adjustments are passed through on a fixed dollar basis rather than a constant percentage markup, absolute gross profit dollars remain intact while gross margin percentage moves inversely to prevailing tariff levels.10 Evaluating percentage margins without adjusting for pass-through mechanics obscures underlying profitability.
Myth versus reality
Myth: "Dorman is a diversified aftermarket platform across three segments." Reality: Dorman functions primarily as a light-duty supplier supported by two minor operating segments. Light Duty generated roughly 79% of fiscal 2025 net sales and approximately 92% of total segment operating income.1 Top-line diversification that fails to generate proportional operating earnings expands revenue channels without reducing earnings risk.
Myth: "Recurring, non-discretionary demand makes the results defensive." Reality: While underlying repair demand remains resilient, Dorman's reported quarterly financial results exhibit notable volatility. Consolidated net sales grew by only 1% in the fourth quarter of 2025 and roughly 1% in the second quarter of 2026, driven by retailer inventory adjustments and shipment timing rather than changes in consumer repair activity — even as point-of-sale sell-through at primary retail accounts expanded at a mid-single-digit rate.104 Disconnects between retail point-of-sale trends and supplier shipment volumes frequently persist across multiple quarters.
Myth: "Vehicle age is the driver of the stock." Reality: The average age of U.S. light vehicles increased incrementally from 12.8 to 12.9 years between October 2024 and October 2025 — a minor shift in total fleet demographics.1 Over that same timeframe, Dorman's gross margin fluctuated by 200 basis points while free cash flow contracted by more than 50%. While an aging vehicle fleet provides a long-term demand foundation for automotive replacement parts, annual earnings performance is primarily driven by tariff timing, product mix, release velocity, and inventory recalibrations across its four major retail customers.
What the mechanics mean. Dorman maintains robust underlying profitability within its core Light Duty segment. However, cash conversion remains subject to external factors outside management's direct control — specifically customer-mandated payment terms and shifting federal tariff policies — both of which register on financial statements with a two- to three-quarter accounting lag. Consequently, evaluating Dorman requires analyzing income statement profitability alongside cash flow conversion over multi-year cycles.
VII. The 7 Powers & Porter's 5 Forces Analysis (1:42:00 – 1:57:00)
Frameworks are only useful when they are scored against evidence rather than vibes. Here is the war-game, with the evidence attached.
Hamilton Helmer's 7 Powers
Scale Economies — moderate, not strong. The intuitive case is that fixed engineering and cataloging costs amortize across 144,000 part numbers, which no sub-scale rival can match. The evidence partly supports it: Dorman runs a 42.1% gross margin against roughly 30.2% at Standard Motor Products, on comparable revenue bases of $2.13 billion and $1.79 billion.111 But the largest competitors in Dorman's own stated set — Tenneco, Bosch, Gates, Continental, ACDelco and Motorcraft (owned by General Motors and Ford), Cummins after its Meritor acquisition, LKQ-owned WARN Industries — are in several cases far larger than Dorman, and the 10-K acknowledges they "may have greater financial, marketing, and other resources."1 Dorman's scale is category-specific, not absolute. It is decisive against a niche competitor in exhaust manifolds; it is irrelevant against Bosch.
Process Power — the strongest of the seven, and the least verifiable. Decades of accumulated failure-mode data, tooling for low-volume high-complexity parts, and an organization that can take a part from teardown to shelf faster than the market can respond. The affirmative evidence is the sustained margin premium and the pipeline commentary; management says the forward product funnel contains the highest proportion of complex electronics in company history and that complex electronics grows faster than the overall portfolio.106 The problem, noted earlier, is that Dorman declines to size it. A power you cannot measure is a power you must hold at the confidence its indirect evidence supports — which here is "probably real, definitely material, magnitude unknown."
Counter-Positioning — moderate and asymmetric. An automaker cannot flood the aftermarket with cheap versions of its own service parts without cannibalizing dealer service revenue, which is exactly the kind of business-model conflict Helmer describes. Dorman notes OEMs generally sell parts only for vehicles they produce.1 The asymmetry has a countervailing force worth pricing: on the heavy-duty side, Olsen has repeatedly flagged that OE dealers, facing weaker new and used vehicle sales, are leaning into their service centers to defend profitability — and are increasingly willing to stock aftermarket parts for margin.4 Dorman frames this as a channel opportunity, and in the near term it is. Over a longer horizon, a dealer network that has learned to buy aftermarket parts is a dealer network that has learned it does not need the OEM's price list, which cuts in unpredictable directions.
Cornered Resource — weak, and the company says so implicitly. Contract manufacturing capacity is available to anyone; Dorman's 10-K states plainly that numerous contract manufacturers exist. Engineering talent is hireable. The 132 patents do not corner anything at catalog scale.1
Switching Costs — weak at the buyer, moderate at the installer. A professional technician who has learned that Dorman's catalog fitment data is accurate and its parts install without surprises develops a genuine preference, and mis-ordering a part costs a shop a bay-day. But the entity that decides what sits on the shelf is a chain buyer running a line review, and roughly 24% of Dorman's own output already ships in someone else's box.1 Switching costs bind the wrong party.
Network Effects — none. There is no mechanism by which one more Dorman customer makes Dorman more valuable to the next. Any claim to the contrary is metaphor.
Brand — moderate, and narrower than it appears. "Dorman" carries real meaning to technicians and to the DIY customer standing in front of a HELP! rack; the 10-K leans on a brand "mechanics have trusted for more than 100 years."1 It carries almost none to the end consumer paying the repair bill, who never sees the box.
Porter's Five Forces
Bargaining power of buyers — very high, and the defining force in this business. Two customers at 40% of net sales, four at 78% of receivables, documented pressure for price concessions, extended terms, rebates, allowances and return rights, plus a credible threat of direct-sourcing around Dorman entirely.1 The fourth quarter of 2025 demonstrated the operational version: one customer changed its ordering pattern for its own internal reasons and Dorman missed its quarter.10 This is the force that makes the word "monopoly" in this story's title only half-true. Dorman may hold a near-monopoly on a specific part number. It holds nothing resembling one over the shelf.
Threat of new entrants — low. Replicating 144,000 part numbers, the fitment data behind them, the packaging and distribution infrastructure, and the retailer relationships is a decade-scale undertaking. Entry happens at the SKU level — a fast follower cloning a proven design — not at the platform level.
Bargaining power of suppliers — low. Fragmented global contract manufacturing, with Dorman actively re-weighting geography for tariff advantage. The real supplier risk is not price; it is that a supplier becomes a competitor by selling directly to Dorman's customers, which the 10-K names as a live risk.1
Threat of substitutes — moderate and rising at the channel level. Online sellers, marketplace listings, and low-cost import brands increasingly reach the same end user without a retail shelf. Dorman's counter is the part nobody else has yet.
Competitive rivalry — moderate. Standard Motor Products, Cardone, Tenneco, Automann, Mevotech, category specialists, and the OEM dealer networks. Notably, the rivalry is fought SKU by SKU rather than brand against brand, which is why launch cadence functions as the competitive weapon.
How Dorman compares to the peer set
The most useful single comparison is Standard Motor Products, the closest listed analogue and a company Dorman names first in its own competitive disclosure.1 SMP generated $1.79 billion of net sales in fiscal 2025 against Dorman's $2.13 billion — similar scale, similar channel, similar customer base — and earned a 30.2% gross margin against Dorman's 42.1%.111 SMP also carried heavier below-the-line damage, reporting $41.3 million of net income after a $37.7 million loss from discontinued operations, against Dorman's $204.2 million.111
Twelve points of gross margin between two companies selling into the same four buyers is the single strongest piece of affirmative evidence for the process-power thesis in this entire story. It is not explained by scale — the revenue bases are within 20% of each other. It is most plausibly explained by mix: what proportion of the catalog is a part somebody else also sells, versus a part only Dorman sells. That is the variable to track, and it is the variable Dorman declines to disclose.
The synthesis. Dorman's powers are real but concentrated in one place: the ability to be first with an engineered solution to a known failure. Everything downstream of that — pricing, shelf position, terms, cash conversion — is negotiated from a position of structural weakness against buyers who know exactly how weak it is. That is not a disqualifying combination; plenty of excellent businesses have run it for decades. But it means the correct mental model is not "toll road." It is "product company that must keep shipping."
VIII. Investment Story Spine: Bull vs. Bear Case & Risk Radar (1:57:00 – 2:12:00)
Why Dorman wins from here. The core investment thesis posits that Dorman occupies a defensible position in a highly resilient consumer spending category: maintaining older, out-of-warranty vehicles to keep them operable. Factual trends reinforce this setup. Point-of-sale revenues across Dorman's primary retail accounts expanded at a mid-single-digit rate for at least four consecutive quarters through mid-2026 — a trend management frequently cited while acknowledging that embedded price inflation contributed to that performance.4610 Meanwhile, the North American vehicle fleet continues to age into Dorman's target repair window, enabling the business to generate gross margins approximately twelve percentage points higher than its closest listed peer. Furthermore, the company has demonstrated an ability to pass through tariff-driven cost increases to customers and adjust prices downward when duties abate, without damaging wholesale distribution relationships.
Why it might not. Counterbalancing those strengths, Dorman negotiates every part placement and allowance with four dominant retail buyers, while its recent $855 million acquisition push proved that capital deployment outside its core light-duty segment carries substantial execution risk.
The bull case
Fleet aging provides a durable structural tailwind. U.S. vehicles in operation reached 302.7 million in 2025, with average vehicle age reaching 12.9 years and total miles driven rising 1.0% through October 2025.1 Elevated replacement vehicle prices and high auto-financing costs prompt car owners to maintain existing vehicles longer rather than trade them in — a dynamic Chief Executive Officer Kevin Olsen highlighted during the first-quarter 2026 earnings call.6 While fleet aging occurs gradually, it provides a predictable demand baseline for replacement components.
Complex electronics represent the highest-margin evolution of the OE FIX strategy. Modern vehicles rely on sophisticated digital control architectures. When a control module, sensor, or electronic driver unit fails, replacement options were historically limited to expensive original equipment dealer parts. Dorman leverages over fifteen years of data-logging, software calibration, and electronic design capabilities to engineer replacement solutions. Notable releases include a U.S.-assembled fuel pump driver module addressing thermal failures across Toyota and Lexus models, representing a target fleet exceeding 2.5 million vehicles.10 Olsen confirmed that complex electronic components command higher average selling prices and superior gross margins because Dorman competes directly against OEM dealer channels rather than aftermarket rivals.10 As vehicle electronics proliferate, this category expands Dorman's addressable market.
Tariff-driven price reductions could unlock volume gains beyond company guidance. Dorman began passing tariff savings back to retail customers during the second quarter of 2026, subsequently lowering its full-year sales growth guidance from 7–9% to 3–5% to reflect reduced price pass-through.4 Management emphasized that Dorman sets wholesale pricing rather than retail counter prices, noting that demand across most replacement categories remains price-inelastic.16 However, Olsen acknowledged that lower retail shelf prices could stimulate volume demand, particularly across discretionary product lines that faced purchasing headwinds.16 Potential volume upside from price reductions represents unguided upside in consensus models.
Heavy Duty functions as a cyclical option rather than a permanent drag. The commercial vehicle sector is subject to cyclical freight swings. Fleet aging in Class 4 through Class 8 trucks, growing OEM dealer adoption of aftermarket options, and catalog expansion into "above the frame" components create organic market-share growth opportunities independent of a broader freight recovery. Supporting this trajectory, Heavy Duty segment sales expanded roughly 7% year over year in the second quarter of 2026 despite stagnant overall freight tonnage.4
The bear case
Electrification presents long-term catalog risk. Battery-electric vehicles eliminate several core mechanical product lines, including exhaust manifolds, fuel pumps, EGR coolers, and conventional transmission components. Management counters that Dorman is drivetrain-agnostic and notes that hybrid vehicles carry higher addressable content due to dual-powertrain configurations.6 Given that battery-electric vehicles represent under 2% of the North American light-duty fleet, electrification poses minimal near-term risk to earnings.6 Instead, it represents a multi-decade catalog transition whose long-term financial impact remains difficult to quantify.
Retailer private-label expansion caps brand equity. Approximately 24% of Dorman's sales are packaged under customer private labels or distributed in bulk.1 Participating in store-brand programs secures shelf volume but limits proprietary brand recognition and shifts bargaining power toward retail buyers during line reviews.
Goodwill impairment risks persist in secondary segments. Following the Heavy Duty goodwill write-off, consolidated goodwill totaled $387.3 million at December 31, 2025, with $73.6 million allocated to Specialty Vehicle and $313.7 million to Light Duty.1 Specialty Vehicle has experienced three consecutive years of stagnant sales and margin pressure. Because goodwill valuation relies on projected cash flows, continued operational underperformance at SuperATV could trigger additional non-cash impairment charges under Step 1 accounting rules.
Post-tariff gross margin baselines remain to be verified. Executive leadership guided that gross margin will exit 2026 at approximately 40%, framing that level as a sustainable structural baseline for 2027.4 However, excluding non-recurring tariff refunds, second-quarter 2026 adjusted gross margin stood at 38.0%.4 Achieving management's 40% target requires sustained operational productivity and favorable product mix execution.
Material risk radar
Customer monopsony risk. With two major customers generating 40% of net sales, any account loss or contract renegotiation would significantly impair operating performance. Ordering adjustments during a fourth-quarter 2025 retail distribution consolidation demonstrated this operational sensitivity by contributing to a quarterly earnings miss.10
Supply chain and tariff volatility. With 77% of products manufactured internationally, shifting trade policies create operational friction. FIFO inventory accounting creates a multi-quarter lag between tariff changes and reported cost of goods sold, introducing margin volatility. While management projects that the tariff landscape has stabilized,4 prior policy assumptions proved optimistic — such as first-quarter 2026 guidance issued six days after the Supreme Court's IEEPA ruling that explicitly assumed duty levels would remain generally consistent with the prior regime.10
Interest rate and customer factoring sensitivity. Financial disclosures reveal that a one-percentage-point increase in benchmark interest rates increases customer accounts receivable factoring expenses by $11.3 million annually, alongside interest costs on $450 million in senior notes due 2034 carrying a 6.250% coupon — making Dorman's operating performance more rate-sensitive than its sub-1x net leverage suggests.114
M&A capital deployment execution. Management's capital allocation track record presents ongoing execution risk as the company maintains roughly $931 million in available liquidity amidst an active M&A market described by leadership as reopening.4 Given that the Dayton Parts acquisition resulted in a full goodwill write-off and SuperATV missed its contractual earn-out targets, future acquisitions require strict discipline.
Second-layer diligence notes
Operational details provide additional context for financial performance. Weather patterns influence quarterly demand: extreme heat or winter cold accelerates component failures, with management attributing strong chassis sales in early 2026 partly to heavy winter precipitation.16 Accounting estimates governing reserves for customer returns represent an important valuation variable, as returns depend on retailer inventory decisions rather than Dorman's direct control. Additionally, management updated its annual goodwill impairment testing date in 2025 from October to the first day of the fourth quarter, opting for full quantitative Step 1 evaluations in both 2024 and 2025 rather than a qualitative shortcut.1
The activist stress test
A critical investment evaluation highlights four key concerns: 1. Segment performance: The $855 million invested in Dayton Parts and SuperATV generated 21% of net sales and 8% of operating profit in 2025, failing to deliver meaningful diversification. 2. Executive compensation alignment: Annual cash incentives yielded a 142% bonus payout in 2025 despite free cash flow conversion falling to 37% of net income, while long-term ROIC targets have yet to fully reflect the capital drag of recent acquisitions. 3. Governance structure: Combining the Chairman and Chief Executive Officer positions in April 2026 reduced independent board oversight following the founding family's departure, leaving a lead independent director as the sole structural counterweight.12 4. Disclosure transparency: Management does not disclose detailed sales concentration or financial metrics for its complex electronics portfolio, leaving core competitive claims unquantified in public filings.
Conversely, management's capital allocation demonstrates disciplined execution in several areas: acquisitions were completed without equity dilution, net leverage was reduced below 1.0 times within three years, share buybacks accelerated during share price weakness, and financial reporting transparently detailed non-recurring tariff impacts. These balanced factors indicate that capital allocation practices are undergoing active refinement under market scrutiny rather than destroying shareholder value.
IX. Playbook & Key Investing Lessons (2:12:00 – 2:20:00)
1. High margins can come from irreplaceability rather than volume. Dorman's economics are not driven by high unit volumes of any single item. Instead, they stem from being the sole supplier of a specific replacement part a vehicle requires on a given day, priced below original dealer rates. This dynamic generalizes poorly to consumer markets but holds strong relevance in industrial distribution: identify where a buyer faces no immediate substitute at the moment of repair, and evaluate whether the supplier is structured to capture that demand.
2. Fixing the defect beats copying it. The distinction between an OE FIX redesign and a commodity clone explains the margin gap between Dorman and basic importers. A clone competes on price against identical parts. A redesign that resolves an underlying failure mode competes against the failure itself. However, the historical record enforces a crucial corollary: this competitive edge is an operational flow sustained by continuous new product releases, not a static asset protected by patents. Tracking introduction cadence is far more informative than counting patents.
3. Beware buying discretionary and cyclical adjacencies at cycle peaks — and beware the arguments that make it feel prudent. Both of Dorman's major acquisitions carried sound strategic logic, yet both were completed within roughly a year of cycle peaks in their respective end markets. Strategic rationale and purchase price are independent variables, and financial markets ultimately grade purchase price. The SuperATV earn-out adjustment underscores this lesson: when an acquirer establishes contract performance targets and reverses the liability accrual within fifteen months, that adjustment provides a clear signal of underlying operational performance.
4. Accounting gross margin is not cash. Dorman posted a record gross margin and triggered a 200% executive bonus payout on adjusted pre-tax income in the same year free cash flow conversion fell to 37% of net income, as major retail buyers required extended payment terms and tariff dynamics drove inventory build-ups.131 In any business where dominant buyers set payment terms, the cash flow statement serves as the primary gauge of performance while the income statement provides supporting commentary.
X. Epilogue & What to Watch (2:20:00 – 2:25:00)
The most revealing observation from Dorman's leadership in 2026 focused not on tariffs or operating margins, but on pricing power. Explaining what happens to the price reductions Dorman passes back to retail partners, Chief Executive Officer Kevin Olsen noted on the second-quarter earnings call: "we don't control that, right? We set pricing to our customers who then control end user pricing."16
That single statement summarizes the structural tension of the business. Dorman controls its engineering teardowns, catalog depth, product launch velocity, and supply chain diversification. However, it does not control retail shelf allocation, counter prices, customer payment terms, or a retail chain's decision to consolidate distribution centers. Strategic strength in product development is counterbalanced by structural reliance on major retail distributors — and long-term shareholder returns depend on whether operational engineering continues to outrun channel concentration.
Dorman's trajectory beyond 2026 rests on three verifiable operational factors: whether its product development pipeline continues generating proprietary replacement parts, whether gross margins align with long-term targets once tariff timing distortions abate, and whether earnings fully convert into free cash flow.
Management has outlined explicit financial targets through 2027. For the second half of 2026, leadership projects mid-single-digit sales growth driven primarily by volume from secured business wins and new product releases, alongside a full-year adjusted operating margin between 15.5% and 16.5%. Gross margin is expected to exit 2026 near 40%, with second-half adjusted diluted earnings per share targeted at $3.85 to $4.15, compared with $3.54 in the prior-year period. Chief Financial Officer Charles Rayfield framed these projections around an expectation that these rates "serve as a structural base to grow from in 2027."4 Each metric provides a measurable benchmark for assessing execution.
The three KPIs that matter most:
1. New-to-the-aftermarket part introductions. The critical metric is not total catalog SKU count or overall releases, but the first-to-market subset specifically. Disclosed annually in regulatory filings, these proprietary releases have contracted for three consecutive years: 1,791 in 2023, 1,659 in 2024, and 1,608 in 2025.1 This introduction velocity sustains Dorman's gross margin premium over commodity aftermarket peers. Stabilizing and expanding this pipeline would support the company's process-power advantage, whereas a continued decline would erode pricing leverage over time.
2. Gross margin against management's ~40% exit-rate commitment. Executive leadership publicly established a 40% exit rate target and framed it as a structural baseline.4 Because Dorman passes tariff changes through on a fixed dollar basis, gross margin percentages move inversely with duty levels. Evaluating sustainable profitability requires tracking absolute gross profit dollars alongside percentage margins, comparing both against the 42.1% reported in 2025 and the 38.0% comparable rate in the second quarter of 2026.14
3. Free cash flow conversion relative to net income. Dorman's executive bonus structure sets a 70% threshold and an 85% target for free cash flow conversion, but yielded a zero payout for 2025 when conversion dropped to 37%.13 This metric reflects the combined impact of retailer payment terms, tariff timing, and working capital management on actual cash generation. Executive leadership guided toward a recovery back near the $190 million free cash flow level reported in 2024.10 Achieving that conversion target will provide the primary test of whether recent accounting profitability reflects underlying cash generation.
References
-
Dorman Products, Inc. Annual Report on Form 10-K for the fiscal year ended December 31, 2025 — U.S. Securities and Exchange Commission, 2026-02-27 ↩↩↩↩↩↩↩↩↩↩↩↩↩↩↩↩↩↩↩↩↩↩↩↩↩↩↩↩↩↩↩↩↩↩↩↩↩↩↩↩↩↩↩↩↩↩↩↩↩↩↩↩↩↩↩↩↩↩↩
-
Dorman Products Market Data & Key Financial Ratios — The Wall Street Journal ↩
-
Dorman Products, Inc. Current Report on Form 8-K, Second Quarter 2026 Results — U.S. Securities and Exchange Commission, 2026-08-03 ↩↩↩↩↩↩↩↩↩↩↩↩↩↩↩↩↩↩↩↩↩↩↩↩↩↩↩↩↩↩↩
-
Dorman Products, Inc. Annual Report on Form 10-K for the fiscal year ended December 31, 2023 — U.S. Securities and Exchange Commission, 2024-02-28 ↩↩↩↩↩↩↩
-
Dorman Products, Inc. Quarterly Report on Form 10-Q for the quarter ended March 28, 2026 — U.S. Securities and Exchange Commission, 2026-05-04 ↩↩↩↩↩↩↩↩↩↩↩↩↩↩↩↩↩
-
R&B's Name Change to Dorman Products is Now Official; Company Elects Board — AftermarketNews, 2006-05-26 ↩↩
-
R&B, Inc. Annual Report on Form 10-K for the fiscal year ended December 1996 — U.S. Securities and Exchange Commission, 1997-03-27 ↩↩↩↩
-
R&B, Inc. Annual Report on Form 10-K for the fiscal year ended December 28, 2002 — U.S. Securities and Exchange Commission, 2003-03-19 ↩↩↩↩↩
-
Dorman Products, Inc. Current Report on Form 8-K, Fourth Quarter and Full Year 2025 Results — U.S. Securities and Exchange Commission, 2026-02-25 ↩↩↩↩↩↩↩↩↩↩↩↩↩↩↩↩↩↩↩↩
-
Standard Motor Products, Inc. Annual Report on Form 10-K for the fiscal year ended December 31, 2025 — U.S. Securities and Exchange Commission, 2026-02-26 ↩↩↩↩
-
Dorman Products, Inc. Names Kevin Olsen Chairman of The Board — Dorman Products Investor Relations, 2026-04-02 ↩↩
-
Dorman Products, Inc. Definitive Proxy Statement on Schedule 14A — U.S. Securities and Exchange Commission, 2026-04-06 ↩↩↩↩↩↩↩↩
-
Dorman Products, Inc. Current Report on Form 8-K, Senior Notes Offering — U.S. Securities and Exchange Commission, 2026-06-03 ↩↩
-
Dorman Products Completes Acquisition of Dayton Parts — Business Wire, 2021 ↩
-
Dorman Products Quarterly Results & Earnings Transcripts — Dorman Products Investor Relations ↩↩↩↩↩↩↩↩↩↩↩
 LinkedIn
 WhatsApp
 Reddit
 Hacker News
 Email
Email Kindle
 RSS Feed
 Spotify
 Apple Podcasts
 Amazon Music
 Audible
 YouTube