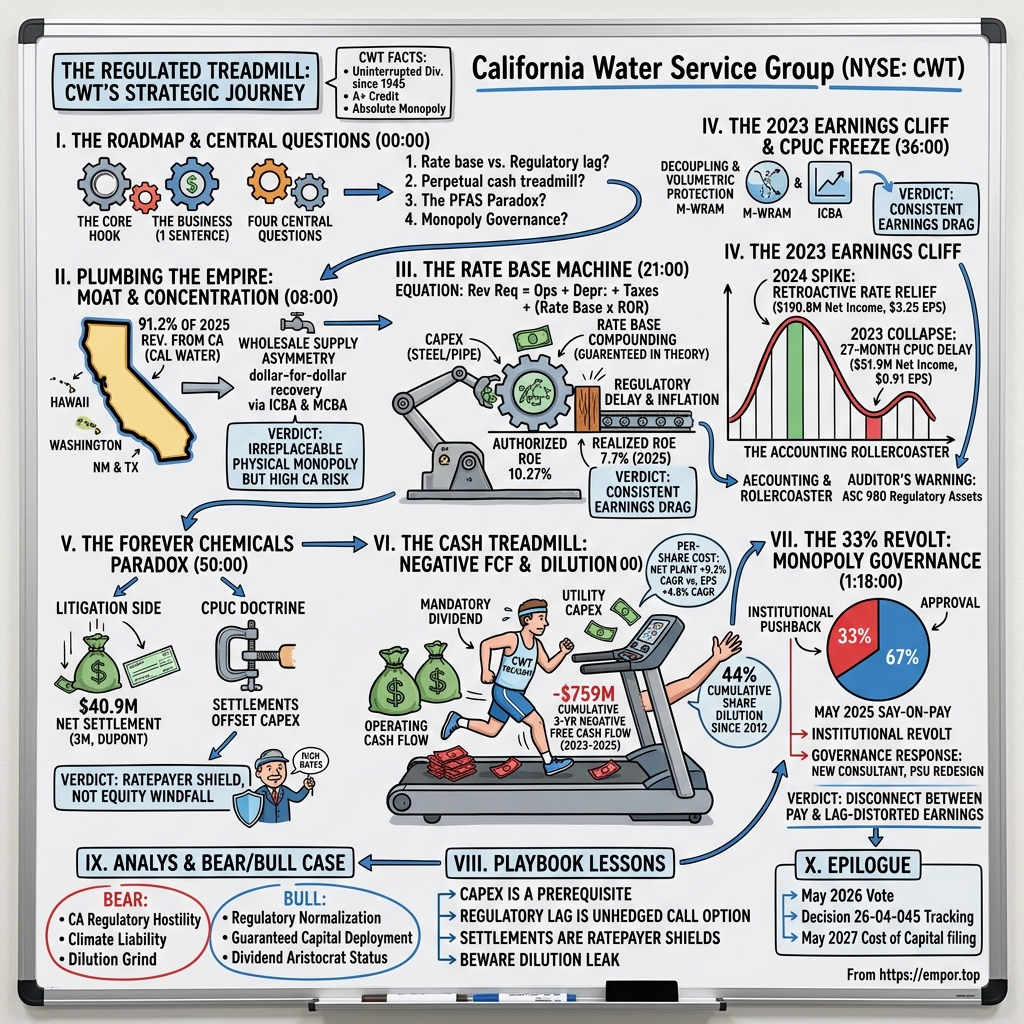
California Water Service Group: The Regulated Treadmill
I. Introduction & Episode Roadmap (00:00 – 08:00)
Picture a quarterly dividend check. It has gone out every quarter for 79 straight years, and for 57 straight years the amount has gone up1. The company that writes it holds one of the strongest credit ratings in American utilities, an A+ from S&P with a stable outlook9. It owns the pipes under parts of Silicon Valley, Bakersfield and Maui, and the customers on the other end have no other supplier and never will. It sells the one product no household can stop buying.
Now look at the cash. Between 2023 and 2025, California Water Service Group spent about $759 million more than it brought in, once its pipe-laying and its dividend are counted1. Its share count has grown about 44% since 201252. At its May 2025 annual meeting, a third of the votes cast went against the executives' pay package, a striking rebuke at a company where pay votes usually pass with little notice37.
Both pictures are accurate, and this story is about how they fit together.
The business in one sentence
California Water Service Group (NYSE: CWT) is a holding company worth roughly $2.85 billion on the market that turns regulated infrastructure spending into authorized accounting profit. It depends on steady access to the debt and equity markets to cover the gap between what it spends in the ground and what it collects from customers1.
That last part is the key to the whole business. A water utility does not grow the way a software company or a retailer does. It grows when a regulator lets it put more steel, concrete and treatment equipment into its "rate base", the pool of invested capital on which customers pay a return. More pipe means more profit. But the pipe gets bought today and the return comes back slowly over decades, so the utility is always raising money. The essential product and the cash shortfall are two sides of the same model.
Four questions
The story follows four questions:
- Rate base compounding vs. regulatory lag. CWT's net plant has compounded at roughly 9% a year for more than a decade51. Does that growth reach shareholders, or does the slow pace of the California Public Utilities Commission (CPUC) keep realized returns permanently below what the regulator authorizes?
- The cash treadmill. Can a company that runs about $200–250 million a year in the red after capex and dividends keep compounding per share, or does dilution flatten it?
- The PFAS paradox. The federal and state crackdown on "forever chemicals" demands huge filtration spending. Does that become a new growth engine, or do settlement checks from 3M and DuPont shrink the shareholder's slice?
- Monopoly governance. Why did a quiet water utility's Say-on-Pay vote fall to 67%, and does executive pay reward good stewardship or the timing of retroactive accounting?
The route runs from a 1926 water company in the Santa Clara Valley to the hearing rooms of the CPUC, then through the bookkeeping of regulatory balancing accounts, the chemistry of PFAS filtration and the long arithmetic of utility compounding. It starts underground.
 Subscribe on LinkedIn
II. The Plumbing of an Empire: From San Jose Orchards to Five-State Grid (08:00 – 21:00)
Before it was Silicon Valley, the Santa Clara Valley was known as the "Valley of Heart's Delight": apricot, prune and cherry orchards running to the foothills. Water there was a farmer's and a town builder's problem, handled one well and one local system at a time. In 1926 California Water Service Company was incorporated and took over a set of those scattered systems10. The plan was plain consolidation: buy the local waterworks, connect them, run them under one owner and recover the cost through regulated rates.
What makes that old pipe important today is economics. Nobody will ever dig a second set of mains under a street that already has one. The first owner wins, permanently. That is the closest thing in business to a natural monopoly.
The modern footprint
A century later, the group serves about 562,000 customer connections across five states1. The headline number hides how lopsided the map is.
California Water Service Company (Cal Water) is almost the whole business. It has about 500,000 connections, 89% of the total, and earned $912 million, 91% of 2025 operating revenue1. It serves dozens of districts, from the Peninsula and San Jose-area communities to Bakersfield, Visalia, Stockton and parts of the Los Angeles basin.
Hawaii Water Service is small but unusual. It has about 6,800 connections, roughly 1% of the total, and produces about 4.6% of revenue1. Its customers include resort developments and communities on Maui, Oahu and the Big Island, and its revenue per connection is far above the mainland average because much of that service is high-cost, often including wastewater.
Washington Water Service has about 38,500 connections in the Puget Sound area, 6.8% of the total, but only 2.6% of revenue1. Those are mostly small, low-revenue rural systems.
New Mexico and Texas together have about 16,700 connections and 1.6% of revenue1. These are footholds in fast-growing Sun Belt markets. The company also has pending tuck-in acquisitions in Nevada and Oregon, systems from Nexus Water Group1.
The conclusion is simple. CWT calls itself a five-state utility, but economically it is a California utility with four small side businesses. Its national peers spread regulatory risk across many state commissions. CWT's fortunes largely depend on a single regulator in San Francisco, and that fact runs through the rest of this story.
Where the water comes from
On the customer side there is no concentration at all. No customer accounts for even 10% of revenue across more than half a million accounts1. The supply side is different. In many districts Cal Water does not pump all its own water. It buys it wholesale from large regional agencies such as Valley Water in Santa Clara County, the Metropolitan Water District of Southern California, and the San Francisco Public Utilities Commission's Hetch Hetchy system1.
Those contracts are mostly take-or-pay: the company pays whether it uses the water or not. Long-term commitments total about $797 million, starting at roughly $33 million in 2026, rising to about $44 million a year by 2028, and running well past 20301. Total purchased water cost about $253 million in 2025, up from about $224 million in 20231.
For an unregulated business, a quarter-billion-dollar input cost set by a handful of government monopolies would be a serious margin risk. For Cal Water it is mostly a pass-through. CPUC balancing accounts track the difference between the water cost built into rates and the actual cost, and the company recovers or refunds the gap1. Customers bear the supplier price risk, not shareholders.
The geographic monopoly is real and close to impossible to attack. Its weakness is concentration: one state, one commission and one climate. Drought, wildfire and earthquake risk all fall on the same map. The moat stops competitors, but it does not protect against the regulator, and the next section explains how that regulator turns a pipe into profit.
III. The Rate Base Machine: How Capital Becomes Authorized Cash (21:00 – 36:00)
Picture a CPUC hearing room in San Francisco. An administrative law judge presides. Lawyers for Cal Water sit at one table, and at the other sits the Public Advocates Office, the state's in-house ratepayer advocate. The argument is about pipe: whether a stretch of aging main in Bakersfield needs replacing now, what it should cost, and whether the investment is "used and useful". Small technical arguments like this, repeated across thousands of line items, decide what Cal Water can charge for the next three years.
The basic equation
Every regulated utility runs on one formula:
Revenue requirement = operating expenses + depreciation + taxes + (rate base × authorized rate of return).
The first three terms are pass-throughs: the utility recovers what it spends and earns nothing extra on them. All of the profit sits in the last term. The utility earns a return only on capital it has invested and the regulator has accepted.
That explains a surprising line in CWT's financials: research and development spending of zero1. A water utility doesn't need R&D because capital spending is its product. Every dollar that goes into the ground and wins regulatory approval adds to the base that earns a return. Cal Water's net utility plant reached about $4.58 billion at the end of 20251, roughly triple its 2012 level5.
The cost-of-capital lock
The CPUC sets Cal Water's return in a separate cost-of-capital proceeding. The current terms are:
- An authorized return on equity of 10.27%
- An authorized capital structure of 53.4% equity, 46.6% debt
- An overall authorized rate of return of 7.46%1
The CPUC has extended this cost-of-capital cycle several times, and Cal Water's next filing is now due May 1, 20271. That timing matters. From 2022 to 2024 interest rates rose faster than at any point in a generation. The utility's new debt cost more, but its authorized equity return could not be reset. In a rising-rate world, a frozen allowed return is slowly worth less in real terms.
A falsification test applies here. Bulls often describe a 10.27% authorized ROE as a guarantee. It isn't. It is a ceiling the company can reach only if its costs and sales match the regulator's forecasts exactly. In 2025, a normal year without retroactive catch-up, CWT earned about $128 million on roughly $1.69 billion of stockholders' equity1, a realized ROE of about 7.6%. The gap between authorized and earned returns was about 260 basis points. The history supports a narrower claim: the authorized ROE sets the direction of earnings, not their level.
Decoupling: why drought doesn't wipe out margins
Then why hasn't drought wrecked this business? California has repeatedly asked customers to cut water use, sometimes by a quarter or more. For a company that sells water by volume, that should be a disaster.
The answer is decoupling. Since 2008, Cal Water has used a Monterey-style Water Revenue Adjustment Mechanism (M-WRAM), along with Incremental Cost Balancing Accounts (ICBA)1. Together they work like a running ledger with customers. If people use less water than the rate case assumed, the shortfall in revenue is recorded as a receivable and collected later through surcharges. If they use more, the excess is refunded. Revenue is set by the rate case, not by the weather.
This solves the "conservation paradox": a utility that earns more by selling more water has every reason to resist conservation. Decoupling removes that incentive.
The CPUC's April 30, 2026 decision on the 2024 California rate case, Decision 26-04-045, went further. It kept M-WRAM, moved more fixed-cost recovery into the monthly meter charge, and created an annual Sales Reconciliation Mechanism to reduce the risk of bad consumption forecasts2. In plain terms, more of each bill is now a fixed subscription and less is a volumetric gamble.
None of this solves the core problem. Decoupling protects volume. It does not protect time. A balancing account can correct for how much water customers used, but it can't make the CPUC decide faster, and timing is where the business was hurt most badly.
IV. The CPUC Freeze and the 2023 Earnings Cliff (36:00 – 50:00)
In February 2024, CEO Martin Kropelnicki reported Cal Water's 2023 results. Net income was about $52 million, down 46% from the year before, and diluted EPS was $0.911. The water had kept flowing and customers had kept paying. The problem was that a rate case scheduled to take effect on January 1, 2022 still had no final decision.
What regulatory lag looks like
California's water utilities run on a three-year cycle. A company files its general rate case well before the first test year, and in principle the CPUC rules before that year begins. Cal Water filed its 2021 GRC for rates starting January 1, 2022. The final decision, D.24-03-004, came in March 2024[^7]6, more than two years after the new rates were supposed to start.
Those two years were the worst stretch of inflation in forty years. Wages, power and treatment chemicals all got more expensive while Cal Water billed at old rates on interim terms. The accounting rules (ASC 980) do not let a utility book revenue it has not been granted, so the income statement absorbed every cost increase while the matching revenue waited.
Four years of swings
The reported results look erratic until the cause is clear:
- 2022: Revenue about $846 million, net income about $96 million, EPS $1.774. Interim rates covered part of the gap.
- 2023: Revenue fell to about $795 million and net income roughly halved to $52 million1. Realized ROE dropped into the mid-single digits.
- 2024: Revenue jumped above $1 billion and net income reached about $191 million, or $3.25 a share1. When the decision arrived, it applied back to January 1, 2022, and most of two years of delayed revenue landed in a single year.
- 2025: Revenue about $1.0 billion and net income about $128 million, $2.15 a share1, a more normal year.
Read in isolation, any one of those years misleads. 2023 was not a collapse and 2024 was not a breakout. Averaged over the full span, the result is steadier: from 2012 to 2025 net income grew about 7.7% a year51. The compounding is real, but it arrives in lumps.
The pattern has repeated. D.26-04-045 on the 2024 GRC also came well into the cycle, in April 2026, and it authorized about $90.5 million of retroactive revenue recovery for 20262. That helps explain why the first half of 2026 looked strong: revenue of about $523 million, up 11.6%, and net income of about $60.5 million, up 9%, with EPS of $1.01 versus $0.932. Part of that is genuine rate-base growth. Part is the same retroactive catch-up that inflated 2024. Investors should expect the comparison to look different in 2027.
The auditor's warning
Deloitte & Touche gave CWT a clean opinion for 2025 and flagged a single Critical Audit Matter: regulatory assets and liabilities under utility accounting1. That one item touches a lot of the balance sheet. Regulatory assets were about $340 million at year-end 2025, and regulatory liabilities about $930 million1.
A regulatory asset is essentially management's judgment that the CPUC will probably let the company recover a cost later. If the commission disagrees, the asset is written off against equity. Deloitte does not suggest the judgments are wrong, but it notes that a large share of the balance sheet rests on predictions about a regulator's decisions.
The result is clear. Rate-base compounding at CWT is real over a decade and unreliable over any single year. The regulator decides not only how much the utility earns but also when, and that timing problem sets up the next one: a new mandate that requires heavy spending.
V. The Forever Chemicals Paradox: $41 Million from 3M and DuPont (50:00 – 1:04:00)
In April 2024, the U.S. Environmental Protection Agency finalized the first national drinking-water limits for PFAS. The limit for PFOA and PFOS was 4 parts per trillion each8, roughly a few drops in a body of water the size of thousands of swimming pools. For utilities that draw from groundwater wells, the rule meant years of construction. Around the same time, settlement money from the chemical makers began reaching the utilities.
What PFAS treatment involves
PFAS, per- and polyfluoroalkyl substances, are called "forever chemicals" because the carbon-fluorine bond in them is among the strongest in chemistry. They don't break down in soil or in people. They came from firefighting foam, nonstick coatings and stain repellents, and they seeped into aquifers across the country.
Removing them is a filtration job. A utility usually installs one of three systems at the wellhead:
- Granular activated carbon (GAC): large vessels of carbon with a huge surface area that trap PFAS molecules, like a very large Brita filter.
- Ion-exchange resin: charged beads that pull the negatively charged PFAS molecules out of the water.
- Reverse osmosis: forcing water through membranes fine enough to block nearly everything. It works well but is costly and leaves a concentrated waste stream.
Every option means steel vessels, buildings, piping and media that must be replaced on a schedule, repeated across many affected wells. For a utility whose profit comes from capital investment, this looks like a large new opportunity.
The settlements
Cal Water joined the national class-action settlements that public water systems negotiated with 3M, DuPont (with Chemours and Corteva), Tyco Fire Products and BASF1. In 2025 it collected about $34.8 million from 3M, covering the first two of ten annual installments that run to 2035, plus about $6.1 million net from DuPont, for roughly $41 million in total1. Payments from Tyco and BASF began in the first half of 20261.
Ratepayers or shareholders?
For an ordinary company, $41 million of litigation proceeds is a gain on the income statement. For a CPUC-regulated utility, it is not. The principle is ratepayer indifference: customers paid for the contaminated water system, so customers get the recovery. Cal Water records the proceeds as a regulatory liability, about $25 million at year-end 20251, and the CPUC requires the money to offset the capital cost of PFAS treatment1.
The arithmetic for shareholders follows. Suppose a treatment plant costs $10 million and $4 million of it is paid with settlement money. Only about $6 million enters the rate base and earns the authorized return. The polluter's money builds the filters but lowers the amount on which equity earns.
That tests a popular thesis. Many investors assumed PFAS would drive explosive rate-base growth for water utilities. For CWT the claim needs narrowing. PFAS spending will add to the rate base—part of the CPUC-approved $1.45 billion capital program for 2024–2027 is aimed at water quality2—but settlement offsets reduce the net addition. What shareholders really gain is less risk. Customers face smaller bill increases, the CPUC faces less political pressure, and the company has less chance of being stuck with costs it cannot recover. That is a credit benefit more than an equity one.
The number to watch is the net rate-base additions for PFAS projects in Cal Water's coming advice-letter filings, after all 3M, DuPont, Tyco and BASF proceeds are deducted. The company does not publish a single combined PFAS capital total, so investors have to put it together filing by filing.
Settlements cover some of the bill but not most of it. The rest of the money has to come from somewhere, and that is the next topic.
VI. The Cash Treadmill: Negative Free Cash Flow and 44% Dilution (1:04:00 – 1:18:00)
Think of the treasury desk at the San Jose headquarters. Every year it faces the same problem. About $517 million of capital work is planned1: main replacements, wellhead treatment, storage tanks. Operations bring in about $300 million of cash1. The dividend, a 57-year promise, takes another $74 million1. The gap is close to $300 million, and it has to be borrowed or raised from shareholders.
The three-year cash picture
Start from reported earnings and follow the cash for 2023 through 2025.
Net income totaled about $369 million1.
Operating cash flow was much higher, about $811 million1. Most of the difference is depreciation, about $404 million over three years. That expense is a real economic cost, but no cash leaves the building in the year it is recorded. Deferred taxes added about $114 million1. In 2024 the state's Water Arrearages Payment Program paid off pandemic-era customer debt, a one-time net inflow of about $58 million1.
Capital spending absorbed about $1.37 billion, roughly half of revenue every year1.
Dividends took about $198 million1.
The result: about $759 million short over three years.
The financing came from:
- About $493 million of net new long-term debt1
- About $208 million of new common stock, mostly through at-the-market (ATM) programs, which is the company selling shares into the market a little at a time1
- About $89 million of developer advances and contributions in aid of construction1
- About $41 million of PFAS settlement money1
The equity raising came early. About $115 million in 2023 and $89 million in 2024, then only about $4 million in 2025 once the retroactive rate cash arrived1. In May 2025 the company put in place a new three-year ATM program for up to $350 million1. Its usage over the next few years is the most direct measure of how much dilution the capital plan will require.
The cost per share
The plant base grew about 9.2% a year from 2012 to 202551. Net income grew about 7.7% a year. Diluted EPS grew only about 4.8% a year, from $1.17 to $2.1551.
The reason is the share count. It rose from about 41.9 million in 2012 to about 60.4 million by June 202652. Roughly 40% of the growth in earnings went to new shares rather than existing ones. That is not a sign of mismanagement. A utility that keeps its regulated capital structure near 53% equity has to issue equity as it grows. But anyone buying CWT for plant growth should measure returns per share, not in aggregate.
CWT also does not buy back stock. Its only repurchases are shares withheld for employee taxes when equity awards vest, about $1.4 million in 20251.
The balance sheet
On credit, the picture is strong. S&P rates the issuer A+ stable, with Cal Water's first mortgage bonds at AA-91. Total borrowings were about $1.6 billion at the end of 2025: about $1.3 billion of first mortgage bonds secured on utility property, $170 million of holding-company senior notes, and $130 million drawn on $600 million of revolving credit lines1. The bonds carry fixed coupons and mature as late as 2061. Only about $2.3 million matures in 20261.
The covenants are far from binding. Debt-to-capitalization is about 49% against a 66.7% limit, and interest coverage is above 5x against a 3x minimum1.
The cash model works and isn't fragile: creditors are well protected and the dividend is not at risk. The question is how much compounding reaches each share, and that leads to how the people running the business are paid.
VII. The 33% Revolt: Executive Pay in a Regulated Monopoly (1:18:00 – 1:30:00)
At most water utilities the annual meeting is uneventful. Directors are re-elected, auditors ratified, and the advisory Say-on-Pay vote passes with over 90%. Cal Water fit that pattern: 92% approval in 2022, 96% in 2023 and 96% in 20243. At the May 2025 meeting, support fell to 67%37.
The leadership
Martin Kropelnicki joined the company in 2006 as chief financial officer and became CEO on September 1, 201313. He has led CWT through two droughts, the pandemic, the 2021 GRC delay and the expansion into Texas and New Mexico, and he is now chairman as well. His approach is that of a finance executive: careful about capital structure, attentive to rate cases, and willing to use the equity markets. He owns about 178,000 shares3, under 0.3% of the company.
The board is mostly independent. Ten of eleven director nominees are independent, and Kropelnicki is the only insider3. The company reports no related-party transactions since the start of 2025, and there are no management fees or affiliate guarantees31. This is a clean governance setup. The 2025 dispute was about pay design, not self-dealing.
What he was paid
- 2023: Total compensation about $4.86 million, including a $1.45 million cash incentive, in the year net income fell 46%3.
- 2024: About $4.80 million, with a $1.87 million cash incentive as the retroactive rates arrived3.
- 2025: About $6.88 million, with roughly $1.08 million of salary, $1.95 million of stock awards, a $1.52 million cash incentive, and about $2.25 million from an actuarial increase in pension value3.
The 2025 jump is less than it appears. Excluding the pension figure, which moves with discount rates and service years rather than board decisions, pay was about $4.6 million, roughly flat. Still, the headline went up about 43% in a year when net income fell about a third31.
What investors objected to
The incentive design didn't adjust well for regulatory timing. In 2023, a large cash bonus was paid while reported earnings had halved, because the company argued that operations had done well despite the delay. In 2024, incentives rose as the retroactive decision inflated earnings. Either explanation can be defended on its own. Together they look like management was rewarded in both directions.
Ownership explains why the vote fell so far. BlackRock owns about 17%, Vanguard about 12%, State Street about 6% and T. Rowe Price about 5%, roughly 40% between them, while all directors and officers together hold under 1%3. A few stewardship teams can move the result by themselves.
The board responded quickly. The compensation committee contacted holders of about 38% of the stock and replaced its pay consultant with Korn Ferry to review long-term incentive metrics3.
So how good is governance here? It responds when pushed: it heard the objection and changed advisers. It has not yet shown that pay tracks shareholder outcomes better than reported earnings. The test is whether future incentive metrics adjust for the timing of regulatory decisions. Until then, the 2025 vote is the clearest outside signal on how management is held to account.
VIII. Playbook: Business & Investing Lessons (1:30:00 – 1:44:00)
Lesson 1: In a regulated utility, accounting profit is an annuity, and capital spending is the price of entry.
Over three years Cal Water put about $1.37 billion into the ground and produced no free cash at all. That was not failure. It was the model working as designed. The profit is a return on capital already committed, and the next return requires committing more. For founders in regulated or infrastructure businesses, the lesson is that growth funded by capital is limited by access to capital as much as by demand.
"A water utility investor isn't paid out of free cash flow. They are paid because the regulator allows the company to finance an ever-larger mountain of steel in the ground."
Lesson 2: Regulatory lag is a free option held by the state.
A rate case meant for January 2022 was decided in March 2024. The delay cut 2023 earnings roughly in half and then pushed 2024 earnings to a record. Shareholders got their money back eventually but absorbed two years of inflation without interest-like compensation for the wait. Anyone in business whose prices are set by a public body owns some of this risk.
"When inflation runs hot, a triennial rate case quietly moves returns from shareholders to customers."
Lesson 3: Litigation settlements protect ratepayers, not shareholders.
Cal Water received about $41 million from 3M and DuPont and booked it as a liability owed to customers, not as income.
"In regulated land, when polluters pay, customers get the discount and the utility gets a smaller rate base."
Lesson 4: Dilution leaks out of rate-base compounding.
Over 13 years net plant roughly tripled, while EPS did not quite double.
"A 9% asset compounder that issues 44% more shares is a 5% wealth compounder in disguise."
IX. Analysis & Bear vs. Bull Case (1:44:00 – 1:57:00)
Imagine a utility analyst's screen in October 2026. CWT trades around $45.50, about 21 times 2025 earnings and about 22.5 times trailing earnings through mid-2026. That is roughly 1.6 to 1.7 times December 2025 book value of about $28 per share, with a dividend yield of about 2.5% on a $1.16 annual rate1. American Water Works, American States Water, Essential Utilities and SJW Group sit on the same screen. The question is what the multiple is paying for.
The moat: 7 Powers and Five Forces
Cornered resource and scale economies. CWT holds the legal service right and owns the physical network across its districts. Building a parallel system would cost so much that it is effectively impossible. This power is about as strong as any business has.
Switching costs. A homeowner in Bakersfield cannot switch water suppliers. Exit happens only through municipalization, where a city condemns and buys the system, which is rare, slow and paid at fair value.
Threat of substitutes and technology. For delivery of potable water, there is effectively none. Technology helps on costs instead: acoustic leak detection, smart meters and automated pressure management can reduce losses. Software and AI do not threaten a buried pipe.
Supplier power. Wholesale water agencies are monopolies themselves, but balancing accounts pass their prices through to customers (Section II).
Buyer power: the state. This is where the moat stops. The real counterparty is not the household but the CPUC, which negotiates for about 500,000 captive customers1 and sets price, return and timing. In 7 Powers terms, CWT has a near-total monopoly over customers and no bargaining power over the regulator. Its moat keeps competitors out but lets the regulator decide what the company earns.
What the multiple suggests
CWT trades below national pure-plays such as AWK and AWR and above the smaller regional names. That fits the analysis. Investors pay for American Water Works' spread across many state commissions and for American States Water's contracted military-base business. They mark down CWT for single-state concentration, weather risk and a history of lag. The current multiple seems to assume the realized-to-authorized gap narrows somewhat without closing.
The bear case
- California regulatory friction persists. If the 2027 cost-of-capital case leaves the 10.27% ROE unchanged while borrowing costs remain high, and future rate cases are again late, the realized ROE stays in the 7–8% range.
- Climate and catastrophe. Wildfire, drought and earthquakes are concentrated in one territory. The wildfire liabilities faced by California electric utilities show that infrastructure in fire country can produce sudden, large claims, even if water systems have a different risk profile.
- Dilution. With annual capex above $500 million and the $350 million ATM in place, per-share growth could keep trailing aggregate growth by 3 points a year, as it did from 2012 to 2025.
The bull case
- Regulatory reforms. The Sales Reconciliation Mechanism and a larger fixed meter charge under D.26-04-045 could reduce forecast risk and narrow the ROE gap2.
- Approved capital deployment. $1.45 billion of approved 2024–2027 investment plus up to $229 million of advice-letter projects2 push the rate base into a pre-approved pipeline.
- The income record. 79 years of dividends and 57 consecutive increases1 keep a loyal group of income investors in the stock during bad markets.
Weighing it
History does not reject the bull case. It narrows it. CWT's monopoly and rate-base growth are real and have compounded for decades. But the period from 2012 to 2025, a single management team operating under a single regulator, shows a business that converts about 9% asset growth into about 5% per-share earnings growth with large year-to-year swings. A forecast of steady double-digit compounding would need to explain why the next decade will differ from that record. The investment case looks like a high-quality income holding with modest growth, not a strong compounder.
Three KPIs to watch
- Realized vs. authorized ROE. About 7.6% in 2025 against 10.27% authorized1. The question is whether the gap narrows under D.26-04-045.
- ATM equity issuance against net income. About $4 million issued in 2025, after $115 million and $89 million in the two prior years1, with $350 million of capacity now available.
- Rate-case timeliness. Both recent California GRC decisions arrived well after their test years started. An on-time decision on the next cycle would be the strongest sign of change.
X. Epilogue (1:57:00 – 2:02:00)
As of October 2026, Cal Water operates under a new rate decision for the first time in years. First-half revenue was up about 12% and net income up about 9%2, helped by approved rate increases and the $90.5 million retroactive recovery. Balancing accounts are working, PFAS settlement installments keep arriving, and the $350 million equity program is ready to fund the next round of construction.
Three events will test the four questions.
The pay vote. The first vote after the 67% result, held at the May 2026 meeting, measured how the Korn Ferry redesign was received. The more important test comes later: whether future incentive plans actually adjust for the timing of regulatory decisions so that bonuses track performance in both lag years and catch-up years.
Implementing D.26-04-045. If the Sales Reconciliation Mechanism and the larger fixed charge work as intended, 2026–2027 earnings should be steadier, and realized ROE should move toward the authorized level. If not, the gap of about 250 basis points is structural, not cyclical.
The May 1, 2027 cost-of-capital filing. This is Cal Water's first chance in years to argue for a higher ROE that reflects today's interest rates. A higher allowed return would raise the value of the existing rate base. An unchanged result would confirm what investors already suspect: in California, the authorized return is a negotiating position and the regulator decides how much of it the company earns.
The underlying tension remains. A utility cannot grow faster than its regulator allows, and it cannot compound value per share if each step of growth is paid for with new shares.
XI. Outro (2:02:00 – 2:06:00)
A century ago, crews laid iron pipe under Santa Clara Valley orchards to supply farm towns. Today the same corridors carry water to neighborhoods and offices in one of the world's most valuable economic regions. The pipe has been replaced many times. The franchise has not changed.
That is CWT's paradox. It delivers something nobody can live without, holds a legal monopoly, and collects its bills with near certainty. Its owners still have to keep putting capital into the ground to stay where they are.
In the water business, nature provides the monopoly, the regulator sets the price, and the shareholder pays for the pipes.
References
-
California Water Service Group Form 10-K for the Fiscal Year Ended December 31, 2025 — SEC EDGAR, 2026-02-27 ↩↩↩↩↩↩↩↩↩↩↩↩↩↩↩↩↩↩↩↩↩↩↩↩↩↩↩↩↩↩↩↩↩↩↩↩↩↩↩↩↩↩↩↩↩↩↩↩↩↩↩↩↩↩↩↩↩↩↩↩↩↩↩
-
California Water Service Group Form 10-Q for the Quarterly Period Ended June 30, 2026 — SEC EDGAR, 2026-07-30 ↩↩↩↩↩↩↩↩↩
-
California Water Service Group Definitive Proxy Statement DEF 14A — SEC EDGAR, 2026-04-08 ↩↩↩↩↩↩↩↩↩↩↩↩↩
-
California Water Service Group Form 10-K for the Fiscal Year Ended December 31, 2023 — SEC EDGAR, 2024-02-29 ↩
-
California Water Service Group Form 10-K for the Fiscal Year Ended December 31, 2016 — SEC EDGAR, 2017-02-23 ↩↩↩↩↩↩↩
-
California Water Service Group Announces Approval of 2021 General Rate Case by CPUC — Business Wire, 2024-03-08 ↩
-
California Water Service Group Form 8-K: Results of 2025 Annual Meeting of Stockholders — SEC EDGAR, 2025-05-30 ↩↩
-
U.S. EPA Final National Primary Drinking Water Regulation for Six PFAS — U.S. Environmental Protection Agency, 2024-04-10 ↩
-
S&P Global Ratings Research Update: California Water Service Group Ratings Affirmed At 'A+' — S&P Global Ratings, 2025-06-18 ↩↩
-
California Water Service Group Form 10-K for the Fiscal Year Ended December 31, 2020 — SEC EDGAR, 2021-02-25 ↩
 LinkedIn
 WhatsApp
 Reddit
 Hacker News
 Email
Email Kindle
 RSS Feed
 Spotify
 Apple Podcasts
 Amazon Music
 Audible
 YouTube