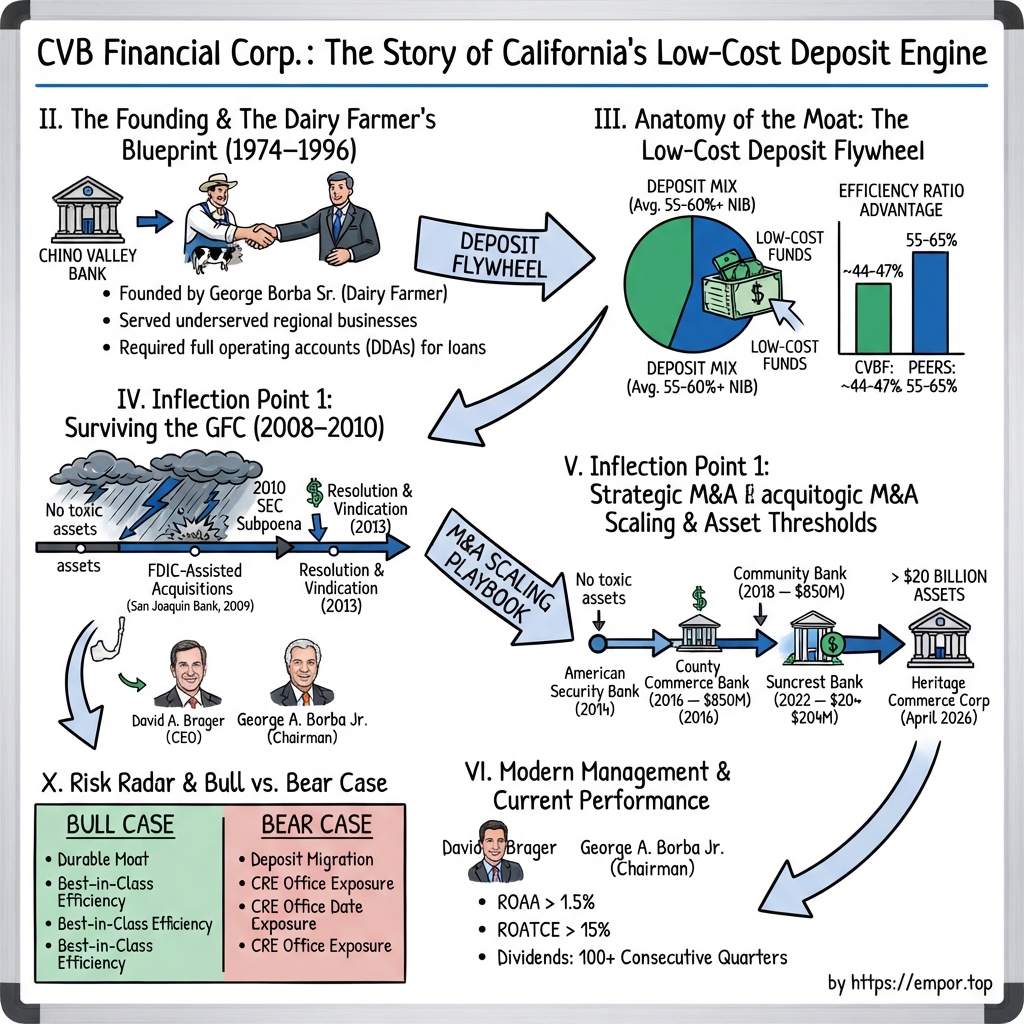
CVB Financial Corp.: The Story of California's Low-Cost Deposit Engine
I. Introduction & Episode Roadmap
On the morning of June 22, 2026, thousands of small-business owners across the San Francisco Bay Area logged into their bank accounts to find a new interface. Over a single weekend—June 19 to June 21—the core banking systems of Heritage Bank of Commerce were folded into Citizens Business Bank. Sixteen branches from San Jose to Walnut Creek opened that Monday under a new parent company headquartered 400 miles south in Ontario, California, situated between the Inland Empire's warehouse corridor and former dairy farmland.
It was the largest integration in the 52-year history of CVB Financial Corp., executed just nine weeks after closing the transaction. On a July earnings call, CEO David Brager was asked how it felt to complete the conversion. "It's a great feeling most of the time," he said.6
That understated response reflects the operating style of CVB Financial Corp. (NASDAQ: CVBF), a holding company that has spent five decades pursuing an unglamorous, low-cost commercial banking strategy. As the parent of Citizens Business Bank, National Association, CVB carried $21.18 billion in total assets, approximately $12.1 billion in loans, and about $16.9 billion in deposits and customer repurchase agreements following the Heritage merger closure on April 17, 2026.3 The bank avoids venture debt, cryptocurrency custody, and banking-as-a-service fintech platforms. Instead, it gathers the operating cash of California's small and mid-sized businesses—including payroll accounts, escrow balances, and agricultural operating lines—holding much of that capital without paying interest.
This funding model drives the bank's financial structure. Because banking is fundamentally a spread business—borrowing funds at one rate and lending at another—most institutions compete for higher yield on the asset side. CVB has historically focused on the liability side by minimizing funding costs. At the end of 2025, 56.33% of its deposits paid no interest at all.1 For that full year, the bank's average total cost of deposits and customer repurchase agreements—including interest-bearing accounts—was 0.88%, even as the Federal Reserve's target benchmark rate remained above 4% for most of the period.1
The optimistic thesis holds that such low-cost funding represents a structural advantage that allows a regional California bank to generate strong returns without reaching for loan yield. The counterargument posits that non-interest-bearing funding is not immune to rate pressures, and recent market dynamics demonstrate that low-cost deposits can reprice or migrate when interest rates remain elevated.
The historical record provides a test for both perspectives. In August 1974, dairy farmer George A. Borba Sr. and a group of Chino business owners chartered the bank after money-center institutions declined to serve their local market.2 Citizens Business Bank developed into an engine for gathering zero-cost operating deposits, maintaining sufficient stability through the 2008 global financial crisis to acquire a failed competitor from the FDIC in 2009. Two years later, the institution faced regulatory scrutiny when an SEC subpoena regarding accounting for a major borrower triggered a stock drop and a securities class action that reached the Ninth Circuit Court of Appeals. After resolving those challenges, CVB utilized its high-valuation equity as an acquisition currency, acquiring institutions in Pasadena in 2018, Visalia and Sacramento in 2022, and the Bay Area in 2026.
Throughout this expansion, the bank's core thesis has faced operational tests. The proportion of non-interest-bearing deposits has declined for four consecutive years. In 2023, while management described its funding as "100% relationship based core deposits," CVB experienced a $1.7 billion deposit outflow over twelve months, replacing those funds with $1.91 billion in emergency borrowings from the Federal Reserve's Bank Term Funding Program.9 Meanwhile, the bank's efficiency ratio—measuring operating expenses as a percentage of revenue—rose from 38.98% in 2022 to 46.03% in 2025.101
The primary analytical question is not whether CVB is a stable institution, but whether its low-cost deposit base constitutes a permanent structural moat or a cyclical advantage that is gradually repricing. Fifty years of financial disclosures provide the evidence to evaluate where the bank stands along that spectrum.
 Subscribe on LinkedIn
II. The Founding & The Dairy Farmer's Blueprint (1974–1996)
Chino, California, in the early 1970s smelled of agriculture and industry in roughly equal measure. Located 40 miles east of downtown Los Angeles, the Chino Valley contained one of the densest concentrations of dairy cattle in the United States, run by Portuguese and Dutch immigrant families farming land ahead of suburban expansion. At the time, middle-market business owners struggled to secure local commercial banking services. Money-center institutions such as Bank of America and Security Pacific focused on building consumer branch networks and corporate underwriting desks. For those major lenders, an agricultural operation with 900 cows, seasonal feed expenses, and working-capital requirements was an administrative nuisance.
George A. Borba Sr. was one of those dairy farmers. Recognizing an underserved commercial niche, Borba joined a group of local business leaders to charter Chino Valley Bank in August 1974.2 The bank's core premise was straightforward: serve owner-operated businesses by building long-term credit and deposit relationships rather than facilitating transaction-based loans.
The model rested on a structural insight regarding the liability side of the balance sheet. Agricultural and industrial enterprises required substantial working capital, generating steady cash float from milk-check receipts, feed reserves, and payroll accounts. Similar cash dynamics existed across the Inland Empire, from Ontario die-casters to Riverside title companies and Fresno produce distributors. Deposited into commercial checking accounts, these operating balances historically paid zero interest under federal regulations. By requiring operating accounts as a condition for extending credit lines, the founders created a low-cost, predictable funding base.
In commercial banking—where money functions as a raw material—most lenders compete on the asset side by seeking higher yields through riskier loans. CVB's founders chose instead to compete on the input side by minimizing funding costs. In a commodity industry, a structural cost advantage compounds across interest rate cycles without requiring lenders to loosen credit standards or take on higher risk to generate returns.
Two economic trends supported this model in 1970s Southern California. First, the Inland Empire was emerging as a logistics and light-manufacturing hub, attracting metal fabricators, food processors, and freight distributors that were too complex for retail bank branches yet too small for corporate syndication desks. Second, major California banks continued to retreat from middle-market commercial relationships to pursue consumer scale. That divergence created an unserved commercial segment that endured for decades.
The founders established three operating rules that continued to shape the bank's strategy: bank the business owner alongside the enterprise through joint personal and commercial underwriting; require a full operating and treasury relationship as a condition of credit rather than competing solely on loan pricing; and maintain strict credit standards throughout economic cycles, even during competitive booms.
The corporate architecture followed the bank's commercial expansion. CVB Financial Corp. incorporated in California on April 27, 1981, and commenced business on December 30, 1981, acquiring all voting stock of Chino Valley Bank in a corporate reorganization.1 This holding-company structure established a publicly traded equity currency that later facilitated bank acquisitions.
On March 29, 1996, Chino Valley Bank changed its name to Citizens Business Bank.1 The strategic rebranding signaled a shift from a local agricultural charter to a regional commercial banking franchise expanding across Southern California, the Central Valley, and eventually northern California.
Governance also retained founding connections. George A. Borba Jr., who became a partner in George Borba and Son Dairy in 1990 and serves as president of Belonave Dairy and 5 Mile Ranch LLC in Bakersfield, joined the board in 2012 and was appointed Chairman of the Board effective May 2026.2621 As of the 2026 record date, Borba family trusts together with George Borba and Son Dairy, L.P. held 7,753,506 shares—representing 5.7% of total equity—while Borba Jr.’s individual beneficial ownership stood at 7,677,334 shares, or 5.6%.21 Concentrated family equity at this scale provides long-term strategic continuity, though it also creates a prominent insider stakeholder group within a publicly traded institution.
The institution prioritized controlled balance-sheet growth over rapid loan expansion, taking 44 years to cross $10 billion in assets in 2018.12 Rather than rapidly expanding its loan portfolio, the bank focused on compounding its core deposit franchise through multiple economic cycles.
III. Anatomy of the Moat: The Low-Cost Deposit Flywheel
When the Federal Reserve raised its policy rate by more than four percentage points in 2022—the fastest tightening cycle since the early 1980s—CVB Financial's average cost of deposits and customer repurchase agreements for the entire year was just five basis points.9 Five one-hundredths of one percent. The bank was, for practical purposes, funding an $11 billion balance sheet at virtually zero interest expense while short-term Treasuries yielded 4%.
That is the power of a non-interest-bearing deposit base: it converts rising rates from an industry expense into a net interest windfall, as loan yields reprice upward while funding costs stay anchored near zero.
Why the operating account is different from a savings account
Understanding the mechanics requires distinguishing commercial cash management from consumer savings. While retail deposits frequently chase yield—moving quickly when higher-rate alternatives appear—a commercial operating account serves as functional business infrastructure. Payroll, vendor disbursements, receivables, wire instructions, positive-pay verification, lockbox services, ACH origination limits, and accounting integrations are all anchored to this single account.
Transferring that banking relationship is not a simple yield decision; it is an operational migration that demands substantial administrative bandwidth. That switching friction creates structural deposit stickiness, allowing the bank to gather funds based on operational reliability rather than interest rate pricing. Tenure data underscores this dynamic: at the end of 2025, 47% of CVB's deposit relationships had banked with the institution for more than ten years, and approximately 75% for three years or more.1 Business accounts represented 78% of core customer deposits, with the remaining 22% belonging primarily to the owners and executives of those commercial clients.1
This funding advantage flows directly into the income statement. In 2025, CVB generated $460.3 million in net interest income on average earning assets, yielding a net interest margin of 3.35%.1 While that margin is not extraordinary on an absolute basis, it is distinctive in its origin: driven not by taking elevated credit risk on loans, but by maintaining near-zero liability costs.
The four engines
CVB's deposit franchise is fed by four distinct business segments, each displaying different operating behaviors.
The core commercial bank remains the primary engine, serving middle-market manufacturers, distributors, contractors, and professional service firms across Southern California and the Central Valley. Here, operating-account discipline is strongest and switching costs are highest. This group also generates the bulk of the loan portfolio: at the end of 2025, real estate loans represented 79.25% of gross loans, with commercial real estate accounting for 75.60% of total lending.1 This heavy real estate concentration represents a key balance-sheet exposure that warrants dedicated analysis in later sections.
Dairy, livestock, and agribusiness represents the founding franchise, though it now comprises a smaller portion of the balance sheet. Loans in this segment totaled $431.6 million at the end of 2025, up from $419.9 million a year earlier—representing roughly 5% of the total loan portfolio.1 The segment's strategic weight exceeds its loan volume because it provides specialized underwriting capabilities that few regional peers match, while generating substantial deposit and fee relationships alongside credit lines. It also exhibits marked seasonality, creating predictable intra-year deposit fluctuations.
Specialty banking—focused on title and escrow firms, property managers, and fiduciaries—serves as a quietly essential funding channel. On CVB's first-quarter 2025 earnings call, CEO David Brager noted that the group recorded its best performance in 2024, with incoming deposits running at "90-plus percent non-interest-bearing."8 However, this unit is inherently cyclical, as escrow balances fluctuate with California real estate volume. Brager noted that specialty banking deposits remained roughly $400 million below their historic peak at that time, pending a recovery in residential transaction activity.8 By the end of 2025, the finance-and-insurance classification—which encompasses much of this business—became CVB's largest deposit concentration at approximately 13%, surpassing manufacturing's former top spot of 7% two years prior.19 This shift indicates that a larger portion of the bank's non-interest-bearing funding has become tied to real estate transaction velocity rather than ongoing corporate payrolls.
CitizensTrust, the wealth management and trust division, provides fee income. Managing and administering approximately $5.11 billion in assets at the end of 2025—including $3.75 billion in assets under management—the unit generated $15.0 million in annual fees, up 9.5% year over year.1 Relative to $460.3 million in net interest income, CitizensTrust contributes modestly to total revenue. Strategically, however, it serves as a defensive buffer: in 2023, approximately $800 million in customer deposits migrated off CVB's balance sheet into CitizensTrust to purchase Treasuries.9 The trust division thus helps retain client relationships when depositors seek market yields, highlighting the natural boundary of the bank's zero-cost operating deposit moat.
How much of an advantage is it, really?
Comparing CVB against regional peers illustrates the scale of its funding moat. East West Bancorp, one of California's largest commercial banks, reported that non-interest-bearing deposits held steady at 25% of total deposits for both the second quarter and the first half of 2026, compared with 24% in the corresponding periods a year earlier.25 In the same quarter, CVB maintained a non-interest-bearing deposit ratio of 52.8% at period end—even after absorbing the dilutive mix of Heritage Bank of Commerce, down from 59% pre-merger.36 Maintaining non-interest funding at more than double the level of a strong peer demonstrates a structural competitive gap.
The bank's efficiency ratio highlights a parallel trend. CVB's efficiency ratio—operating expenses as a percentage of revenue—was 38.98% in 2022, placing it among the most efficient commercial lenders in the nation.10 By 2025, that ratio had risen to 46.03%.1 This shift was not primarily driven by runaway overhead: non-interest expense as a percentage of average assets rose modestly from 1.41% in 2023 to 1.54% in 2025, a change partly reflecting a $207 million reduction in average assets from deliberate balance-sheet deleveraging.1 Instead, the primary driver was revenue compression: as overall funding costs adjusted upward from near zero, top-line revenue growth slowed.
This dynamic illustrates a key analytical principle: CVB's efficiency advantage and deposit advantage are not two independent moats, but twin manifestations of the same underlying balance-sheet structure. When non-interest-bearing deposits reprice or shift into interest-bearing categories, funding costs and efficiency metrics compress simultaneously.
IV. Inflection Point 1: Surviving the GFC & The 2010 SEC Reserve Subpoena
Late on Friday, October 16, 2009, the California Department of Financial Institutions closed San Joaquin Bank of Bakersfield and appointed the FDIC as receiver. Within hours, Citizens Business Bank signed an agreement to purchase most of the failed bank's assets and assume its deposits. "We are enthusiastic about the opportunity to grow our presence in the Bakersfield area," then-CEO Chris Myers said in the announcement.19
This transaction reflects how the global financial crisis is often framed in CVB's corporate history: as a moment when a conservative balance sheet became a strategic weapon. Having avoided the high-risk residential mortgage exposures that led to the collapse of hundreds of regional peers, the institution entered the downturn with sufficient liquidity and capital for regulators to hand it a competitor's franchise over a single weekend.
While that narrative is accurate, it remains incomplete. The full history reveals a more nuanced operational lesson.
The Garrett problem
CVB's largest borrower entering the financial crisis was the Garrett Group, a commercial real estate firm. According to the Ninth Circuit's published account, Garrett notified CVB in late August or early September 2008 that it could not meet its loan obligations, prompting a debt restructuring. In March 2009, CVB extended a new $53 million loan to Garrett, secured by rent receivables from fifteen properties. When that loan closed, Garrett was already ninety days delinquent on existing debt to CVB and used roughly a quarter of the new proceeds to cure its own default.17
Throughout 2009 and early 2010, CVB represented in its SEC filings that there was no basis for "serious doubt" regarding Garrett's ability to repay. In early 2010, however, Garrett informed the bank once again that it could not make required payments and was contemplating bankruptcy.17
On July 26, 2010, CVB received a subpoena from the SEC's Los Angeles regional office. The inquiry requested documents regarding the company's loan-loss allowance methodology, underwriting guidelines, loan-grading processes, and provisions for credit losses, as well as transcripts and materials from presentations given to analysts, brokers, and investors.13
On the same day the subpoena arrived, the company's chief financial officer announced his retirement. Investors drew a direct connection, prompting the bank to address the optics over the following weeks. On August 12, 2010, CVB announced that CFO Edward J. Biebrich Jr. had postponed his departure to assist with the SEC response. "Much has been made of the notice of my resignation coinciding with the receipt of the subpoena from the SEC," Biebrich said. "This is strictly a coincidence and my retirement is not caused by the subpoena."18
A common point of confusion in subsequent retellings involves the identity of the executive; the departing officer was CFO Biebrich, whereas Garrett was the commercial borrower.
The day after disclosing the subpoena, CVB's stock fell 22%.17 One month later, the bank wrote down $34 million of Garrett loans and classified the remaining $48 million as non-performing assets.17
What the episode actually proves
This episode provides an empirical test of a common investor thesis: that underwriting discipline is so deeply ingrained in CVB's culture that credit risk is essentially engineered out of the business model. The Garrett record challenges that assertion in its strongest form. Extending fresh capital to a borrower ninety days delinquent—who immediately uses a portion of those funds to bring prior loans current—and subsequently assuring the market that repayment remains clear of serious doubt reflects standard downturn pressure to modify problematic credits rather than recognize prompt losses.
The core conservative thesis survives, however, in a more modest form. The $34 million write-down—set against $6.44 billion in total assets at year-end 2010—was manageable;27 the underlying real estate collateral possessed tangible value; and CVB never restated its financials, reported a quarterly loss, or raised emergency equity. The breakdown stemmed from concentrated credit exposure to a single borrower and subsequent disclosure choices, rather than systemic institutional failure.
The legal fallout persisted for six years. A shareholder class action, Lloyd v. CVB Financial Corp., was filed in August 2010 and consolidated in January 2011 with the Jacksonville Police and Fire Pension Fund as lead plaintiff, alleging securities fraud for a class period spanning October 21, 2009 to August 9, 2010.13 The U.S. District Court dismissed the complaint three times—in January 2012, August 2012, and May 2013—before entering a dismissal with prejudice in September 2013.1315
On appeal, the Ninth Circuit affirmed in part and reversed in part on February 1, 2016, holding that the complaint stated a valid claim regarding two alleged misstatements. The ruling established an influential precedent in securities law: an announcement of a regulatory investigation, when coupled with a subsequent disclosure revealing that prior representations were inaccurate, can constitute a corrective disclosure for establishing loss causation.17 On October 26, 2016, the litigation settled for $6.2 million, covered entirely by insurance proceeds without an admission of liability.16 A parallel derivative lawsuit, Sanderson v. Borba, was dismissed without prejudice by stipulation in January 2016.15
The SEC investigation itself concluded quietly. In its 2014 annual report, CVB disclosed that it had "not been contacted by the SEC in connection with this matter since October 2011," noting it could not predict the timing or ultimate resolution of the inquiry.14 By the 2015 annual report, the disclosure was removed entirely.15 The SEC never filed an enforcement action, nor did CVB restate its earnings. While this represented a favorable outcome, the factual record indicates the investigation lapsed into silence rather than ending with an affirmative regulatory exoneration.
The lasting lesson for investors concerns portfolio concentration rather than institutional culture. A relationship-driven bank that succeeds by knowing its commercial clients intimately can, by the same logic, accumulate outsized exposure to borrowers with whom it has long-standing ties. CVB's subsequent reporting practices—including detailed commentary on classified loans, clear loan-to-value tables, and explicit discussion of individual credit downgrades on investor calls—reflect an institution that adapted its governance following a costly lesson in borrower concentration.
V. Inflection Point 2: Strategic M&A Scaling & Asset Thresholds
For most of its history, CVB grew by opening offices. Starting in the middle of the last decade, it grew by buying them — and the reason is a piece of financial mechanics worth spelling out, because it explains the whole second act.
A bank with a superb deposit franchise trades at a high multiple of tangible book value. A bank with an ordinary deposit franchise does not. If the first bank buys the second using its own stock, and if it can then apply its funding costs and its expense discipline to the acquired balance sheet, the arithmetic works before a single new customer is won. The acquirer is, in effect, arbitraging the gap between how the market prices deposits and how much they are worth inside its own machine.
CVB has been executing that trade, in increasing size, for a decade.
The infills
On May 15, 2014, Citizens Business Bank acquired all the assets and assumed all the liabilities of American Security Bank for $57.0 million in cash. The acquired balance sheet carried $436.4 million of assets at fair value, including $242.7 million of loans and $378.4 million of deposits, and generated $19.1 million of goodwill. American Security brought five branches — Newport Beach, Laguna Niguel, Corona, Lancaster, and Apple Valley — plus a loan production office in Ontario.14
Two more infills followed. County Commerce Bank of Oxnard, with four branches in Ventura, Oxnard, Camarillo, and Westlake Village and roughly $253 million of total assets, was absorbed in 2016. On March 10, 2017, CVB completed the acquisition of Valley Commerce Bancorp, holding company for Valley Business Bank, four branches and approximately $400 million of assets in the Central Valley — a deal explicitly framed as strengthening market share in the founding franchise's agricultural heartland.12
None of these transactions changed the company. Together they did something more useful: they proved a repeatable process for converting someone else's branch network into CVB's operating model without breaking anything, and they built the institutional muscle that a $4 billion target would later require. This is the unglamorous middle of most successful acquisition programs — a decade of small deals nobody writes about, followed by a large deal that only works because of them.
Pasadena, and the $10 billion line
On August 10, 2018, CVB completed the acquisition of Community Bank, a Pasadena institution with sixteen banking centers across greater Los Angeles and Orange County and total assets of approximately $4.09 billion.12 The company issued approximately 29.8 million shares and paid approximately $180.7 million in cash; the stock component alone added $722.8 million to shareholders' equity, which rose 73.13% that year to $1.85 billion.12 It was, at the time, by far the largest deal in company history, and it doubled down on the densest commercial market in the state.
It also pushed CVB across $10 billion of total assets in the third quarter of 2018 — a genuine regulatory threshold in the United States, triggering general oversight by the Consumer Financial Protection Bureau and a package of additional compliance requirements. The company said as much in its own risk factors: crossing $10 billion would "impose additional compliance costs on our business" and "may also result in higher expectations from regulators."12
Now the disconfirming test, because this is where a common CVB narrative needs correcting. The story usually told is that integration blew up the expense base. The record is more modest. The efficiency ratio was 43.84% in 2017, rose to 45.83% in 2018 — the integration year — and then fell to 40.16% in 2019, the best figure the company had posted in years, alongside a return on average assets of 1.84% and a tax-equivalent net interest margin of 4.36%.11 In other words, the drag was real, it was roughly two percentage points, and it reversed within twelve months.
That is meaningful evidence for the integration playbook, and it is the strongest single data point in favor of management's M&A competence. It is also the reason to be skeptical of the claim that the $10 billion threshold, or debit-interchange caps under the Durbin Amendment, structurally impaired the model. For a bank whose customers are companies rather than consumers, debit interchange was never a large revenue line. The 2019 results are inconsistent with a permanent threshold drag.
The Central Valley, and the currency
The Suncrest Bank merger closed on January 7, 2022, in a stock-and-cash transaction valued at approximately $237 million in aggregate, or $18.63 per Suncrest share based on CVB's closing price of $22.87 that day. CVB issued approximately 8.6 million shares and about $39.6 million in cash. Suncrest, headquartered in Visalia, brought roughly $1.4 billion of assets, $0.8 billion of net loans, and $1.2 billion of deposits, with seven branches and two loan production offices reaching north to Sacramento.20
Note the structure: overwhelmingly stock. That was the currency trade in its purest form, executed at a moment when CVB's shares were near their post-pandemic highs and the target's deposits could be repriced downward into CVB's cost structure.
Silicon Valley
On December 17, 2025, CVB and Heritage Commerce Corp announced a definitive merger agreement — an all-stock transaction valued at approximately $811 million, or $13.00 per Heritage share based on CVB's closing price the prior day, at an exchange ratio of 0.6500 CVB shares per Heritage share. CVB shareholders would own approximately 77% of the combined company and Heritage shareholders approximately 23%.4
Management's projections were specific, which is useful because specific projections can be graded later: 2027 EPS accretion of 13.2%, an internal rate of return of approximately 20%, and 7.7% dilution to tangible book value per share with an earn-back period of approximately 2.5 years including interest-rate marks.4 Brager called it "the most strategic and the largest acquisition by assets in our history."4
It closed on April 17, 2026. Total consideration was approximately $845 million, producing roughly $450 million of intangible assets including $334 million of goodwill. CVB issued 40.6 million shares, taking shareholders' equity from $2.3 billion at March 31 to $3.2 billion at June 30. Total assets went from $15.5 billion to $21.2 billion; the acquired loan portfolio was carried at a fair value of $3.8 billion, with an initial allowance for credit losses on those loans of $46.6 million.65
The balance-sheet surgery that followed is the most revealing part. Of the $1 billion investment portfolio inherited from Heritage, CVB sold $490 million at close and reinvested roughly $500 million at an average yield near 4.7%. It sold the acquired single-family mortgage pools at their fair value of $327 million, settling June 10. It let $300 million of maturing brokered CDs run off without replacement, swapped $300 million of hedged funding into 90-day Federal Home Loan Bank advances, and declined to replace $300 million of maturing FHLB advances carrying a 4.73% rate.6 The net effect: cost of funds actually fell, from 0.97% in the first quarter to 0.96% in the second.6
That is not a bank passively absorbing an acquisition. That is a bank using an acquisition as cover to reshape its own funding stack.
Grading the trade
Two honest caveats belong next to the enthusiasm. First, the accretion math depends on cost savings that had not yet been delivered as of the most recent report: CFO Allen Nicholson told analysts that the third quarter of 2026 would "still have some noise," that the fourth quarter would be "fairly clean," and that roughly 90% to 95% of promised cost saves should be visible by the fourth quarter with full realization in 2027.6 Second, the deal diluted the company's most distinctive asset. Non-interest-bearing deposits fell from 59% of the total pre-merger to 52.8% at June 30, 2026 — a six-point step down purchased in exchange for Bay Area distribution.36
Whether that was a good trade will be settled by 2027 numbers, not by 2026 narrative. The specific, falsifiable test management has offered: EPS accretion of 13% or greater in 2027, a 1.50% return on average assets, and a 17% return on tangible common equity.6 Those are the promises on the record.
VI. Current Management, Capital Allocation, & Governance
The most telling fact about David Brager's career is where it started. Before he ran CVB Financial Corp., he managed a branch — specifically, the Fresno Business Financial Center, from 2003 to 2007. From there he became senior vice president and regional manager for the Central Valley, then, on November 22, 2010, executive vice president and Sales Division Manager for the entire bank. He was appointed chief executive officer on March 16, 2020 — three days after the World Health Organization declared a pandemic — and added the president title on November 19, 2021.1 He holds a B.S. from California State University, Fresno, and is a graduate of the Pacific Coast Banking School.21 Before CVB, he spent 1997 to 2003 at Westamerica Bank, another institution known for obsessive expense control.1
That biography matters because it predicts the operating style. Brager is a deposit-gatherer who became a CEO, not a capital-markets executive who was handed a bank. On calls, he talks about line utilization rates, the mix of owner-occupied versus investor real estate, and whether a particular relationship monetizes across lending, deposits, and fees. Asked in April 2025 whether tariff uncertainty had changed underwriting, his answer was blunt: "we don't loosen or tighten based on the environment. We just have a very disciplined approach regardless of the economic environment we're in."8
That is a claim, not a fact, and it is testable — the Garrett episode is one test it partly fails, though under an earlier management regime. A better test is behavioral consistency, and on that measure the record is reasonably strong: through 2023 and 2024, when the temptation was to defend deposit balances by paying up, CVB let balances leave rather than chase them, and its cost of deposits and repos peaked at a level most peers would envy.
The CFO, E. Allen Nicholson, is the technical counterweight. Appointed on May 4, 2016, he came from Pacific Premier Bancorp, where he was CFO from June 2015 to May 2016; before that he was CFO of 1st Enterprise Bank from 2008 to 2014 and of Mellon 1st Business Bank from 2005 to 2008.1 The through-line is Los Angeles business banking — the same customer, the same funding model, three institutions. His fingerprints are visible in the balance-sheet machinery: the $700 million of fair-value hedges on the securities portfolio, the deliberate shortening of portfolio duration through variable-rate and hybrid-ARM purchases, and the post-merger funding reshuffle.16
The chief credit officer, David F. Farnsworth, arrived in July 2016 from BBVA Compass, where he ran global risk management and served as national CRE risk executive, with prior senior credit roles at U.S. Bank and AmSouth.1 For a bank with three-quarters of its loans in commercial real estate, that hire was not incidental.
The bench changed again in 2026. Clay Jones, Heritage's president and CEO, became president of the combined organization, and two Heritage directors — Jones and Julianne Biagini-Komas — joined the boards, taking director count from nine to eleven.5 Longtime general counsel Richard Wohl, who had served since October 2011, retired effective June 5, 2026; the compensation committee accelerated vesting on equity awards it valued at approximately $364,346.24 And on July 22, 2026, the company appointed Michael J. Maddox, formerly CEO of CrossFirst Bankshares and subsequently president and vice chairman of First Busey Corporation, as a director.23
What management is actually paid to do
This is where the record contradicts a widely repeated claim. CVB's annual incentive plan is not calibrated to return on assets or return on tangible common equity. For 2025, the CEO's plan weighted net profit after tax at 50%, non-interest (operating) expenses at 20%, and average noninterest-bearing demand deposits, average total net loans, and non-interest income at 10% each.21
Read that allocation again. Half the bonus is earnings, a fifth is expense control, and a tenth is explicitly the average balance of free deposits. Whatever one thinks of the weighting, it is internally coherent with the strategy: the company pays its executives to protect the two variables that constitute the moat. A skeptic would note the absence of any credit-quality metric in the CEO's own scorecard for that year — delinquencies and non-performing loans carried 0% weight in his plan, though they appeared in other named executives' plans — which is a fair governance criticism at a bank with 75.60% CRE concentration.211
Alignment beyond the bonus is genuine. Current directors and executive officers as a group — fourteen people — beneficially owned 6.4% of the company as of the 2026 record date, a figure dominated by the founding family's stake.21 Institutional ownership is conventional: BlackRock at 14.3%, Vanguard at 11.6%, Dimensional Fund Advisors at 5.1%.21 At the annual meeting on May 20, 2026, shareholders elected ten directors, ratified KPMG LLP as auditor, and approved the advisory say-on-pay proposal with 92.1 million votes for against 6.5 million opposed — support in the low nineties percent, which is unremarkable but not a rubber stamp.22
Capital allocation: consistent, and recently more aggressive
The dividend record is the company's proudest statistic and one of the few genuinely rare things in American banking. The second quarter of 2026 marked the 197th consecutive quarter of profitability — every quarter for more than forty-nine years — and the 147th consecutive quarter of paying a cash dividend, most recently $0.20 per share.3
Buybacks have been opportunistic rather than programmatic. The board authorized a 10 million share repurchase program in November 2024; by late April 2025 the company had bought 2.05 million shares year-to-date at an average price of $18.13, and Brager framed the logic explicitly — around 1.7 times tangible book value, "we feel we're undervalued."8 The company repurchased 4.2 million shares over the course of 2025, paused while the Heritage transaction was pending, and in June 2026 authorized a new plan for up to 15 million shares, buying 409,000 shares between June 18 and July 21, 2026 at an average of $21.72.736
That last data point is the most interesting one for a valuation-minded reader. Tangible book value per share was $11.07 at June 30, 2026, down from $11.42 at March 31 because of the merger's intangible creation.6 Repurchasing at $21.72 against $11.07 of tangible book is buying at roughly 1.96 times — nearly double the multiple at which the company was calling itself undervalued fifteen months earlier. Management can reasonably argue that post-merger earnings power justifies it. But "opportunistic repurchases executed only when the stock is cheap" is no longer an accurate description of what the company is doing, and investors should hold the newer, weaker version of that claim.
What CVB has genuinely avoided is category risk. The loan book contains no meaningful venture lending, no subprime consumer, no crypto, and no banking-as-a-service deposit brokering. That restraint is visible in the 2023 disclosure that the bank carried zero brokered deposits throughout that year.9 It is also worth noting the restraint slipped: the company held $300 million of brokered CDs at the end of both 2024 and 2025 before eliminating them again in the second quarter of 2026.16 Small in scale, but a reminder that "we don't do that" is a policy, not a law.
One accounting judgment deserves flagging. In 2024, CVB recognized $28.3 million of losses on sales of available-for-sale securities, largely offset by $25.9 million of gains from the sale and leaseback of four properties.1 Pairing a securities-loss trade with a real-estate gain in the same year produces a roughly earnings-neutral repositioning — legitimate and disclosed, but a reader should understand that the reported figure for that year was shaped by two discretionary transactions rather than by operations. The bank repeated a smaller version in 2025, with $11.0 million of securities losses alongside a $6.0 million legal settlement and a $2.3 million gain on other real estate owned.1
VII. Disconfirming Evidence & Modern Stress Tests
Every economic moat story deserves a rigorous stress test. CVB's franchise has faced three major analytical tests over the past four years, with the company's regulatory filings providing the empirical evidence to evaluate them.
Test 1: Are non-interest-bearing deposits actually captive?
The core thesis asserts that commercial operating deposits remain structurally free regardless of Federal Reserve policy.
The historical data complicates that claim. Average non-interest-bearing deposits represented 62.85% of total average deposits in 2022, 62.66% in 2023, and 58.98% in 2025.1091 On a period-end basis, non-interest-bearing deposits fell from 58.90% at the end of 2024 to 56.33% at December 31, 2025, and reached 52.8% at June 30, 2026 following the Heritage Commerce integration.13 Four consecutive years of mix shift demonstrate an ongoing structural shift rather than temporary noise.
Funding costs adjusted in step. The bank's five-basis-point cost of deposits in 2022 rose to 41 basis points in 2023, pushing total funding costs up 77 basis points to 0.83% in a single year.9 By 2025, the average total cost of deposits and repurchase agreements reached 0.88%.1 Net interest margin followed a two-phase trajectory: expanding from 2.96% in 2021 to 3.29% in 2022 as loan yields repriced faster than deposit costs, contracting to 3.08% in 2024 as deposit repricing caught up, and recovering to 3.35% in 2025.101 Rate hikes initially generated a net interest windfall before higher interest expenses began compressing margins.
The events of 2023 present the clearest evidence regarding deposit stickiness. Total deposits and customer repurchase agreements fell to $11.71 billion at December 31, 2023—a $1.7 billion decline over twelve months—including roughly $800 million that clients transferred into CitizensTrust wealth accounts to purchase Treasury securities. To replace those outflows, CVB drew $1.91 billion in one-year advances from the Federal Reserve's Bank Term Funding Program at a weighted average cost of 4.78%, along with $160 million in Federal Home Loan Bank advances at approximately 5.7%.9 Total wholesale borrowings increased by $1.08 billion over the year.
This borrowing record refutes the narrative that CVB generated net deposit inflows during the March 2023 regional banking stress. The bank experienced net deposit outflows and utilized emergency Federal Reserve liquidity facilities alongside regional peers. Furthermore, 48% of its deposit base was uncollateralized and uninsured at year-end 2023—a level comparable to institutions that experienced liquidity runs.9 Depositor composition and multi-year account tenure, rather than deposit insurance coverage, provided the primary stabilizing factor. By year-end 2025, uninsured deposits decreased to $6.56 billion from $7.72 billion twelve months earlier, leaving 45% of total deposits and repurchase agreements uninsured.1
Verdict: In its absolute form, the claim that operating deposits are permanent and immune to interest rates is unsupported by the record. In a qualified form, the thesis holds: CVB's total funding costs peaked at roughly one-third the level of commercial banking peers, its non-interest-bearing deposit ratio remained more than double that of competitors such as East West Bancorp, and emergency borrowings were fully retired, with total borrowings returning to $500 million in FHLB advances by year-end 2025.1 The evidence indicates that non-interest-bearing deposits are durable and reprice gradually rather than remaining permanently zero-cost. The key metric monitoring this trajectory is the organic non-interest-bearing deposit ratio post-merger.
Test 2: Is agribusiness lending a steady cash machine?
The financial record shows notable volume fluctuations in this segment. In the first quarter of 2025, dairy and livestock loan balances dropped by $168 million from year-end 2024—a reduction of nearly 40% in a single quarter—as credit line utilization fell from 81% to 64%.81 Management attributed this decline primarily to normal agricultural seasonality, as dairy operators routinely pay down revolving lines in the first quarter following year-end tax planning. An additional $40 million of the reduction resulted from liquidity distributions following Coca-Cola's acquisition of Fairlife, which dairy clients used to retire bank debt.8
This seasonal fluctuation reoccurred the following year. Dairy and agribusiness balances declined by $117 million in the first quarter of 2026 as line utilization dropped from 78% to 69%, falling further to 63% by June 30, 2026—a level management described as consistent with historical agricultural borrowing cycles.76
Verdict: Balance-sheet volatility in agribusiness lending is high, but it reflects credit line utilization cycles among liquid commercial borrowers rather than credit impairment. Because agribusiness represents roughly 5% of total loans, utilization swings do not threaten overall capital stability. The principal credit risk lies in borrower concentration: a single downgraded dairy relationship added $6.5 million to classified loans in the first quarter of 2025, even as broader criticized dairy loans decreased by $51 million over the same period.8 Consequently, credit analysis should focus on classified loan trends rather than seasonal balance fluctuations.
Test 3: How dangerous is the commercial real estate concentration?
Commercial real estate lending represents CVB's primary asset risk. At year-end 2025, commercial real estate loans totaled $6.574 billion, accounting for 75.60% of total loans.1 This level of concentration exceeds typical regulatory benchmarks for large institutions and receives focused supervisory review.
The bank mitigates this exposure through low loan-to-value underwriting and portfolio granularity. Office properties totaled $989.8 million, or 15.1% of the commercial real estate portfolio at the end of 2025, with an average origination loan-to-value ratio of approximately 55%. The average office loan size stood at $1.6 million, with 88% of office loans carrying balances under $10 million, and 47% originated prior to 2021.1 Retail properties represented $908.1 million, or 13.8% of commercial real estate, with an average origination loan-to-value of 47%.1 Across the entire commercial real estate portfolio, owner-occupied properties accounted for 35.5% of balances at origination.1
This portfolio structure differs substantially from urban institutional office exposure. Small suburban medical and professional buildings occupied by owner-operators present lower default rates than high-rise commercial towers. However, the vintage distribution poses a specific repricing risk: nearly half the office portfolio was underwritten before 2021 at lower interest rates and higher property valuations, requiring debt service adjustments as these loans reach maturity.
Asset quality metrics remained sound through mid-2026. Non-performing assets stood at $16.8 million on June 30, 2026—representing eight basis points of total assets—after an increase of $10.5 million during the second quarter. Classified loans totaled $109.7 million, or 0.91% of total loans, with $29 million of that increase stemming from acquired Heritage accounts. Net charge-offs for the quarter were $137,000, and the bank recorded zero provision for credit losses.6 For the full year 2025, CVB recorded a $3.5 million credit loss recovery alongside net recoveries.1
Economic provisioning models reflect a conservative economic outlook. CVB builds its credit loss allowances using blended Moody's economic scenarios. As of June 30, 2026, those models assumed real GDP growth below 2% through 2027, unemployment rising to 5% in early 2027 and remaining elevated through 2028, and commercial property prices declining through year-end 2027 before recovering in 2028.6 The allowance for credit losses represented 1.05% of total loans following the Heritage merger, up from 0.93% at March 31, 2026—an increase driven primarily by accounting reserve requirements on acquired portfolios rather than organic credit deterioration.6
Verdict: Commercial real estate concentration remains a structural balance-sheet risk, though current loss rates remain low. The critical risk indicator is whether pre-2021 office loan maturities drive an increase in classified loans as debt contracts reprice over the next two to three years.
VIII. Strategic Analysis: 7 Powers & Porter's 5 Forces
A comprehensive strategic evaluation requires examining the defensive barriers protecting CVB's commercial banking franchise against well-capitalized competitors.
Hamilton Helmer's 7 Powers, applied honestly
Process Power — strong, and partially verifiable. The principal evidence is expense discipline: non-interest expense stood at 1.54% of average assets in 2025, and the adjusted efficiency ratio reached 43.88% in the second quarter of 2026 while integrating the Heritage Commerce acquisition.13 Decades of focused underwriting and lean operations produce habits that competitors cannot easily duplicate. However, process power faces margin pressure from shifting funding dynamics, as the 2025 efficiency ratio expanded by more than seven percentage points compared with 2022.
Switching Costs — strong, and the primary moat. Switching friction in core operating accounts serves as the bank's primary competitive defense, as supported by multi-decade deposit tenure. A clear boundary emerged in 2023: when the interest rate spread widened significantly, approximately $800 million shifted out of bank deposits. Notably, those funds moved primarily into the institution's internal trust division to purchase Treasury securities rather than leaving for a rival bank, demonstrating that operational ties remained intact even as rate sensitivity capped deposit retention.
Cornered Resource — moderate. Specialized dairy and agribusiness lending teams, along with multi-decade regional relationships across Chino, Fresno, Visalia, and Bakersfield, represent key commercial assets. Because this is a human-capital resource rather than a contractual lock, it remains vulnerable to industry turnover. On a first-quarter 2026 earnings call, Chief Executive Officer David Brager noted that the bank used a targeted approach to recruit talent from disrupted competitors, highlighting that industry personnel shifts flow in both directions.7
Scale Economies — moderate, and newly improved. The Heritage transaction provided a clear example of scale benefits: Brager noted that CVB's legal lending limit is approximately two and a half times larger than Heritage's prior limit, allowing the combined institution to retain full credit relationships that Heritage previously had to syndicate to peer banks.6 Conversely, with approximately $21 billion in total assets, CVB remains substantially smaller than regional peers such as East West Bancorp or Western Alliance Bancorporation. Technology investments present an expanding fixed cost where larger institutions hold a structural advantage, as demonstrated by a 20% year-over-year increase in CVB's software expenses during the first quarter of 2025.8
Counter-Positioning — weak. The business model does not rely on counter-positioning, as incumbents face no structural penalty or business-model conflict in attempting to replicate CVB's balance sheet. Competitors actively seek zero-cost operating deposits; CVB's advantage reflects long-term operational execution rather than a business model that rivals are disincentivized to copy.
Network Effects — absent. Commercial banking offers no direct network effects, as individual commercial deposit and lending relationships function independently without adding utility to other clients.
Branding — moderate, and weaker than the story suggests. While historical deposit data refutes claims that the bank received net deposit inflows during the 2023 regional banking stress, brand equity aids client acquisition. Brager noted on a first-quarter 2026 earnings call that the bank frequently wins new commercial relationships from major national institutions.7 Brand reputation also supported acquisition dynamics, with Heritage's chief executive publicly citing CVB's standing as a top-performing business bank when announcing the merger.4
Porter's Five Forces
Threat of new entrants: low. De novo banking charters in California remain rare due to stringent capital requirements and regulatory oversight. More importantly, new entrants cannot quickly replicate multi-decade commercial operating relationships, which require years of operational integration rather than upfront capital deployment.
Bargaining power of depositors: rising, and this is the force that matters. Deposit migration data from 2023 through 2025 underscores increasing rate sensitivity among corporate treasurers, who maintain ready access to Treasury bills and money market instruments. In response, management has maintained a strategy of competing on service and total relationship value rather than offering competitive deposit rates, accepting the runoff of rate-sensitive balances.6 While this preserves deposit discipline, it constrains total balance-sheet growth during periods of elevated interest rates.
Bargaining power of capital suppliers: low but not zero. CVB maintains access to Federal Home Loan Bank advances, Federal Reserve credit facilities, and institutional funding markets. However, liquidity events in 2023 demonstrated that wholesale emergency facilities carry significantly higher borrowing costs—such as 4.78% on Bank Term Funding Program advances compared with baseline deposit costs measured in basis points.9 Consequently, wholesale liquidity functions as an operational buffer rather than a sustainable funding strategy.
Threat of substitutes: moderate and structural. Money market mutual funds, direct Treasury securities, and automated corporate cash management tools provide viable alternatives to uncompensated bank deposits. This structural shift in corporate cash management represents an ongoing challenge to maintaining historical non-interest-bearing deposit ratios.
Rivalry: high, and intensifying. Competition across California commercial banking is intensifying. On a first-quarter 2026 earnings call, Brager highlighted expanding activity from national and regional institutions, including Wells Fargo, Columbia Banking System, Fifth Third Bank, and BMO.7 Although management characterized market conditions as consistent with historical cycles, aggressive loan pricing for prime commercial borrowers reduced average loan origination yields by approximately 25 basis points quarter-over-quarter to roughly 6% in early 2026, even as Treasury yields rose.7
The war game
Consider a scenario where a major regional competitor, such as Fifth Third or BMO, attempts to build CVB's Inland Empire commercial franchise from scratch. Capital is not the limiting constraint, as larger institutions can fund expansion from cash flow. Branch locations can be leased, relationship managers can be recruited, and modern technology platforms can be acquired.
What the competitor cannot buy is operational tenure inside client businesses. Converting a middle-market enterprise's primary operating account requires persuading corporate officers to reconfigure payroll networks, ACH origination, positive-pay security, lockbox services, and enterprise accounting integrations for an unproven local partner. The primary incentive an entrant can offer to overcome that operational friction is interest yield, which undermines the very objective of securing zero-cost funding. The cost of winning the account degrades the financial value of the deposit.
This structural asymmetry forms the core of CVB's competitive moat, explaining why major California commercial banks have rarely achieved a non-interest-bearing deposit ratio exceeding 50% in these markets. However, this defense has clear limits: while switching friction protects against competitor poaching, it does not prevent corporate treasurers from independently moving idle operating cash into yield-bearing Treasury instruments. The primary threat to funding costs is not rival bank recruitment, but automated cash management.
In summary, CVB's franchise rests on switching costs in commercial operating deposits, supported by disciplined expense control. While both advantages remain measurable, elevated interest rates and corporate cash alternatives continue to exert steady pressure on the bank's low-cost funding base.
IX. Primary Evidence & Conference Call Synthesis
Reviewing three years of CVB earnings calls reveals a consistent pattern: the prepared remarks are standardized, while the main analytical insights surface during the executive Q&A.
What management chooses to lead with
The scripted portion of every call follows a predictable sequence—consecutive quarters of profitability, consecutive quarters of dividends, followed by loan volume, deposit trends, and operating expenses. Credit metrics are volunteered proactively rather than drawn out by analysts, and they are shared in granular detail. On the second-quarter 2026 call, before analysts inquired, management disclosed the exact non-performing asset figure, the exact classified loan figure, the portion of the classified loan increase attributable to acquired Heritage credits, and the $137,000 in net charge-offs.6 A quarter earlier, Chief Executive Officer David Brager detailed an individual downgraded commercial-and-industrial credit, identifying the borrower's industry, noting that the client's primary customer had entered bankruptcy, and explaining that the bank had "shored up our collateral position."7
Proactive granularity of this nature functions as a credibility signal. A lender that itemizes problem loans before being prompted operates differently from one that obscures asset quality behind aggregate ratios. Given the 2010 SEC inquiry, this transparent disclosure practice reflects an institutional lesson learned from past credit concentration challenges.
Where analysts push
Three core operational themes consistently draw sell-side scrutiny.
The cost-save timeline. Piper Sandler analyst Matthew Clark and D.A. Davidson analyst Gary Tenner both pressed executives on how much of the expected Heritage expense synergies were reflected in current run rates. Chief Financial Officer Allen Nicholson provided a detailed sequence while declining to offer a single quarterly estimate, indicating that initial savings would emerge in the third quarter, followed by a cleaner run rate in the fourth quarter, with 90% to 95% of promised savings realized by year-end and full realization at the start of 2027.6 This provides a clear benchmark for evaluating integration execution.
The margin floor. Stephens analyst Andrew Terrell asked for explicit guardrails on the third-quarter net interest margin. Rather than providing a specific target, Nicholson provided analysts with the underlying modeling inputs—highlighting the disclosed base loan coupon of 5.37% excluding purchase accounting accretion, the investment portfolio runoff schedule, point-in-time deposit costs, and the updated interest-rate-risk disclosures in the investor presentation.6 Three months earlier, when pressed on the same topic, Nicholson had stated it was "a little bit too early."7
This response pattern illustrates CVB's financial reporting philosophy. The institution refrains from providing formal forward guidance. Instead, management responds to forecasting inquiries by expanding underlying data disclosures rather than issuing point estimates. For investors seeking empirical inputs, this approach offers transparency; for those seeking explicit quarterly forecasts, it remains a point of friction—explaining why the stock has historically been valued on demonstrated historical returns rather than management projections.
Whether the deal targets are beatable. Terrell also raised a structural question: with second-quarter operating returns approaching the bank's 1.50% return-on-assets goal, could management realistically achieve its 17% return-on-tangible-common-equity target given the institution's substantial capital base? Brager acknowledged the underlying dynamic, noting that the bank generates substantial capital—which he characterized as "a good problem to have"—and identified share repurchases and dividend adjustments as the primary capital deployment levers. Nicholson added a more measured perspective, noting that achieving the target return on tangible common equity "maybe takes a little bit more time because there's more moving parts."6
This exchange highlights a central balance-sheet question. With a common equity Tier 1 ratio of 14.7% and a tangible common equity ratio of 9.8% following a major acquisition, CVB maintains a capital level well above regulatory minimums and peer averages.6 This capital depth arithmetically compresses equity returns: return on average equity stood at 6.41% in the second quarter of 2026, while return on average tangible common equity reached 10.85%—with both metrics suppressed by $31.4 million in transaction expenses and a $4.25 million credit provision for unfunded commitments.3 Even when normalizing for merger-related charges, management's path toward higher return targets requires expanding share repurchases, raising cash dividends, or deploying excess capital into further acquisitions.
The deleveraging, explained in real time
The multi-quarter balance-sheet repositioning across 2024 and 2025 provides clear evidence of management's capital discipline. After relying on the Bank Term Funding Program during the 2023 regional banking stress, CVB systematically reduced wholesale liabilities in the second half of 2024. Total borrowings dropped by $1.5 billion year-over-year, and brokered certificates of deposit declined by $100 million, leaving wholesale funding at $300 million in swapped brokered CDs and $500 million in Federal Home Loan Bank advances by the first quarter of 2025.8 Management framed this deleveraging as a deliberate margin optimization strategy—sacrificing lower-yielding earning assets to eliminate high-cost borrowing—and financial results confirmed the thesis: net interest margin expanded by 13 basis points in the first quarter of 2025, a shift Brager attributed directly to the deleveraging.8
The timing of management's communication underscores its credibility. Executives detailed the strategic rationale prior to margin expansion rather than offering post-hoc explanations. On that same call, Nicholson noted that management's willingness to execute securities-loss repositioning trades remained unchanged, though he anticipated no immediate transactions absent market shifts that would allow the firm to harvest losses.8 CVB subsequently executed this strategy, recording $11.0 million in securities losses in 2025—a fraction of the $28.3 million realized in 2024.1 This measured execution demonstrates how management aligns operational actions with stated balance-sheet strategies.
What analysts do not ask
Equally revealing are the operational areas that attract minimal sell-side inquiry. Across three years of transcripts, analysts rarely probed the concentration of specialty banking deposits within title, escrow, and property management accounts—even as that category expanded into the largest industry concentration in the deposit base. Similarly, sell-side questions bypassed the omission of explicit credit-quality metrics within the chief executive officer's annual compensation framework. Wall Street commentary focuses predominantly on near-term net interest margins and integration expense saves—metrics that drive quarterly financial models—rather than structural deposit composition or long-term credit governance.
Narrative consistency, tested
A detailed review of regulatory disclosures reveals subtle shifts in corporate framing over time. In its 2023 annual report, CVB stated that its deposits consisted of "100% relationship based core deposits and customer repurchase agreements," emphasizing that the institution maintained "zero brokered deposits throughout 2023."9 However, year-end filings for 2024 and 2025 disclosed $300 million in brokered certificates of deposit before management eliminated them again in the second quarter of 2026.16 While $300 million is small relative to a $17 billion deposit base, the shift reflects a minor departure from strict core deposit messaging, as formal reporting language adjusted from "100% relationship based" to "primarily relationship based."1
Tracking these subtle language adjustments provides valuable insight for long-term investors. The temporary inclusion of wholesale certificates of deposit did not impair liquidity, but it demonstrates how prolonged elevated interest rates tested even highly disciplined deposit franchises.
X. Risk Radar & Bull vs. Bear Case
What could actually go wrong
Commercial real estate repricing. The primary mechanism is not immediate default on active loans, but maturity risk. Roughly 47% of the office portfolio was originated prior to 2021, reflecting rental rates and capitalization metrics that no longer hold.1 As these obligations reach maturity or rate-reset dates, borrowers face a choice between contributing additional equity or surrendering collateral. Low origination loan-to-value ratios and modest average loan sizes provide meaningful downside protection—a 55% LTV offers substantial loss absorption—yet the company's internal economic modeling projects commercial real estate values declining through 2027.6 Consequently, classified loans, rather than net charge-offs, serve as the primary early-warning indicator of credit stress.
Continued deposit migration. If the non-interest-bearing deposit share continues its multi-year contraction, the institution's funding cost advantage will steadily converge toward peer averages, driving a corresponding rise in the efficiency ratio. This risk represents an incremental arithmetic drag rather than a sudden liquidity shock.
Regulatory step-up, correctly sized. The principal regulatory milestone in U.S. commercial banking occurred at the $10 billion asset threshold, which CVB crossed in 2018.12 Expanding past $20 billion in 2026 does not trigger a comparable statutory regime, as higher supervisory tiers remain well above current asset levels. A more material regulatory transition was internal and structural: on December 15, 2025, Citizens Business Bank converted to a national bank charter, shifting primary federal supervision to the Office of the Comptroller of the Currency.1 That national charter conversion represented a deliberate decision with ongoing examination and preemption implications, taking place just two days prior to announcing the Heritage merger.
California concentration. The entire franchise remains concentrated in a single state, exposing operations to California's tax environment, regulatory policies, business formation trends, and physical environmental risks. CVB's public disclosures explicitly cite earthquakes, drought, climate change, and severe weather as potential threats to assets, customers, and operations.4 For example, management discussed the January 2025 Southern California wildfires during its first-quarter earnings call, noting that the event generated construction lending demand while simultaneously inflating material costs.8
Execution risk on the merger. The Heritage integration was completed rapidly, trading short-term conversion risks for accelerated cost savings. Although management reported a smooth conversion and noted that inherited Heritage credit exposures were marked appropriately, acquired loan books historically reveal latent credit issues over a two-to-three-year window rather than during initial post-close quarters.6
Myth versus reality
Three widespread consensus narratives surrounding CVB do not survive contact with regulatory filings, and each carries direct implications for how the business is valued.
Myth: CVB was a safe-haven winner in the March 2023 regional-banking panic, gaining deposits as depositors fled weaker banks. Reality: Total deposits and customer repurchase agreements ended 2023 down $1.7 billion year-over-year, requiring the bank to plug the funding shortfall with $1.91 billion in Bank Term Funding Program advances.9 While CVB navigated the industry disruption without operational distress, empirical balance-sheet data shows it did not capture net deposit inflows during the crisis.
Myth: crossing the $10 billion asset threshold in 2018, and Durbin interchange caps, structurally impaired the expense model. Reality: While the efficiency ratio rose roughly two percentage points during the 2018 integration year, it improved to 40.16% in 2019—its lowest level in a decade—alongside a 1.84% return on average assets.11 Regulatory compliance added permanent overhead, but filing data demonstrates that crossing the asset mark did not impair the core operating model.
Myth: the SEC formally cleared CVB of wrongdoing in the loan-loss investigation. Reality: In early 2015, CVB disclosed that it had not received communications from the SEC regarding the inquiry since October 2011 and could not determine whether the investigation remained active.14 Although the regulator filed no enforcement action and the bank issued no earnings restatements, the inquiry lapsed into silence rather than concluding with formal regulatory exoneration. The associated shareholder class action subsequently settled for $6.2 million in 2016, funded entirely by insurance proceeds.16
The bull case, stated fairly
The investment thesis for CVB rests on its ability to generate high returns without incurring elevated asset risk, driven by a low-cost deposit structure that peers cannot match. With a non-interest-bearing deposit mix roughly double that of East West Bancorp, an adjusted efficiency ratio in the low forties even during integration quarters, and 197 consecutive quarters of profitability spanning multiple economic cycles, the company's operational discipline is supported by decades of financial results.253 If management realizes its projected synergies, the Heritage acquisition expands this commercial model into major Bay Area markets while deploying equity priced at a premium valuation. Furthermore, capital reserves remain robust, asset quality stays sound—with non-performing assets at eight basis points of total assets—and consistent internal capital generation provides management with flexibility for ongoing capital deployment.6
The bear case, stated equally fairly
The counter-argument does not anticipate structural failure, but rather the gradual erosion of the bank's competitive moat. Non-interest-bearing deposits have declined as a share of funding in four consecutive years, driving a seven-percentage-point increase in the efficiency ratio over the same period, while liquidity events in 2023 demonstrated that widening yield spreads cause even relationship deposits to migrate into 4.78% wholesale borrowing replacements.9101 Simultaneously, loan portfolio concentration in commercial real estate has expanded into a market where internal economic models project declining property values through 2027.16 Additionally, franchise growth relies increasingly on acquisitions that dilute the core funding mix, with the Heritage transaction reducing the non-interest-bearing deposit ratio by six percentage points.36 Governance considerations further reinforce caution: the chief executive officer's 2025 annual bonus formula contained no explicit credit-quality metric despite heavy commercial real estate exposure, while share repurchases executed at nearly twice tangible book value conflict with management's stated valuation discipline at 1.7 times tangible book a year prior.2186
Weighing it
Financial history does not disprove CVB's moat thesis; rather, it refines its scope. CVB possesses a durable, slowly repricing funding advantage anchored by operational switching costs—maintaining a non-interest-bearing deposit ratio roughly double the peer average and demonstrating resilience across full interest rate cycles—rather than an immune, zero-cost liability base. Its efficiency advantage is real but functions as a direct derivative of low-cost funding rather than an independent competitive pillar. Finally, while overall asset quality remains strong, the credit record reflects one notable historical failure involving a concentrated borrower relationship sixteen years ago under prior leadership.
The three KPIs that matter
Non-interest-bearing deposits as a percentage of total deposits. This metric measures the strength of the deposit moat directly. Investors should monitor it quarterly on an organic basis, excluding the initial mix dilution of acquisitions. Continued erosion at recent rates narrows the long-term investment case, whereas stabilization confirms the durability of operating account switching costs.
The efficiency ratio, adjusted for acquisition expense. This metric tracks how effectively low-cost funding translates into bottom-line profitability. Management's historical performance targets the low-to-mid forties percentage range; a sustained rise above that level would indicate that cost pressures are eroding operational discipline alongside deposit margins.
Classified loans as a percentage of total loans. Classified loans serve as the primary early-warning indicator for credit deterioration. Net charge-offs represent a lagging metric, while non-performing assets—standing at eight basis points—offer minimal forward-looking signal. Because classified loans are disclosed quarterly and commercial real estate represents three-quarters of the loan portfolio, this metric provides the earliest measure of credit stress.
XI. Playbook & Investing Lessons
Lesson 1: In banking, the moat is on the liability side. This is the central transferable insight. Most bank investors focus on the loan portfolio because that is where credit risk is visible and where management directs narrative attention. Yet lending is largely a commodity: commercial banks across California can originate similar commercial real estate loans at comparable spreads, while institutions reaching for higher yield typically take on commensurate risk. What remains distinct is a deposit structure that maintained an average funding cost of 0.88% when policy rates exceeded 4%.1 An institution with lower funding costs can afford to reject higher-risk loans that competitors must accept. Deposit costs and non-interest-bearing deposit ratios are not secondary metrics—they define the core economic model.
Lesson 2: Depth in a niche beats breadth across a market. CVB has consistently avoided operating as a universal bank, foregoing retail consumer lending, credit cards, and investment banking. Instead, the institution focused on middle-market California owner-operators generating between $1 million and $50 million in annual revenue, structuring products around their specific operating cash cycles: treasury management, trade services for importers, seasonal agricultural credit lines, and escrow deposit services for title firms. Specializing in a defined commercial segment builds relationship stickiness and pricing leverage that broad market coverage rarely achieves. However, the balance-sheet offset is equally direct: deep niche focus creates geographic and asset concentration, leaving the bank heavily exposed to California commercial real estate.
Lesson 3: Culture is a hypothesis, not a fact — check it against the filings. The founding operating discipline is evident in practice: mandatory operating accounts, disciplined deposit pricing, a 5.7% founding family equity stake, and an executive compensation structure that explicitly rewards the chief executive officer for maintaining average non-interest-bearing deposit balances.21 However, regulatory and financial disclosures reveal notable exceptions: the bank extended fresh credit to a delinquent borrower in 2009 while asserting there was no serious doubt regarding repayment,17 and management later adjusted its deposit messaging from "100% relationship based"9 to "primarily relationship based" when utilizing $300 million in brokered certificates of deposit.1 Corporate culture at CVB has demonstrated unusual continuity relative to banking peers, but qualitative narrative remains a hypothesis that requires continuous verification against regulatory filings.
Lesson 4: A premium equity multiple is a strategic asset, but it carries structural trade-offs. CVB's acquisition strategy succeeded over the past decade because its stock traded at a higher multiple of tangible book value than its target institutions, enabling all-stock or stock-heavy transactions without long-term per-share dilution. Acquiring Community Bank in 2018 expanded the franchise into Los Angeles at a temporary two-percentage-point increase in the efficiency ratio.11 Similarly, the 2026 Heritage Commerce transaction added Bay Area market presence while projecting 7.7% tangible book value dilution with an estimated 2.5-year earn-back period.4 Both transactions capitalized on CVB's premium valuation currency. However, this strategy involves an implicit trade-off: each acquired institution brings a deposit base with a higher funding cost than CVB's legacy franchise, diluting the non-interest-bearing deposit ratio that generated the premium valuation multiple in the first place. Resolving this strategic tension depends on whether management achieves its projected earnings accretion and return targets through 2027.
A closing methodological note. CVB Financial Corp. serves as an instructive case study in fundamental analysis because its core financial dynamics can be evaluated almost entirely through primary disclosures. Every central analytical variable—deposit composition trends, office loan-to-value ratios, wholesale borrowings during the 2023 banking stress, executive compensation incentives, and securities litigation timelines—is documented in annual reports, proxy statements, SEC filings, and judicial opinions. The institution's public record provides the empirical evidence for both the optimistic thesis and its key counterarguments, offering a clear framework for evaluating long-term bank performance.
XII. Epilogue & Outro
Fifty-two years after a group of local Chino business owners chartered the bank because money-center institutions declined to serve them, the company operates across California's major economic hubs—spanning Los Angeles, Orange County, the Inland Empire, the Central Valley, Sacramento, and the Bay Area—through more than 75 banking centers and three trust offices.3 It has recorded profitability in every one of the 197 quarters it has reported and paid a cash dividend in 147 consecutive quarters.3 Those performance streaks summarize the institution's historical profile: prioritizing low-cost funding stability over rapid balance-sheet expansion or peak single-year returns.
The company's near-term outlook rests on specific management targets. Executives have committed to delivering more than 13% earnings-per-share accretion in 2027 from the Heritage Commerce merger, alongside a 1.50% return on average assets and a 17% return on tangible common equity.6 Management also projects that cost savings from the integration will be substantially complete by the fourth quarter of 2026.6 Alongside these near-term operational milestones lies a broader structural test: whether the bank's proportion of non-interest-bearing deposits stabilizes in the low 50% range or continues moving toward peer averages.
The integration commitments will be evaluated over the next several quarters, but the long-term trajectory of the deposit base presents the deeper strategic test. For an institution built around uncompensated operating balances, the durability of its zero-cost funding base will determine the ultimate value of its expanded geographic footprint.
References
-
CVB Financial Corp. Annual Report on Form 10-K for the year ended December 31, 2025 — U.S. Securities and Exchange Commission, 2026-02-27 ↩↩↩↩↩↩↩↩↩↩↩↩↩↩↩↩↩↩↩↩↩↩↩↩↩↩↩↩↩↩↩↩↩↩↩↩↩↩↩↩↩↩↩↩↩
-
CVB Financial Corp. Reports Earnings for the Second Quarter 2026 (Form 8-K, Exhibit 99.1) — U.S. Securities and Exchange Commission, 2026-07-22 ↩↩↩↩↩↩↩↩↩↩↩↩
-
CVB Financial Corp. and Heritage Commerce Corp Announce Agreement to Merge (Form 8-K, Exhibit 99.1) — U.S. Securities and Exchange Commission, 2025-12-17 ↩↩↩↩↩↩
-
CVB Financial Corp. Announces Completion of Merger with Heritage Commerce Corp (Form 8-K, Exhibit 99.1) — U.S. Securities and Exchange Commission, 2026-04-17 ↩↩
-
Earnings call transcript: CVB Financial Q2 2026 — Investing.com, 2026-07-23 ↩↩↩↩↩↩↩↩↩↩↩↩↩↩↩↩↩↩↩↩↩↩↩↩↩↩↩↩↩↩↩↩
-
CVB Financial (CVBF) Q1 2026 Earnings Transcript — The Motley Fool, 2026-04-23 ↩↩↩↩↩↩↩↩
-
Earnings call transcript: CVB Financial Q1 2025 — Investing.com, 2025-04-24 ↩↩↩↩↩↩↩↩↩↩↩↩↩
-
CVB Financial Corp. Annual Report on Form 10-K for the year ended December 31, 2023 — U.S. Securities and Exchange Commission, 2024-02-28 ↩↩↩↩↩↩↩↩↩↩↩↩↩↩
-
CVB Financial Corp. Annual Report on Form 10-K for the year ended December 31, 2022 — U.S. Securities and Exchange Commission, 2023-02-28 ↩↩↩↩↩
-
CVB Financial Corp. Annual Report on Form 10-K for the year ended December 31, 2020 — U.S. Securities and Exchange Commission, 2021-03-01 ↩↩↩
-
CVB Financial Corp. Annual Report on Form 10-K for the year ended December 31, 2018 — U.S. Securities and Exchange Commission, 2019-03-01 ↩↩↩↩↩↩
-
CVB Financial Corp. Annual Report on Form 10-K for the year ended December 31, 2013 — U.S. Securities and Exchange Commission, 2014-03-03 ↩↩↩
-
CVB Financial Corp. Annual Report on Form 10-K for the year ended December 31, 2014 — U.S. Securities and Exchange Commission, 2015-03-02 ↩↩↩
-
CVB Financial Corp. Annual Report on Form 10-K for the year ended December 31, 2015 — U.S. Securities and Exchange Commission, 2016-02-29 ↩↩↩
-
CVB Financial Corp. Annual Report on Form 10-K for the year ended December 31, 2016 — U.S. Securities and Exchange Commission, 2017-03-01 ↩↩
-
Lloyd v. CVB Financial Corp. (Jacksonville Police and Fire Pension Fund v. CVB), No. 13-56838, Opinion — U.S. Court of Appeals for the Ninth Circuit, 2016-02-01 ↩↩↩↩↩↩
-
CVB Financial Corp. CFO Postpones Retirement (Form 8-K, Exhibit 99.1) — U.S. Securities and Exchange Commission, 2010-08-12 ↩
-
CVB Financial Corp Announces Acquisition of San Joaquin Bank (Form 8-K, Exhibit 99.1) — U.S. Securities and Exchange Commission, 2009-10-16 ↩
-
CVB Financial Corp. Announce Completion of the Merger with Suncrest Bank (Form 8-K, Exhibit 99.1) — U.S. Securities and Exchange Commission, 2022-01-07 ↩
-
CVB Financial Corp. 2026 Proxy Statement (Schedule 14A) — U.S. Securities and Exchange Commission, 2026-04-07 ↩↩↩↩↩↩↩↩↩
-
CVB Financial Corp. Form 8-K, Item 5.07 — Results of 2026 Annual Meeting of Shareholders — U.S. Securities and Exchange Commission, 2026-05-22 ↩
-
CVB Financial Corp. Announces Appointment of New Director (Form 8-K, Exhibit 99.1) — U.S. Securities and Exchange Commission, 2026-07-22 ↩
-
CVB Financial Corp. Form 8-K, Item 5.02 — Retirement of General Counsel — U.S. Securities and Exchange Commission, 2026-05-26 ↩
-
East West Bancorp, Inc. Quarterly Report on Form 10-Q for the quarter ended June 30, 2026 — U.S. Securities and Exchange Commission, 2026-08 ↩↩
-
George A. Borba Jr., Board of Directors — Citizens Business Bank ↩
-
CVB Financial Corp. Annual Report on Form 10-K for the year ended December 31, 2010 — U.S. Securities and Exchange Commission, 2011-03-01 ↩
 LinkedIn
 WhatsApp
 Reddit
 Hacker News
 Email
Email Kindle
 RSS Feed
 Spotify
 Apple Podcasts
 Amazon Music
 Audible
 YouTube