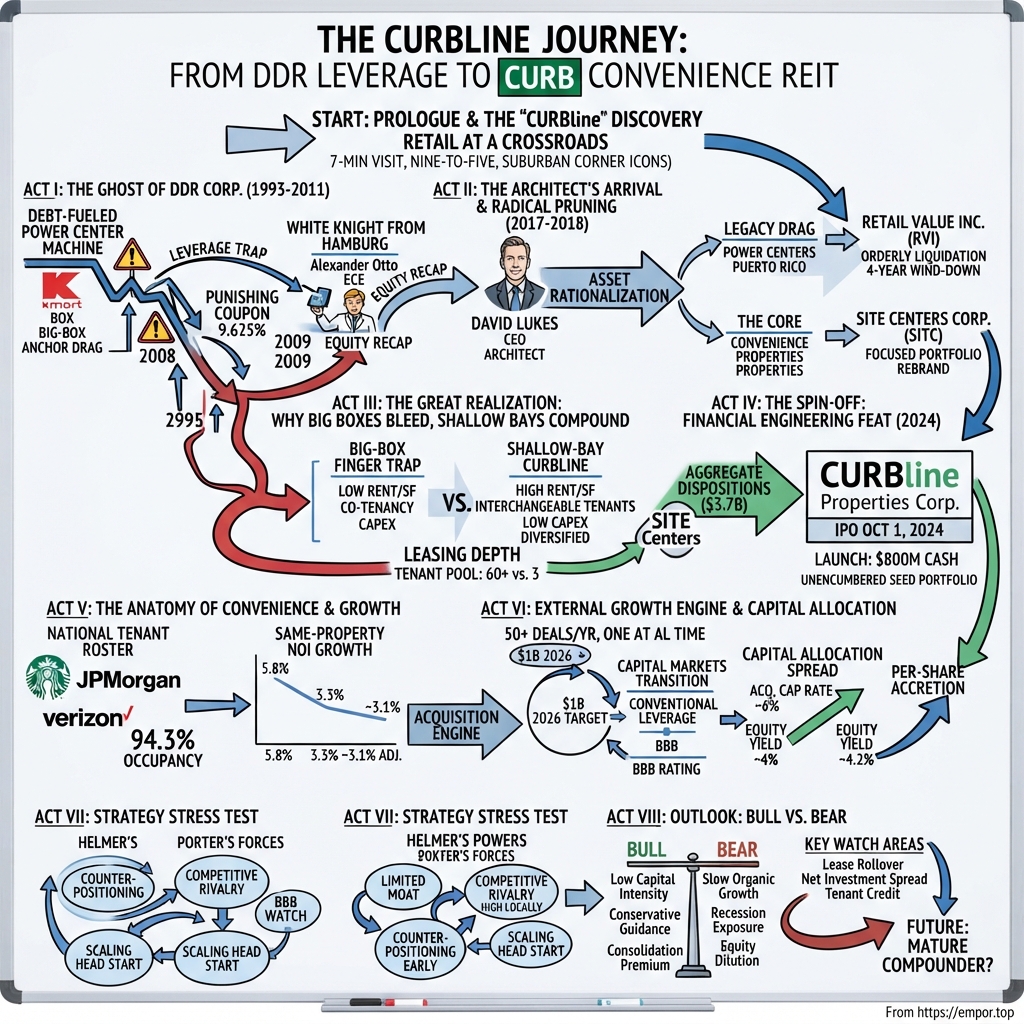
Curbline Properties Corp. (NYSE: CURB): The First Pure-Play Convenience REIT
I. Prologue & The "Curbline" Discovery (0:00 – 0:18)
A Spin-Off That Arrived With a Suitcase of Cash
Picture the corner of a busy suburban intersection in Atlanta, Phoenix, or Dallas at 7:40 on a Tuesday morning. A line of cars snakes into a drive-thru. A nurse in scrubs darts out of a coffee shop. Next door, a phone store pulls up its security gate, and a few storefronts down a dental clinic turns on its lights. Almost nobody in those cars is thinking about commercial real estate; they are thinking about the next seven minutes of their morning routine.
On October 1, 2024, a company built entirely around those seven-minute visits began trading on the New York Stock Exchange under the ticker CURB. SITE Centers Corp. completed the spin-off of Curbline Properties Corp. that day, distributing roughly 104.9 million shares by granting stockholders two Curbline shares for every SITE Centers share held.12
Corporate spin-offs often arrive encumbered by parent-company debt, non-core assets, or legacy liabilities. Curbline launched under the opposite arrangement. SITE Centers transferred a clean portfolio of 79 convenience properties spanning roughly 2.7 million square feet, funded with $800 million in unrestricted cash, a $400 million undrawn revolving credit line, a $100 million delayed-draw term loan, and zero debt.13
For a real estate investment trust, this was an unconventional capital structure. REITs typically rely on financial leverage to amplify mid-single-digit property yields into competitive equity returns. Curbline began its public life in a substantial net cash position, operating more like a private equity buyout fund that had already acquired its seed portfolio.
The Contrarian Corner of Retail
The premise challenged prevailing market consensus. For over a decade, retail real estate had been associated with secular headwinds: e-commerce encroachment, declining foot traffic in enclosed malls, and recurring anchor-tenant insolvencies. Curbline's management argued that unanchored convenience centers had demonstrated different economic characteristics. These roadside strip centers—positioned directly along major arterial roadways—house service-oriented tenants such as quick-service restaurants, banks, wireless carriers, medical practices, and personal care salons.
In its initial quarterly filing, Curbline identified itself as "the first publicly traded real estate investment trust focused exclusively on the convenience real estate sector," pointing to a fragmented national landscape of more than 68,000 properties totaling roughly 950 million square feet, with over $41 billion in convenience assets traded between 2019 and 2023.3
The Strategic Gambit
The strategic question is as much operational as it is financial. Chief Executive David Lukes and his leadership team had spent seven years managing a multi-billion-dollar shopping center REIT. They deliberately liquidated SITE Centers' large-format power centers and grocery-anchored properties to concentrate their operational capital on roadside parcels that often house fewer than a dozen tenants. The move represented a conscious pivot away from institutional scale toward small-format commercial real estate.
The rationale reflects three decades of commercial property cycles. The narrative originates with an Ohio-based developer that assembled a national power-center portfolio, faced severe distress during the 2008 financial crisis, and secured an equity recapitalization from a European retail real estate group. It continued under Lukes's leadership, which executed an extensive portfolio rationalization to deleverage the balance sheet, culminating in a corporate spin-off structured specifically to mitigate debt risk.
The Roadmap
This analysis evaluates five fundamental questions. First, how did the near-collapse of Developers Diversified Realty reshape the organization's approach to financial leverage? Second, how did Lukes re-engineer the balance sheet through asset sales and capital recycling? Third, do unanchored, shallow-bay retail footprints generate structurally superior cash-flow economics relative to big-box formats? Fourth, can an institutional public operator assemble fragmented, privately held roadside properties at attractive risk-adjusted returns? Fifth, applying Hamilton Helmer's 7 Powers and Michael Porter's Five Forces, does the convenience REIT model possess sustainable competitive advantages?
The evaluation contrasts executive claims with reported operational performance. Having accumulated nearly two years of operating history as an independent public entity, Curbline offers empirical data to test management's initial underwriting, even as its long-term performance across a complete macroeconomic cycle remains to be proven.
Understanding why Curbline launched without debt requires examining what occurred when its predecessor operated with too much of it.
 Subscribe on LinkedIn
II. Act I: The Ghost of DDR Corp. — Power Centers, Leverage, and the German Rescue (0:18 – 0:42)
Kmart Boxes and a Family Empire
Curbline's corporate lineage traces back to Bert Wolstein, a Cleveland-area builder who started with single-family homes in 1959 and expanded into commercial real estate in 1965.4 Wolstein anchored his early commercial growth to a single dominant tenant: beginning in 1967, he built Kmart stores, and by 1987 his shopping centers spanned 32 states with an estimated value of roughly $700 million.4 When Kmart's retail dominance waned in the late 1980s, he shifted his development focus toward Walmart.
That early pattern established an operational vulnerability that would challenge the company for decades. The landlord's cash flows were tied directly to whichever big-box retailer happened to lead the sector. When the anchor flourished, customer foot traffic lifted the entire center. When the anchor stumbled, the property owner was left with an oversized, specialized box and a dwindling stream of shoppers.
The 1993 IPO and the Power-Center Machine
In February 1993, Developers Diversified Realty went public at $22 per share, raising $176 million to acquire about 50 shopping centers from the family's development business.4 Bert's son, Scott Wolstein, co-founded the public REIT, led the initial public offering, and served as its chief executive from the start.5
The operating model was straightforward: acquire and develop large open-air shopping centers anchored by national big-box retailers, flanked by small-shop inline tenants that fed off the anchor's foot traffic. It captured the 1990s suburban retail boom. DDR expanded rapidly through debt-financed acquisitions, purchasing JDN Realty for $1 billion in 2002 and Benderson Development's portfolio in 2004 for $1.5 billion plus $800 million of assumed debt.4 By 2004, the company owned more than 450 centers across 44 states.4 By the time Scott Wolstein stepped down as chief executive in 2011, the company reported that its footprint had expanded from roughly $400 million of mostly Kmart-anchored properties to nearly $18 billion of assets under management across the United States, Puerto Rico, and Brazil.5
This rapid growth was financed through debt and joint-venture structures. While that approach generated attractive returns as long as commercial property valuations rose and credit remained liquid, it left the balance sheet exposed to any sudden contraction in retail spending and capital markets.
2008: The Debt Trap Springs
The 2008 global financial crisis tested both assumptions simultaneously. Consumer spending pulled back, leveraged retail chains fell into insolvency, and the debt refinancing markets DDR relied upon froze.
By September 30, 2009, DDR carried $5.165 billion of consolidated debt, including roughly $826 million drawn on revolving credit facilities, $1.8 billion of unsecured notes, and $2.5 billion of property mortgages.6 To conserve cash while maintaining its REIT tax status, the company paid a portion of its 2009 common dividends in newly issued stock rather than cash.6 That September, it sold $300 million of senior unsecured notes bearing a 9.625% coupon—a punitive borrowing rate reflecting heightened creditor concern.6
Public equity markets reflected the company's precarious position. When DDR negotiated a recapitalization agreement in February 2009, the agreed purchase price of $3.50 per share represented a 33% premium over the February 20 close, indicating that the stock had traded down to roughly $2.63.7 An enterprise that had gone public at $22 per share was priced like an option on its own solvency.
The White Knight From Hamburg
The emergency capital arrived from Germany. Alexander Otto, chief executive of the Hamburg-based commercial developer ECE, structured a recapitalization alongside members of his family.7 In February 2009, DDR agreed to sell the Otto family 30 million common shares for $112.5 million—split evenly at $3.50 per share for the first tranche and $4.00 per share for the second—paired with five-year warrants to acquire 10 million additional shares at $6.00.7 An Otto affiliate also provided a $60 million, five-year secured mortgage loan.7 Combined with their existing equity holdings, the Ottos secured an ownership interest exceeding 20% of the company.7
The rescue required significant accounting and balance-sheet adjustments. DDR subsequently recorded a non-cash charge of $118.2 million on equity derivative valuation adjustments tied to the transaction.6 Contemporary real estate analysts noted that while the equity infusion expanded DDR's common share count by approximately 25%, it provided liquidity rather than a structural deleveraging, functioning as a stopgap that bought time rather than a permanent balance-sheet solution.7
That assessment proved accurate. DDR avoided liquidation, but recovery required substantial equity dilution, disciplined asset sales, and expensive debt restructuring. Executive governance changed in parallel: Scott Wolstein moved from chief executive to executive chairman in early 2010 and stepped down from the board in February 2011, with Daniel Hurwitz assuming the chief executive role and Terrance Ahern becoming chairman.5 Attempting to reset its corporate identity, the company shortened its name to DDR Corp. in 2011.8
Purgatory
The ensuing decade brought no sudden collapse, but rather a prolonged operational restructuring. DDR engaged in recurring portfolio transformation plans, sold off non-core assets, and contended with persistent market skepticism toward big-box retail formats facing growing e-commerce competition.
Through that prolonged repositioning, Otto's presence endured. He continues to serve on Curbline's board today, providing governance continuity from the 2009 recapitalization to the 2024 spin-off.9 In August 2026, Otto reported holding approximately 7.4 million Curbline shares, or a 6.4% equity stake, after selling roughly 535,000 shares in open-market transactions at prices between $29.76 and $30.28 per share.10 While those secondary transactions trimmed his position, the presence of a well-capitalized anchor shareholder who maintained his investment through seventeen years of corporate restructuring provided institutional backing across successive leadership transitions.
For public market investors, Act I provides the foundational context: the predecessor organization's institutional memory was shaped by a balance-sheet crisis born of debt-fueled power-center aggregation. Curbline's launch with zero debt was not an accidental byproduct of financial engineering, but a structural reaction to that history. The critical question was how leadership dismantled that legacy portfolio and engineered the pivot to convenience retail.
III. Act II: The Architect's Arrival — David Lukes & The Radical Pruning (0:42 – 1:08)
An Architect Walks Into a REIT
On March 3, 2017, DDR announced that David Lukes would become president and chief executive, replacing Tom August.11 On the same day, the company appointed Michael Makinen as chief operating officer and Matthew Ostrower as chief financial officer.11
Lukes did not rise through the conventional REIT pipeline of investment banking or pure finance. He trained as a designer, earning a bachelor's degree in environmental design from Miami University, a master of architecture from the University of Pennsylvania, and a master's in real estate development from Columbia University.9 That architectural perspective informed his evaluation of retail real estate: assessing a shopping center first as a physical structure—analyzing bay depth, street frontage, sightlines, and parking circulation—before viewing it as a spreadsheet. Curbline's core investment thesis would ultimately rest on that physical observation about building geometry.
His executive career also provided broad exposure to diverse commercial property models. He spent 2002 to 2010 at Kimco Realty, rising to chief operating officer, and subsequently led Olshan Properties as well as Seritage Growth Properties, an entity managing real estate leased to a struggling Sears. From 2014 to 2017, he served as chief executive of Equity One.911 Across those positions, he managed the country's largest open-air strip portfolio at Kimco, addressed single-tenant department store obsolescence at Seritage, and oversaw grocery-anchored centers at Equity One.
That accumulated operating experience shaped the fundamental question he brought to DDR: which physical components of commercial property preserve their economic value regardless of which retailer occupies them? Focusing on parcel footprint, vehicular access, and street visibility rather than anchor tenancy became the foundation upon which Curbline was eventually constructed.
The Finance Chief From the Buy Side
The other central executive in this transformation was Conor Fennerty. He joined DDR in 2017 as senior vice president of capital markets and was named chief financial officer in November 2019.9 Prior to joining DDR, he spent three years at BlackRock, two years as an analyst at Cohen & Steers, and two years in the equity research division at Goldman Sachs.9
That buy-side background influenced Curbline's capital-allocation framing and investor communication. Having evaluated REIT management teams from the institutional investor's perspective, Fennerty structured corporate commentary around capital sourcing, debt maturity ladders, and cash-flow accretion math rather than broad retail sentiment. In parallel, John Cattonar, who worked alongside Lukes at Seritage and Equity One, joined the leadership group and serves as Curbline's chief investment officer.9 The appointments established an executive team with extensive shared experience navigating commercial real estate cycles across several public platforms.
The Bad-Bank Masterstroke
Lukes's first major corporate move was an asset spin-off that established the structural precedent for Curbline.
DDR held a collection of properties that weighed on its public valuation: continental U.S. strip centers the market viewed as secondary quality, alongside its entire Puerto Rico portfolio, which faced local economic headwinds. Rather than liquidating those assets under distressed market conditions, DDR transferred 50 properties—38 in the continental United States plus the Puerto Rico assets—valued at roughly $3 billion into a separate publicly traded entity named Retail Value Inc.12 The spin-off closed in the summer of 2018, with DDR distributing one share of RVI for every ten DDR shares held.12
RVI operated with a mandate to orderly liquidate its holdings. The company sold its assets incrementally over four years, announced its final major property closing in April 2022, and filed a certificate of dissolution on June 30, 2022.13 Lukes played an active role in managing this wind-down: his Curbline corporate biography lists him as RVI's president and chief executive throughout that process.9
The strategic significance was one of corporate architecture rather than operational expansion. Segregating non-core assets into a self-contained entity with its own debt allowed the parent company to re-rate around higher-quality properties. It also permitted the liquidating vehicle to market assets opportunistically over time rather than conducting a rushed fire sale. Management would later apply that exact mechanism in reverse: instead of spinning off troubled assets, it carved out the roadside convenience properties it considered strongest.
A New Name
Following the RVI spin-off, the parent company rebranded to signal its revised focus. On October 9, 2018, DDR announced it would change its name to SITE Centers Corp., trading under the ticker SITC beginning October 12.8 Lukes stated that the new corporate identity reflected a mission "to drive sustainable growth by owning and investing in high quality communities and locations."8
Myth vs. Reality: Was the Turnaround a Shareholder Triumph?
While market narratives often frame the Lukes era as an uncomplicated turnaround, the operational and share-price record was more nuanced.
On April 30, 2020, as the pandemic disrupted retail operations across the country, SITE Centers announced that its board had suspended the common dividend for the second quarter.14 In August 2024, shortly before completing the Curbline spin-off, SITE Centers carried out a one-for-four reverse stock split.15 Although reverse splits do not change underlying enterprise value, they typically follow prolonged share-price underperformance that leaves a stock trading in an undesirable nominal range.
A measured assessment indicates that Lukes's early years were primarily devoted to dismantling the balance-sheet leverage and property concentration inherited from prior cycles. RVI removed legacy drag, and the rebranding shed a tarnished corporate name. Yet neither step immediately translated into durable per-share compounding for long-term SITE Centers shareholders between 2018 and 2024. Instead, the process established an institutional capability: the management team demonstrated technical proficiency in disassembling, segregating, and monetizing complex real estate portfolios through public structures.
The premise that management routinely generates value through financial engineering requires qualification. The disclosed record shows a team adept at executing intricate corporate separations and orderly asset dispositions. It has yet to demonstrate a long-term record of compounding per-share cash flows within a stable, ongoing operating platform—and Curbline represents the first comprehensive test of that premise.
To understand why leadership determined that long-term value resided in the smallest parcels on the property, it helps to stand in the parking lot of an anchored shopping center and look toward the road.
IV. Act III: The Great Realization — Why Big Boxes Bleed and Shallow Bays Compound (1:08 – 1:35)
The View From the Back of the Parking Lot
From the entrance of a typical grocery-anchored shopping center, the conventional commercial hierarchy seems evident. Toward the rear stands a supermarket spanning 50,000 square feet or more, flanked by a loading dock and deep sales bays. On either side are inline shops, looking out across an expansive parking lot. Along the perimeter, directly adjacent to the arterial roadway, sits a much smaller building: a coffee drive-thru, a bank branch, a wireless store, and a quick-service restaurant.
To a casual observer, the supermarket anchors the real estate while the roadside strip functions as secondary space. The insight David Lukes and his management team drew from decades of managing open-air retail was that across rent per square foot, ongoing capital requirements, and re-leasing friction, that economic relationship is frequently reversed.
The Retail Recovery That Obscured the Problem
Following the 2020 pandemic disruptions, suburban open-air retail recovered faster than many property analysts had anticipated. Hybrid work arrangements anchored foot traffic closer to home throughout the workweek, elevating the daily suburban errand into a primary retail driver. Anchored shopping centers initially benefited from this rebound.
Yet anchor-dependent retail carries structural frictions that headline occupancy rates frequently obscure. Large-format tenants wield substantial bargaining leverage. They typically command low contractual rent per square foot, demand multi-decade lease terms with minimal escalation clauses, and enforce strict co-tenancy and exclusivity covenants limiting which other businesses may operate on the property. When an anchor tenant vacates, the landlord confronts an expensive, protracted repositioning: demising the oversized box, reconstructing facade infrastructure, overhauling mechanical systems, and searching for replacement operators willing to absorb awkward floorplates. The retail sector repeatedly witnessed this dynamic during the early 2020s as chains such as Bed Bath & Beyond liquidated, leaving millions of square feet of specialized big boxes behind.
The economic model resembles owning a commercial property dominated by a single expansive banquet hall. When fully booked, the facility generates reliable top-line revenue, but when that occupant vacates, reconfiguring the cavernous interior requires heavy capital expenditures and prolonged downtime.
What Makes a "Curbline" Property
The curbside strip operates under fundamentally different physical parameters. When announcing the spin-off in October 2023, SITE Centers defined convenience properties as positioned along "the curbline of well-trafficked intersections and major vehicular corridors," offering prominent street frontage, direct parking access, and a diversified roster of national and local tenants catering to daily convenience needs.16 The median property in Curbline's initial spin-off portfolio measured approximately 20,000 square feet, and 91% of base rent derived from tenant bays smaller than 10,000 square feet.16
The underlying economic thesis stems directly from this physical geometry. Shallow-bay, rectangular storefronts are largely interchangeable. A vacated mattress showroom can be converted into a smoothie bar, a physical therapy clinic, or an urgent-care office with modest tenant-improvement capital. Because dozens of potential commercial users can occupy identical rectangular bays without major structural modifications, the landlord preserves negotiating leverage during lease renewals and avoids committing substantial capital reserves to landlord-funded redevelopments.
Why Depth Matters
Management encapsulated this structural difference through the concept of "leasing depth." In the October 2023 spin-off presentation, SITE Centers asserted that the site plans and leasing depth of convenience real estate "reduce operating capital expenditures and provide significant tenant diversification."16 In practical commercial terms, leasing depth measures the depth of the tenant replacement pool. While a 60,000-square-foot department store or supermarket box may have only two or three viable replacement tenants within an entire submarket, a 2,000-square-foot roadside bay on a high-traffic intersection commands dozens of potential users across multiple retail and service categories.
That liquidity in the tenant pool shifts the balance of power at the negotiating table. When a landlord has immediate replacement alternatives, rent concessions shrink and lease renewal discussions favor the property owner. Conversely, when an anchor tenant threatens to vacate a 60,000-square-foot box, the scarcity of replacement operators forces the landlord to accept lower base rents and restrictive covenants.
This dynamic contains an important operational nuance. Deep tenant demand insulates a landlord against idiosyncratic tenant bankruptcies, but it offers little shelter against a systemic contraction in consumer spending or credit. If widespread economic headwinds pressure small retail and service businesses simultaneously, a theoretical pool of replacement operators provides limited downside protection if few businesses are expanding.
Rent Density: The Evidence
Reported lease economics corroborate the revenue side of management's thesis. At the time of the spin-off announcement in October 2023, the convenience portfolio generated an average annualized base rent of $35.32 per square foot.16 By the formal spin-off on October 1, 2024, that figure had reached $35.65 per occupied square foot.3 Fitch Ratings, in assigning Curbline an investment-grade credit rating, underscored that this base rent per square foot was the highest among its covered retail REIT peer group.17
For real estate underwriting, this rent density reflects tenant willingness to pay premium pricing for customer access and vehicular visibility rather than sheer square footage. Generating high unit rents across small physical footprints indicates that commercial tenants value the front-row arterial location itself—where drive-by visibility drives sales volume—rather than expansive interior square footage.
Capital Intensity: The Most Important Claim
From an equity underwriting standpoint, the most critical element of the convenience thesis centers on capital intensity. If a property owner must reinvest a large share of collected rent back into tenant allowances, leasing commissions, and structural upkeep just to maintain occupancy, nominal net operating income overstates true economic free cash flow.
On this metric, Curbline's early operational results supported management's underwriting. The company reported that capital expenditures absorbed approximately 7% of net operating income in 2025.18 During its second-quarter 2026 earnings conference call, management stated that trailing twelve-month capital expenditures stood at roughly 8% of net operating income, characterizing that capital drain as roughly one-third the rate incurred by conventional retail REIT peers.19 Fitch's independent credit assessment evaluated Curbline's ongoing capex at approximately 5% of net operating income.17
While the peer comparison represents management's own promotional framing, the empirical direction has remained consistent across corporate disclosures and third-party rating evaluations. The data confirms that shallow-bay roadside properties have required materially less landlord-funded reinvestment than traditional big-box or anchored centers across the operating environment of 2024 through 2026.
Pricing Power: Real but Not Unlimited
The third pillar of the commercial model is pricing power at contract execution. Across the trailing twelve months ended June 30, 2026, Curbline reported cash leasing spreads of approximately 20% on new leases and roughly 7% on lease renewals relative to expiring rents for identical bays.20 On a straight-line accounting basis, which averages contractual rent escalations across the full duration of the lease, new leasing spreads reached approximately 36%.20
The divergence between new lease pricing and renewal spreads highlights practical commercial dynamics. An existing tenant faces substantial relocation costs and risks forfeiting established local consumer routines, which theoretically grants the landlord pricing leverage. Yet renewal spreads hovering near 7% indicate that management deliberately prices renewals below peak market rates to preserve stable cash flows and preempt downtime. This concession reflects prudent asset management, but it also demonstrates the practical boundaries of landlord pricing power: even roadside service tenants retain viable off-site alternatives if pushed too aggressively.
The Strategic Decision
Synthesizing these physical and financial characteristics clarifies the strategic logic of the corporate separation. Within SITE Centers, the cash flows generated by curbside outparcels were blended into a consolidated entity whose capital was repeatedly absorbed by re-tenanting and redeveloping capital-hungry big-box centers. Isolating the convenience portfolio created a dedicated corporate vehicle whose retained operating cash flows could be funneled into acquiring additional roadside properties rather than consumed by anchor-box repositioning.
In the October 2023 spin-off announcement, Lukes characterized the convenience property segment as delivering "attractive, inflation-protected returns with limited capital" requirements.16 The first premise—limited ongoing capital expenditure—has been validated by operating results through mid-2026. The inflation-hedging claim remains an open question: while shorter three-to-five-year lease durations allow base rents to reset toward market rates more frequently, that pricing mechanism has yet to be tested across a protracted macroeconomic stagflation where tenant retail sales soften as operating costs surge.
Furthermore, executing this strategy required building an independent public vehicle without reigniting the debt-fueled vulnerabilities that nearly crippled DDR in 2008. That operational challenge prompted one of the more unusual balance-sheet designs in modern REIT history.
V. Act IV: The Financial Engineering Feat — Spinning Out CURB (1:35 – 1:58)
The Announcement
On October 30, 2023, alongside its third-quarter earnings report, SITE Centers unveiled its blueprint to spin off its convenience property portfolio into a standalone public REIT.16 At that initial disclosure, the portfolio comprised 61 wholly owned properties that stood 96.2% leased.16 The tenant roster was led by national retail brands: Starbucks, Darden Restaurants, JPMorgan Chase, Verizon, and Chipotle, with no individual occupier accounting for more than 2.3% of annualized base rent.16
The corporate carve-out hinged on an interim financing structure designed to bridge the transition. SITE Centers secured a $1.1 billion mortgage financing commitment from affiliates of Apollo, earmarked to retire existing unsecured debt.16 Under the proposed architecture, the parent company would retain the debt obligations and the legacy shopping centers, systematically dispose of those assets, and launch Curbline as an unencumbered, cash-funded vehicle.
The Liquidation Flywheel
The announcement initiated an aggressive property disposition campaign. SITE Centers marketed its anchored shopping centers into an institutional transaction environment that remained receptive to well-located, grocery-anchored retail despite rising interest rates. By late 2025, the company had completed $3.7 billion in asset sales since October 2023 and returned more than $380 million to shareholders through special dividends totaling $7.39 per share.21 By that point, the parent had winnowed its footprint down to 11 wholly owned properties and equity stakes in 11 joint-venture assets, with plans to sell the remaining holdings and file for corporate dissolution, initiating a five-year statutory wind-down.21
The historical contrast was stark. The founding premise of Developers Diversified Realty had been continuous asset accumulation. The closing chapter for the legacy operating entity became an orderly, planned liquidation: selling off every property, distributing the proceeds, and dissolving the corporate shell. The executive group that had once inherited an overleveraged balance sheet was systematically winding it down.
The Launch Architecture
Upon completing the spin-off, Curbline received the convenience portfolio alongside $800 million in unrestricted cash and a $500 million credit facility—consisting of a $400 million revolving line and a $100 million delayed-draw term loan—expandable to $750 million with lender approval.1 In initial public filings, management asserted that the enterprise was positioned to pursue acquisitions "with no additional near-term equity required."3
That baseline projection established an operational benchmark. It defined expectations for how the initial phase of portfolio growth would be capitalized, providing a standard against which Curbline's subsequent capital-raising pace would be evaluated.
The Corporate Hand-Off and the Shared Services Knot
Executive and governance continuity carried over directly into the new entity. David Lukes, Conor Fennerty, John Cattonar, and General Counsel Lesley Solomon transitioned to form Curbline's senior executive team.19 The board of directors mirrored the parent's governance apparatus, featuring Alexander Otto, Chairman Terrance Ahern, and several veteran SITE Centers directors.19
Yet the separation did not represent an immediate operational severance. A shared services agreement, effective through October 1, 2027, governs executive oversight and administrative support between the entities, with SITE Centers supplying personnel and operational resources while Curbline remits a fee equal to 2.0% of its gross revenue.1 Curbline's 2025 annual report detailed that SITE Centers provided services including payroll, human resources, and certain finance functions.22 In the second quarter of 2026, shared services fees totaled $1.2 million, and SITE Centers declined to exercise its June 30 termination option, leaving the operational arrangement intact.19
This structural interdependence creates a governance dynamic for investors to navigate: Lukes continues to serve as chief executive of SITE Centers while leading Curbline.21 Because SITE Centers is liquidating large shopping centers while Curbline is acquiring shallow-bay roadside strips, the two entities avoid direct bidding competition for assets. Nevertheless, executive attention remains a finite resource, and dual chief executive roles remain unusual for an emerging public REIT whose growth thesis relies on deal-sourcing discipline.
Myth vs. Reality: "Free" Cash
Market commentary surrounding Curbline's debut often characterized its starting cash position as cost-free growth capital. That interpretation misapprehends capital allocation.
The $800 million seed liquidity was harvested directly from selling shopping centers owned by the very shareholders who received Curbline stock. Moreover, in the prevailing interest rate environment of 2024, holding cash generated meaningful interest income, establishing a tangible hurdle rate for reinvestment. The debt-free balance sheet afforded Curbline transaction speed and closing certainty in private negotiations, but it did not provide free money. For an ongoing public entity, every dollar deployed must clear the cost of the subsequent debt and equity tranches required to replenish the balance sheet.
How Fast the Cash Went
That initial liquidity buffer diminished far more rapidly than initial investor expectations implied. Curbline acquired 20 properties for $206.1 million during its first operating quarter, ending 2024 with $626.4 million in cash.23 Capital deployment accelerated in 2025, with the company acquiring 81 convenience centers for $788.4 million.24 By June 30, 2026, cash reserves had fallen to $154.7 million, while consolidated debt climbed to $600 million, bringing net debt to $445.3 million.20
In under two years, Curbline transitioned from an unleveraged, cash-dominant vehicle into a conventionally leveraged REIT. The spin-off structure provided an immediate runway to establish operational scale in unanchored convenience retail, but it did not create a permanent funding advantage.
With the initial cash reserves deployed, the central analytical question became whether the newly acquired assets delivered the operating margins and capital efficiencies that management had promised.
VI. Act V: The Anatomy of a Convenience Asset — Unit Economics & Tenancy (1:58 – 2:25)
Seven Minutes
During Curbline's second-quarter 2026 earnings conference call, Piper Sandler analyst Alexander Goldfarb asked whether distinctive local merchants help draw foot traffic to the company's properties. David Lukes answered with a line that distilled the operational model: "The customers on average spend less than 7 minutes on our asset."19
That brevity inverts the operating logic of regional malls and lifestyle centers, where landlords design layouts to encourage lingering and cross-shopping. Curbline's typical customer is not browsing. The visitor is picking up coffee, retrieving a prescription, shipping a package, or getting a haircut before moving on. Lukes noted that the leasing priority is securing "as much rent as we can from the best credit," rather than curating an experiential destination.19
This orientation reinforces why physical geometry dictates commercial viability: arterial street frontage, curb-cut access from high-volume traffic flows, parking stalls directly outside the storefront, and drive-thru lanes where parcel configurations allow. The property functions not as a retail gathering place, but as a low-friction transit point.
The Portfolio Today
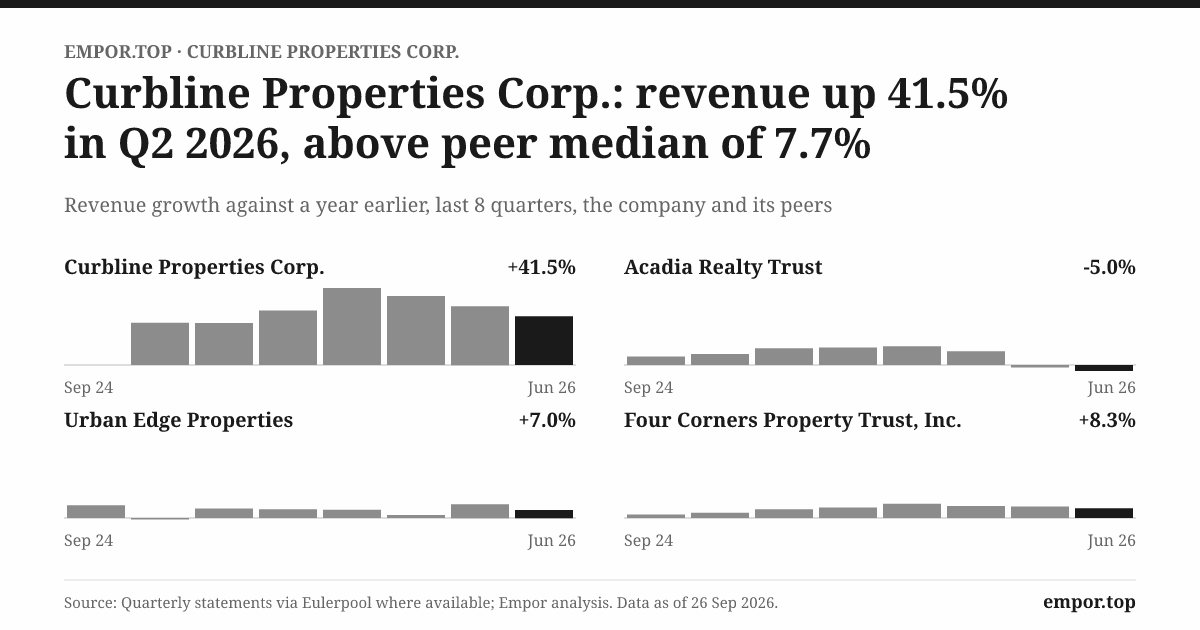
As of June 30, 2026, Curbline owned 220 properties spanning roughly 5.7 million square feet of leasable area, generating an average annualized base rent of $34.99 per square foot.20 The portfolio stood 96.5% leased and 94.3% occupied—the latter tracking storefronts actively open and paying rent.20 Management highlighted that 94.3% occupancy rate as the highest achieved since the public spin-off.25
The 220-basis-point spread between leased and occupied space captures the signed-not-opened pipeline: commercial operators that have executed binding leases but have not yet completed interior buildouts. Management projected that nearly 90% of that pipeline would commence rent payments by March 31, 2027.25 Because those cash flows represent executed contractual obligations rather than speculative leasing assumptions, this pipeline provides visible, low-risk embedded revenue growth.
Tenant Roster: Diversification by Design
Curbline's rent roll is deliberately fragmented. At year-end 2025, national corporate tenants accounted for more than 70% of base rent, with individual exposure tightly capped: outside of Starbucks, no single tenant accounted for more than 2%.22 Starbucks represented the largest single tenant at 2.6% of base rent, followed by Verizon, Inspire Brands (parent of Arby's and Dunkin'), JAB Holding, and Chipotle, with the top ten tenants together accounting for less than 14% of base rent.22 By mid-2026, the portfolio encompassed more than 1,300 distinct tenants.25
This structure directly counters one of retail real estate's classic structural failure points. DDR's historical reliance on Kmart demonstrated the compounding risks of anchoring cash flows to a single dominant merchant. Curbline's portfolio presents the opposite profile: an insolvency by its largest individual tenant would imperil only about 2.6% of rental revenue.
Leasing in Motion
Leasing activity at Curbline resembles an ongoing succession of small-scale agreements rather than occasional high-stakes negotiations. During the second quarter of 2026, the company completed over 167,000 square feet of new leases and renewals across 15 new tenant brands, including FedEx Office and Tropical Smoothie alongside healthcare and service operators.25 Portfolio-wide, only seven tenants contribute more than 1% of base rent.19
The composition of those lease signings illustrates which commercial formats continue to expand physical footprints in suburban markets. Quick-service drive-thru restaurants, dental clinics, veterinary practices, boutique fitness studios, and package-shipping storefronts all require local physical presence and offer relative insulation from digital disruption. This tenant universe explains why Curbline's corporate commentary rarely mentions apparel or department store merchandise—the retail segments most vulnerable to online competition.
Conversely, the remaining portion of the portfolio—roughly 30% of base rent derived from local and regional operators—introduces distinct underwriting risks. Independent businesses typically operate with thinner capital reserves and face higher default rates during economic contractions. On the second-quarter 2026 call, Lukes stated that the company devotes "a significant amount of time on creditworthiness" for local operators, subjecting applicants to "pretty robust analysis."19 While that screening process represents standard landlord due diligence, its true efficacy can only be measured when consumer spending softens across an economic downturn.
Operating Results Against Guidance
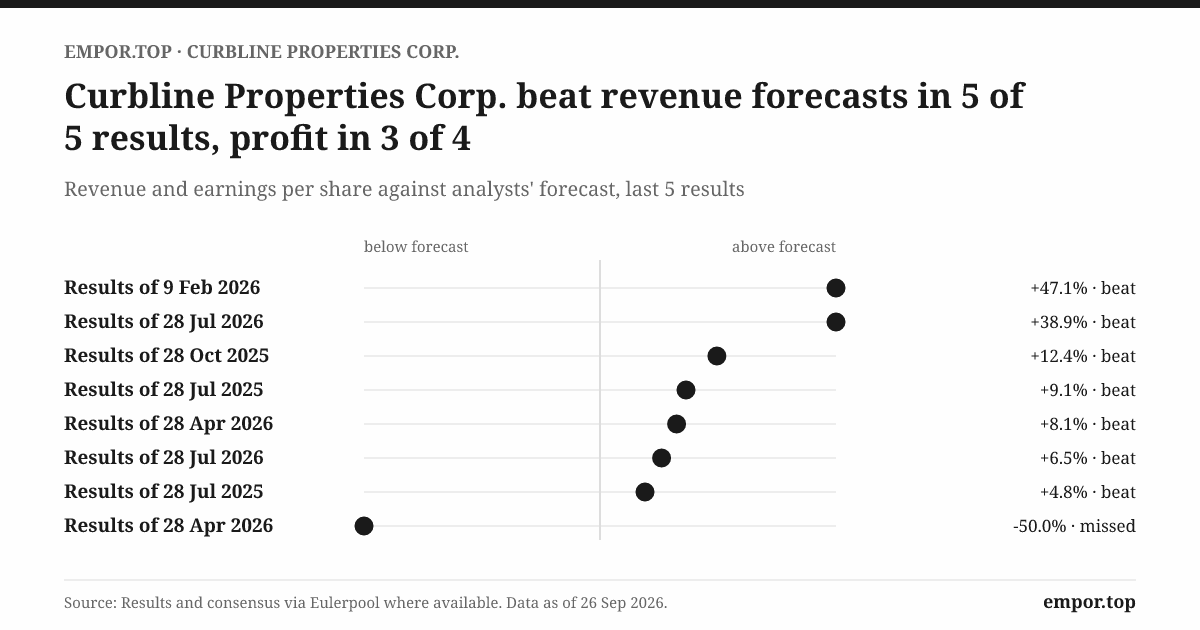
Curbline's operational disclosures across its initial two years offer empirical evidence to evaluate executive guidance discipline. To date, management has established a pattern of conservative initial targets followed by upward revisions.
For 2025, leadership initially guided operating funds from operations—a supplemental cash-flow metric widely monitored by REIT investors—to between $0.97 and $1.01 per share.23 Full-year 2025 operating FFO reached $1.06 per share.24 For 2026, the company initially guided to $1.17 to $1.21 per share,24 raised that range to $1.20 to $1.23 following the first quarter,26 and increased it further to $1.24 to $1.26 after the second quarter.20
That recurring beat-and-raise trajectory contrasts with reported GAAP net income, which revised downward across the same period. Management adjusted 2026 GAAP net income guidance from an initial range of $0.32 to $0.40 per share down to $0.27 to $0.32 after the second quarter.2420 Second-quarter GAAP net income landed at $6.9 million, or $0.06 per share, declining from $10.4 million in the prior-year period primarily due to increased interest expense and non-cash depreciation and amortization charges.27 While rising depreciation is a standard byproduct of aggressive portfolio expansion, the widening divergence between non-GAAP cash metrics and GAAP profitability also underscores Curbline's balance-sheet transition from harvesting interest income on uninvested cash to servicing corporate debt.
Same-Property Growth: The Deceleration Question
The most critical indicator of organic asset productivity—same-property net operating income, which isolates legacy assets by stripping out acquisition contributions—exhibited a decelerating trajectory. Same-property NOI grew 5.8% in 2024 and 3.3% in 2025, with management guiding full-year 2026 growth to approximately 3%.1923 Through the first half of 2026, same-property growth slowed to 2.1%.20
Management attributed second-quarter softness to specific non-recurring operational frictions: a 260-basis-point drag resulting from lower forecasted expense recoveries alongside $370,000 in storm damage repairs at a North Carolina property.19 Adjusting for those items, leadership asserted that underlying same-property NOI growth would have registered at 3.1%.19 Conor Fennerty also observed that because Curbline's same-property pool comprised only about 56% of total net operating income due to rapid acquisition additions, property-level variance exerted outsized statistical volatility on consolidated figures.19
While these explanations identify genuine operational headwinds, the broader deceleration remains notable. In its October 2023 spin-off presentation, SITE Centers underwrote same-property NOI growth exceeding 3% annually from 2024 through 2026.16 Operating performance has satisfied that threshold on an annualized multi-year basis, but organic expansion has tracked toward the lower boundary of initial expectations rather than compounding at accelerating rates.
Historical Falsification: Lease Rollover
The operational structure of unanchored convenience centers divides equity analysts. Proponents contend that shorter three-to-five-year lease terms provide an organic inflation hedge by allowing landlords to mark expiring rents to prevailing market levels on a frequent cadence. Sceptics argue that compressed lease durations impose chronic rollover risk, exposing property owners to perpetual downtime and re-leasing frictional costs.
Disclosed lease maturity schedules validate both perspectives. Approximately 61% of Curbline's annualized base rent derived from leases expiring within five years, excluding contractual renewal options, with roughly 10.1% of leased space scheduled for rollover in 2026.22 That rollover velocity contrasts sharply with traditional grocery-anchored or power centers anchored by 15-to-20-year commercial commitments.
Through mid-2026, this accelerated turnover bolstered cash-flow expansion: Curbline captured roughly 20% cash leasing spreads on new agreements while maintaining tenant-funded capex at low single-digit percentages of net operating income. Yet this performance unfolded against a benign operating backdrop characterized by steady consumer spending and aggressive suburban expansion among national quick-service chains. The proposition that compressed lease durations represent an unmitigated structural advantage remains contingent on favorable macro fundamentals. Fitch Ratings reached a parallel conclusion when assigning its credit profile, characterizing the strategy as "relatively untested through market cycles."17
The decisive test of the rollover thesis will occur when labor markets soften and suburban retail sales decelerate. If tenant retention and cash renewal spreads remain positive while portfolio occupancy stays anchored in the mid-90% range during a consumer contraction, management's underwriting will be validated.
While property-level unit economics have validated management's thesis across a favorable economic backdrop, the broader challenge centers on external growth: whether Curbline can continue sourcing and acquiring thousands of fragmented roadside parcels at attractive yields as its initial cash cushion is exhausted.
VII. Act VI: Capital Allocation Engine & M&A Benchmarking (2:25 – 2:50)
Fifty Deals a Year, One at a Time
Picture the acquisitions desk at Curbline on a typical Monday morning. The transaction pipeline does not involve multi-billion-dollar portfolio trades between institutional landlords. Instead, the deals are hyper-local: a $7 million roadside strip in suburban Charlotte held by a retired dentist's family, a $12 million parcel outside Phoenix built by a local developer funding their next project, and a $9 million center in Texas being sold by heirs settling an estate.
This granular deal flow forms the foundation of Curbline's external growth strategy: acquire small-format commercial properties from private owners one at a time, assembling scale through continuous aggregation. During Curbline's second-quarter 2026 earnings conference call, David Lukes stated that the company maintains a 26-person acquisitions department, characterizing the team as "far larger than any other institution or non-institution in this country."19 While that claim cannot be independently verified across the private real estate market, it highlights where management has concentrated corporate overhead.
The Size of the Hunting Ground
Industry proponents often emphasize the vastness of the addressable market. Curbline's public filings have highlighted a fragmented national universe of more than 68,000 convenience properties in the United States, representing over $41 billion in transaction volume over a five-year period.3 On the second-quarter 2026 call, Lukes noted that Curbline's portfolio still represented only about 60 basis points—roughly six-tenths of one percent—of total domestic inventory for this asset class.19
This fragmentation underpins the bull case for programmatic aggregation: even at an acquisition velocity of $1 billion annually, the company could theoretically deploy capital for years without exhausting potential targets. The decisive question for public equity investors, however, is not inventory availability, but whether Curbline can acquire these privately held parcels at pricing spreads that generate durable, per-share economic value.
The Acceleration
Curbline's acquisition pace accelerated rapidly after the spin-off. Management's initial baseline envisioned deploying approximately $500 million annually, a volume cited in Fitch Ratings' initial credit evaluation.17 The company surpassed that target by acquiring $788.4 million of properties in 2025.24 For 2026, leadership initially targeted $700 million, elevated that guidance to $850 million, and raised it further to $1 billion after completing $564 million in acquisitions across the first half of the year.1825
Management attributed this transaction momentum to an ongoing generational transition. On the second-quarter call, Lukes pointed to "a transfer of wealth and real estate to the next generation of owners," paired with market fragmentation and Curbline's reputational closing certainty.19 Many roadside strips were constructed during the 1980s and 1990s by independent regional developers who are now entering retirement; their heirs frequently prefer liquid cash distributions over active tenant management.
Lukes also identified a parallel deal-sourcing catalyst: national retail tenants are "increasingly seeking to replace local tenants in high-traffic intersections to capture higher four-wall EBITDA."19 In practice, Curbline's corporate occupiers are identifying the specific arterial corners they wish to occupy, functioning as an informal sourcing channel for the REIT's acquisition desk.
Pricing: The Low-6% Cap Rate
In commercial property underwriting, the capitalization rate represents a property's initial net operating income divided by its purchase price. A 6% cap rate indicates that an asset generates $6 of annual net cash flow for every $100 invested, before accounting for financing costs.
Curbline's reported acquisition cap rates have hovered consistently in the "low 6s," according to management disclosures, with individual transactions closing between the low 5% and high 6% range.19 Lukes indicated that Curbline targets unlevered internal rates of return—the total annual return including organic rent growth and terminal value, before debt—of approximately 8%, noting that "most of that IRR is coming from cash flow" given modest landlord capital expenditure obligations.19
Crucially, Lukes emphasized that larger multi-property transactions completed by Curbline were priced at "simply the sum of each individual asset's value" rather than reflecting a portfolio discount, and that the entire $1 billion 2026 acquisition pipeline consisted of individual, one-off transactions.19 This disclosure carries notable analytical weight. Many corporate roll-up models claim to manufacture value by buying fragmented assets at a multiple discount and aggregating them into a premium institutional wrapper. Curbline's leadership acknowledges that it is not purchasing small strips at below-market discounts; instead, the economic premise rests on transaction access, speed of execution, and post-acquisition operational management.
The Funding Shift: From Cash to Capital Markets
By mid-2026, the $800 million seed cash received at the spin-off had been largely deployed, prompting Curbline to construct a conventional REIT funding architecture.
On the liability side of the balance sheet, the company tapped its $100 million delayed-draw term loan in 2025, secured an additional $150 million term loan in July 2025, and entered the private placement debt market.24 In June 2025, Curbline agreed to issue $150 million of senior unsecured notes split between a 5.58% tranche due in 2030 and a 5.87% tranche due in 2032.28 In November 2025, it placed an additional $200 million of unsecured debt priced at 4.90% due in 2031 and 5.13% due in 2033.29 Fitch assigned Curbline an investment-grade BBB credit rating while cautioning that the newly independent entity lacked a seasoned track record in public bond markets.17 CFO Conor Fennerty reported that Curbline had raised $600 million in aggregate debt at a weighted average interest rate of roughly 5%.18
The transition on the equity side proved even more consequential. By year-end 2025, Curbline had sold 5.2 million shares via forward equity sales agreements.18 During the second quarter of 2026, the company raised roughly $550 million in equity, including a June follow-on offering, and executed forward sales for 18.1 million shares representing expected gross proceeds of $541 million.19 Total capital raised through June 30, 2026, reached $823.5 million.20
Historical Falsification: The Cost-of-Capital Squeeze
The core bear case articulated at Curbline's public debut was that once initial cash reserves ran out, the REIT would be forced to fund acquisitions yielding in the low-6% range with debt capital costing near 6%, effectively compressing investment spreads to zero.
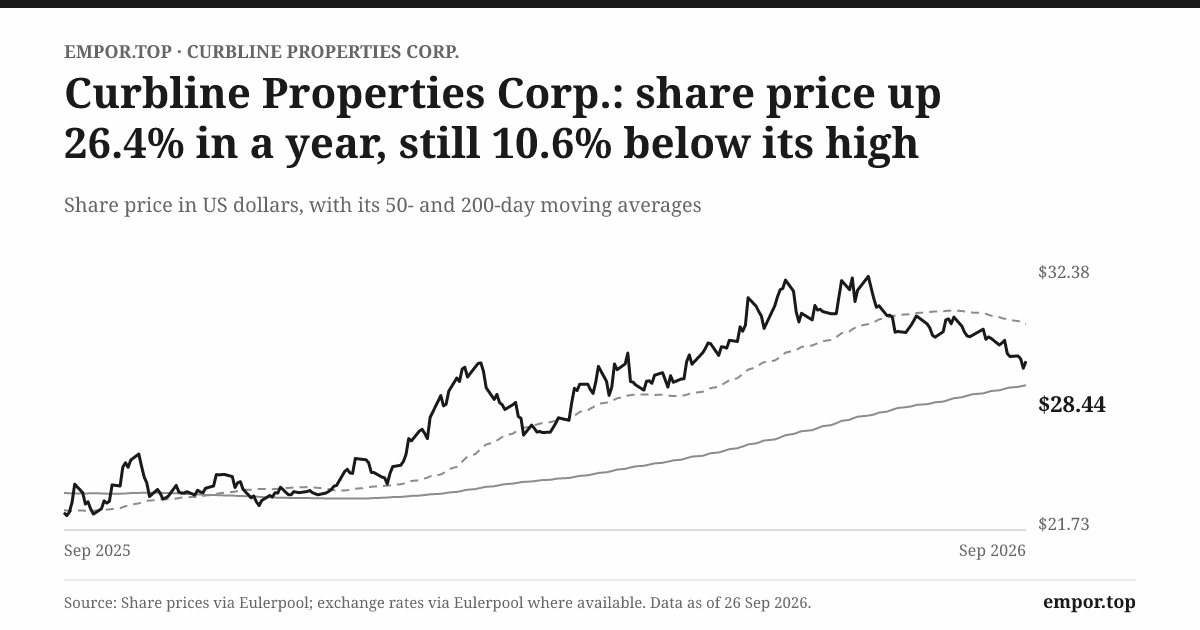
Empirical execution through mid-2026 has narrowed that concern without eliminating it entirely. Borrowing costs have ranged between 4.9% and 5.9%, preserving a narrow positive spread on debt-funded acquisitions.182829 Meanwhile, equity has become the dominant funding mechanism, where the true cost of capital is tied directly to equity market valuation. The forward sale of 18.1 million shares for $541 million implied an execution price of approximately $30 per share.19 Measured against full-year 2026 operating FFO guidance of $1.24 to $1.26 per share, that implies an earnings yield on new equity of roughly 4.1% to 4.2%—comfortably below the low-6% property acquisition cap rates.20 That investment spread, amplified by contractual rent escalations, forms the basis of management's claim that equity-funded aggregation remains immediately accretive to per-share cash flows.
Yet this financial model remains tethered to prevailing equity market sentiment. If Curbline's share price were to decline toward the underlying private-market net asset value of its real estate, the earnings yield on new equity would rise toward the low-6% acquisition cap rate, sharply narrowing investment spreads and decelerating the external growth flywheel. Institutional analysts on the fourth-quarter 2025 call scrutinized this dynamic from the opposite perspective: Citigroup analyst Craig Mailman questioned whether earlier forward equity sales had locked in dilutive pricing prematurely given subsequent share appreciation, while Fennerty defended the pre-funding strategy as "accretive to the business plan."18
The resulting equity dilution has been substantial. Curbline began public trading with approximately 104.9 million shares distributed in the spin-off; by July 2026, outstanding shares had risen to roughly 115 million, even before factoring in the eventual physical settlement of its large forward equity contracts.110 While programmatic equity issuance is standard practice for expanding REITs, it stands in direct contrast to management's spin-off disclosure projecting acquisitions "with no additional near-term equity required."3 Although that initial projection was not technically breached—management elected to tap equity markets to accelerate acquisitions rather than out of liquidity distress—it underscores that Curbline's compounding narrative has become intrinsically dependent on public equity access.
When Piper Sandler's Alexander Goldfarb inquired on the fourth-quarter 2025 call whether accelerated acquisition activity had pulled forward the company's five-year deleveraging roadmap, Fennerty acknowledged that stronger property-level cash flows and aggressive deal sourcing had indeed "pulled forward" the corporate timeline.18 Fitch anticipated that balance-sheet leverage would rise toward 4.0x net debt-to-EBITDA by 2028.17 On the second-quarter 2026 call, management reiterated its intent to maintain leverage in the "low 20s" as a percentage of total enterprise value, signaling that future debt financing would primarily target the private placement market.19
What the Analysts Pushed On
The second-quarter 2026 earnings call provided clear insight into the strategic questions occupying institutional investors. KeyBanc analyst Todd Thomas asked whether elevated benchmark Treasury yields would inevitably push property cap rates higher and compel Curbline to revise its acquisition underwriting. Lukes responded that transaction cap rates had demonstrated stubborn resilience, stating that he wished "the industry reacts very quickly to borrowing costs" but observing that unlevered asset returns remain the prevailing benchmark for private commercial buyers.19 That dynamic cuts both ways: while it confirms stable property values for Curbline's existing portfolio, it also implies that the company cannot rely on private sellers discounting assets when institutional borrowing costs climb.
Ladenburg Thalmann analyst Floris Van Dijkum pressed management regarding the portfolio's geographic concentration in the Sunbelt and relative absence in the Northeast and Pacific Northwest. Lukes acknowledged those underrepresented regions as "laggards," explaining that multigenerational property owners with deeply depreciated tax bases face prohibitive capital gains liabilities upon a sale.19 He noted that while offering operating partnership units—allowing sellers to contribute real estate tax-free in exchange for equity-linked partnership interests—remains mathematically compelling, it is "not easy to get them across the finish line."19 Because tax-deferred umbrella partnership structures represent one of the few structural advantages a public REIT can deploy against private cash buyers, Curbline's inability to execute OP-unit transactions at scale remains an operational bottleneck in mature coastal markets.
JPMorgan analyst Mike Mueller questioned the capitalization roadmap for the remainder of 2026. Fennerty stated that available capital sources of $850 million to $900 million—encompassing balance-sheet cash, unsettled forward equity, and retained operating cash flow—comfortably exceeded the remaining $500 million acquisition pipeline, projecting a year-end cash balance between $350 million and $375 million while keeping debt-to-market-capitalization leverage in the low 20% range via private placement notes.19 While pre-funding the acquisition pipeline demonstrates balance-sheet prudence, it also alters shareholder economics: existing equity holders absorb dilution from forward share sales well before the acquired properties generate offsetting rental cash flows.
Sourcing Overhead
The ultimate constraint on programmatic roll-ups is operational scalability. Sourcing and closing $1 billion in annual acquisitions across individual transactions averaging $10 million to $15 million requires completing dozens of independent property purchases each year—each demanding bespoke title searches, environmental assessments, physical due diligence, and tenant estoppel agreements. On the second-quarter 2026 call, Goldfarb questioned whether sustaining this velocity would require perpetual additions to corporate overhead. Lukes responded that while the company remains "careful with our G&A, but we certainly recognize we're willing to allocate G&A towards growing the business."19
That acknowledgment highlights a pivotal metric for equity investors: if general and administrative expenses expand faster than property-level net operating income, the overhead drag will erode the economic benefits of external aggregation. Curbline guided full-year 2026 G&A expense to approximately $32 million.18
Curbline's capital deployment engine has demonstrated rapid early velocity across its first two public years. The more demanding analytical question is whether an aggressive, high-overhead aggregation model can establish a durable competitive moat—or whether the strategy remains vulnerable to low-cost imitation across the commercial real estate sector.
VIII. Act VII: The Strategy Stress Test — 7 Powers & Porter's 5 Forces (2:50 – 3:08)
The War Game
Imagine the investment committee of a large private equity real estate fund in late 2026. They have watched Curbline deploy roughly $1.8 billion acquiring small strip centers in under two years, trading at a sustained valuation premium to the private property market. A committee member asks the central strategic question: what prevents private equity from replicating the identical playbook?
The fund commands deep pools of institutional equity, operates without the scrutiny of quarterly earnings reports, and maintains direct access to national brokerage networks. What stops well-funded institutional rivals from aggregating the same assets? The answer defines whether Curbline possesses a defensible economic moat—or merely an early lead in a fragmented marketplace.
Hamilton Helmer's 7 Powers
Cornered Resource — narrower than claimed. Proponents argue that Curbline controls irreplaceable arterial corners protected by municipal zoning barriers, curb-cut restrictions, and suburban resistance to new commercial development. While that physical scarcity is genuine, it is an intrinsic attribute of the asset class rather than a proprietary advantage unique to Curbline. Those land-use constraints protect any property owner holding a well-situated roadside strip, including the thousands of private owners Curbline negotiates against. Representing only about 60 basis points of total domestic inventory, Curbline commands no local pricing dominance in any individual metropolitan submarket.19 Supply barriers support sector-wide rental rates, but they do not constitute a cornered resource for Curbline itself.
Counter-Positioning — plausible but unproven. Established shopping center REITs are structurally organized around institutional scale. For an operator managing a multi-billion-dollar portfolio of grocery-anchored centers, underwriting a $10 million outparcel requires comparable legal, environmental, and closing overhead to acquiring a $100 million power center, yet moves the needle negligibly on consolidated earnings. Curbline embraces that transactional friction because granular deal-sourcing represents its core organizational model. While this constitutes a form of counter-positioning, it remains less defensible than classic economic examples. Nothing structurally prevents an incumbent shopping center REIT from capitalizing a dedicated small-format acquisitions desk if transaction yields remain compelling. The empirical indicator to monitor is whether larger institutional competitors begin actively bidding up roadside parcels in Curbline's target submarkets.
Scale Economies — early and modest. Corporate scale benefits Curbline through two primary mechanisms: centralized national leasing relationships and a specialized 26-person acquisition apparatus. Managing relationships across more than 1,300 tenants grants leadership proprietary visibility into which corporate chains are expanding physical footprints and targeting specific corridors.25 Yet property-level operating efficiencies remain constrained. During the fourth-quarter 2025 earnings call, when asked about potential clustering synergies across contiguous submarkets, Lukes acknowledged that operational synergies "don't really flow through" same-property net operating income because triple-net lease structures pass most operating expenses directly to tenants, leaving cost efficiencies to accrue primarily at the corporate overhead level.18 That dynamic limits the operational leverage scale can generate at the physical asset level.
Switching Costs — low. Commercial service tenants demonstrate loyalty to vehicular traffic volumes and established customer routines, not to their public landlords. A national coffee chain or wireless store approaching lease expiration can relocate to a competing center across the intersection if contractual renewal terms become onerous. The operational advantage of owning standardized rectangular bays is that Curbline can backfill vacant space with minimal capital outlay; the reciprocal reality is that occupiers face modest switching friction when viable alternatives exist along the same arterial corridor.
Network Effects — none. The commercial model exhibits no intrinsic network dynamics. Securing a corporate lease with a quick-service operator in Charlotte creates no direct operational value or demand pull for Curbline's properties in Dallas or Phoenix.
Brand and Process Power — limited. Curbline's reputation among regional brokers as an unencumbered buyer offering closing certainty provides a genuine execution edge in bilateral private-market transactions. Yet that transactional goodwill represents operational proficiency built over recent deal cycles rather than an insurmountable barrier to well-capitalized institutional competitors.
Synthesizing Helmer's framework suggests that Curbline's competitive advantage rests on an aggregation of early execution velocity, public capital markets access, and institutional specialization, rather than an unassailable structural power. While that combination confers a meaningful operating head start today, it leaves the platform more vulnerable to competitive encroachment than the pure-play marketing narrative suggests.
Porter's Five Forces
Threat of new entrants — moderate. Municipal zoning constraints and curb-cut limitations severely restrict new commercial construction along major suburban thoroughfares, containing physical supply. The primary competitive threat, however, stems from alternative capital sources rather than new property development. Private equity vehicles, family offices, and 1031 exchange investors—private individuals deploying sale proceeds to defer capital gains liabilities—routinely bid on the same roadside parcels, often accepting lower initial yields.
Bargaining power of tenants — moderate. National corporate chains command substantial leverage during master lease discussions. Yet because no single tenant accounts for more than approximately 2.6% of annualized base rent, no single corporate occupier can dictate commercial terms across the broader portfolio.22 Furthermore, the broad liquidity of potential occupiers for standardized shallow bays insulates Curbline's negotiating posture at the asset level, allowing the landlord to resist punitive lease concessions.
Bargaining power of sellers — moderate to high. Private property owners operating across fragmented metropolitan markets have access to a liquid pool of private and institutional buyers. David Lukes's acknowledgment that Curbline acquires multi-property packages at sum-of-the-parts pricing without capturing portfolio discounts indicates that private sellers continue to extract full market value in negotiated sales.19
Threat of substitutes — moderate and evolving. Digital fulfillment, mobile ordering, and telehealth continue to alter consumer shopping behaviors. Yet the core services occupying Curbline's storefronts—quick-service food concepts, outpatient medical clinics, pet care, and personal grooming—require physical consumer presence or rely on storefront infrastructure to execute local delivery and pickup. Drive-thru lanes, in particular, function as physical distribution hubs for digital mobile orders. The primary substitution risk is not the obsolescence of roadside convenience, but the possibility that corporate occupiers transition toward smaller physical footprints or automated kiosks over time.
Competitive rivalry — high locally. While Curbline remains the sole publicly traded pure-play in the sector, commercial real estate operates on hyper-local fundamentals. At the asset level, every property competes for tenants against adjacent shopping center outparcels, and every acquisition opportunity contends against regional developers and private buyers who operate with lower return hurdles.
Myth vs. Reality: "The Only Public Pure-Play Deserves a Permanent Premium"
On nearly every quarterly conference call, executive commentary reiterates that Curbline is the only publicly traded company exclusively concentrated on convenience real estate.19 That claim is factually indisputable. The myth lies in the assumption that scarcity within public equities inherently guarantees a durable valuation premium.
Scarcity value in public equity markets typically endures only until an asset class proves lucrative enough to invite institutional replication. If Curbline's returns continue to outperform traditional retail peers, institutional capital will inevitably seek to duplicate the vehicle: whether through private equity sponsors assembling and listing competing convenience portfolios, diversified shopping center REITs spinning off their own outparcel assets, or institutional asset managers acquiring existing platforms. Each alternative would provide public investors with direct exposure to convenience retail, compressing Curbline's scarcity multiple.
The empirical reality is more measured. Being first to market has secured Curbline an initial lead in broker relationships, tenant sourcing channels, and closing infrastructure, alongside an accretive cost of equity while the public premium persists. The evidence validates Curbline as a first mover benefiting from a temporary capital-cost advantage, rather than an entity possessing a permanent monopoly over an asset class. The ultimate test will occur when a credible public competitor emerges: if Curbline sustains its acquisition volume and underwriting spreads, its process advantages are real; if acquisition yields compress and deal velocity slows, the outperformance was merely a reflection of public-market scarcity.
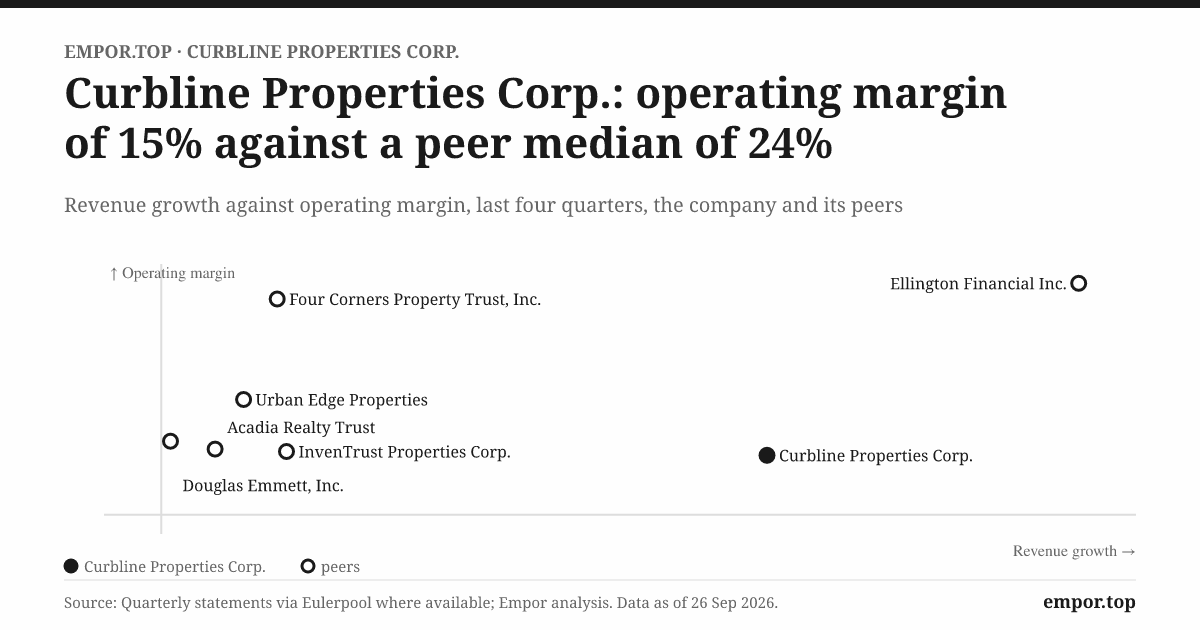
Comparing the Peer Set
Large shopping center REITs—including Kimco Realty, Regency Centers, and Federal Realty—already hold extensive portfolios of small-shop bays and peripheral outparcels within their grocery-anchored and regional community centers. What differentiates Curbline is not the physical building format, but its exclusive strategic focus. That concentration delivers operational clarity and accelerated percentage growth off an asset base under $2 billion. In contrast, institutional peers offer diversified revenue streams, multi-decade operating histories, and deeper liquidity across unsecured public bond markets—an institutional funding channel Fitch Ratings highlighted as a relative vulnerability for Curbline's standalone balance sheet.17
With the competitive landscape established, the strategic debate centers on whether the structural tailwinds of roadside convenience can withstand macroeconomic headwinds and execution friction.
IX. Act VIII: The Bull vs. Bear Case & What to Watch (3:08 – 3:24)
The Two Investors
Picture two veteran REIT investors conferring after Curbline's second-quarter 2026 earnings call. The first sees a management team that has outperformed its guidance in consecutive periods, expanded operating funds from operations in the high teens, and elevated its full-year acquisition target twice in six months. The second observes a business where organic same-property growth is decelerating, equity dilution is accelerating, and the compounding engine relies on a public valuation premium that has never navigated a sustained economic contraction. Both investors are looking at identical reported disclosures.
The Bull Thesis
1. Internal growth with low capital drag. The most compelling pillar of the bull case is supported by reported operating data. Capital expenditures have absorbed between 5% and 8% of net operating income under Fitch's and management's respective assessments, allowing a substantially larger share of gross rent to convert into distributable free cash flow.1719 Paired with cash rent spreads hovering near 20% on new leases and a contractually committed signed-not-opened tenant pipeline, property-level cash flows possess organic upward momentum independent of external acquisition volume.2025
2. Management credibility. The executive team's guidance discipline since the spin-off has established an unbroken beat-and-raise pattern, setting conservative initial baselines and progressively elevating targets across successive quarters.202324 Corporate disclosures surrounding temporary operational softness—such as second-quarter same-property variances—have provided granular, quantified reconciliations rather than generalized explanations. David Lukes's 2025 compensation architecture also reflects meaningful economic alignment: his base salary was set at $50,000, with the overwhelming majority of executive pay awarded through equity-based long-term incentive units.30
3. The consolidation premium. Operating as the sole public pure-play allows Curbline to issue equity at an earnings yield comfortably below property acquisition cap rates. That cost-of-capital advantage generates immediate accretion on every dollar deployed so long as the valuation premium holds. Shareholder distributions have expanded in parallel, marked by a 6% dividend increase to $0.17 per share quarterly announced in February 2026.31
The Bear Thesis
1. The spread depends on the stock price. The external compounding model functions efficiently only while Curbline's equity commands a persistent premium over private real estate values. If market sentiment softens and the shares re-rate closer to underlying net asset value, the marginal cost of equity will rise toward acquisition cap rates, sharply narrowing investment spreads and decelerating external deal flow. The dynamic contains inherent reflexivity: the valuation premium fuels external growth, and external growth justifies the valuation premium.
2. Slowing organic growth. Same-property net operating income expansion has traced a decelerating path, tapering from 5.8% in 2024 to 3.3% in 2025, alongside full-year 2026 guidance centered near 3%.19 While management's operational reconciliations are credible, persistent deceleration risks signaling that the core portfolio's organic compounding resembles that of traditional suburban shopping centers rather than a structurally differentiated retail format.
3. Recession exposure. Approximately 30% of annualized base rent derives from local and regional operators, while 61% of portfolio leases expire within five years.22 In a sharp economic contraction, that combination exposes cash flows to accelerated vacancy risk and renewal friction. The principal historical downturn managed by this executive group—the 2020 pandemic at SITE Centers—resulted in a suspended common dividend.14 While that disruption involved an anchored shopping center portfolio rather than standalone roadside parcels whose isolated performance went undisclosed, it confirms that executive underwriting has not yet navigated an unanchored convenience portfolio through a full consumer downturn.
4. Governance and concentration of attention. David Lukes's dual mandate as chief executive of both SITE Centers and Curbline, the ongoing shared services agreement channeling fees to the legacy parent, and a classified board structure—with the 2026 proxy presenting only two directors for shareholder election—represent governance arrangements that invite external scrutiny.12130 While none of these structures reflects impropriety, they insulate leadership from direct proxy accountability should operational performance stumble.
The Risk Radar
Beyond valuation and cyclical sensitivity, four structural operational variables warrant continuous monitoring.
Interest rates. Elevated long-term borrowing benchmarks raise debt financing costs while exerting downward pressure on REIT equity valuations, raising the marginal cost of equity in parallel. Because private commercial cap rates have shown stubborn resilience, prolonged benchmark rate pressure threatens to compress acquisition spreads from both liability and equity channels.19
Weather and insurance. Geographic concentration across the Sunbelt and Southeast creates ongoing exposure to severe weather events. In the second quarter of 2026, repair expenditures at a single storm-damaged property in North Carolina were modest in absolute dollar terms but deducted approximately 100 basis points from same-property NOI growth, illustrating how idiosyncratic physical shocks can distort results across a relatively small same-property base.19
Technology and consumer behavior. Third-party delivery platforms and mobile ordering have not displaced physical storefronts for convenience merchants, but they continue to reconfigure physical space requirements. A broader shift toward compact, drive-thru-only or dedicated pickup formats benefits high-visibility arterial pads while potentially dampening demand for deeper inline bays across older strips—a structural evolution whose long-term impact management has not yet quantified.
Operational dependence. Curbline reported just 39 full-time employees at year-end 2025, relying on SITE Centers for essential payroll, human resources, and finance functions through their shared services arrangement.22 As that contract approaches its October 2027 expiration, Curbline must internalize or replace those operational capabilities. While Conor Fennerty has indicated that corporate overhead should not shift materially because existing service fees were benchmarked to fully loaded personnel costs, the migration toward full operational autonomy introduces execution friction.19
The Activist's Memo
A skeptical institutional investor would likely interrogate three unresolved questions. First, why has the company pursued such aggressive forward equity issuance ahead of immediate capital needs, and what is the net per-share return on each newly deployed equity dollar after absorbing overhead and transaction fees? Second, what is the definitive timeline for David Lukes to conclude his responsibilities at SITE Centers, and will the administrative shared services contract terminate without friction in October 2027? Third, what accounts for the widening divergence between downward-revised GAAP net income guidance and rising operating funds from operations expectations, and does non-GAAP reporting obscure the true capital drag of accelerated depreciation charges?2024
Management offers coherent preliminary responses to each challenge: equity issuances pre-fund an accretive acquisition pipeline, SITE Centers is progressing toward statutory liquidation, and depreciation charges represent non-cash accounting adjustments tied to physical asset accumulation. Nevertheless, these governance and accounting distinctions will face heightened scrutiny if external expansion decelerates.
The Three KPIs That Matter Most
1. Same-property NOI growth. This remains the purest metric to evaluate whether unanchored convenience centers generate structurally superior organic cash-flow growth relative to broader commercial retail. Management's long-term underwriting framework anticipates annual organic growth between 3% and 4%. Sustained execution at or above that corridor would validate the convenience thesis; protracted results below 3% would indicate that roadside strips share the growth constraints of conventional shopping centers.
2. Cash leasing spreads, especially on renewals. While new leasing spreads demonstrate headline retailer demand along arterial corridors, renewal spreads isolate genuine landlord pricing power over existing tenants. A compression in renewal spreads while occupancy holds steady would indicate growing tenant resistance to contractual rent escalations; a simultaneous contraction in both metrics would signal softening underlying merchant demand.
3. The net investment spread. The differential between initial property acquisition cap rates and Curbline's marginal blended cost of capital across debt and equity represents the ultimate determinant of corporate compounding. This single calculation reveals whether programmatic external aggregation is creating durable per-share value or merely building balance-sheet scale.
The empirical record provides public market investors with the quantitative benchmarks needed to evaluate Curbline over time. The concluding question is what Curbline's strategic experiment reveals about the broader evolution of retail real estate.
X. Epilogue & Playbook Lessons for Investors and Builders (3:24 – 3:30)
Back at the Curb
Return to that intersection at 7:40 on a Tuesday morning. The drive-thru line is still there, and the nurse is still picking up coffee. Virtually none of those patrons realize that the roadside parcel has traded hands, that it now belongs to a publicly traded REIT assembling hundreds of similar properties, or that the enterprise traces its corporate lineage to an Ohio builder who erected Kmart boxes in the 1960s.
The strategic irony is central to the enterprise: an organization that nearly collapsed under the weight of oversized big-box retail has anchored its next chapter to the commercial sector's smallest physical bays.
Lesson 1: The Micro-Asset Arbitrage
Institutional capital routinely bypasses small commercial properties because the due diligence and transaction costs per asset are disproportionate to the capital deployed. An operator that successfully industrializes the acquisition workflow can assemble a differentiated portfolio, but Curbline's operating record indicates that the advantage stems from sourcing speed and execution certainty rather than pricing discounts, given management's acknowledgment that the company pays full market value for multi-property transactions without capturing portfolio concessions.19 The structural takeaway is narrower than the conventional roll-up thesis: small-format assets are not inherently mispriced; they are simply accessible primarily to buyers willing to underwrite the corporate overhead required to aggregate them.
Lesson 2: Unbundling Can Reveal Different Economics
Curbline's formation illustrates how blending disparate property types within a single public vehicle can obscure the unit economics of higher-performing assets. Carving out the roadside convenience portfolio isolated an operating model characterized by premium base rent per square foot alongside structurally modest capital expenditure obligations.317 Yet corporate unbundling carries distinct frictions: dual administrative overhead, ongoing shared services arrangements, and executive attention divided across simultaneous public mandates. Corporate separation highlights underlying asset quality, but it does not manufacture economic value on its own.
Lesson 3: The Balance Sheet as a Weapon, and a Clock
Launching with $800 million in unrestricted cash and zero debt afforded Curbline closing velocity and reputational credibility with private sellers.1 Yet that initial balance-sheet runway was largely deployed within two years, transitioning Curbline into a conventional REIT reliant on ongoing access to public debt and equity markets. The historical experience of Developers Diversified Realty underscores that a pristine balance sheet serves as an offensive weapon only as long as capital remains abundant. The enterprise that faced near-liquidation in 2009 carrying over $5.1 billion of consolidated debt operated with leverage in the low-20% range by mid-2026.619 Whether management preserves that balance-sheet discipline when capital markets tighten will ultimately determine whether Curbline matures into a durable compounding platform or remains an episodic roll-up that capitalized on a favorable market window.
References
-
Curbline Properties Corp. Form 8-K: Completion of Separation from SITE Centers — SEC EDGAR, 2024-10-01 ↩↩↩↩↩↩↩↩↩
-
SITE Centers Completes the Spin-Off of Curbline Properties Corp. — Business Wire, 2024-10-01 ↩
-
Curbline Properties Corp. Form 10-Q for the Quarter Ended September 30, 2024 — SEC EDGAR, 2024-11 ↩↩↩↩↩↩↩
-
History of Developers Diversified Realty Corporation — FundingUniverse ↩↩↩↩↩
-
Scott A. Wolstein to Step Down as Executive Chairman of the Developers Diversified Realty Board of Directors — PR Newswire, 2011-02-15 ↩↩↩
-
Developers Diversified Realty Third Quarter 2009 Results (Exhibit 99.1) — SEC EDGAR, 2009 ↩↩↩↩↩
-
German Investor Buys Low, Takes $112M Stake in DDR — Commercial Property Executive, 2009-02-25 ↩↩↩↩↩↩
-
DDR to Change Name to SITE Centers Corp. — Nareit, 2018-10-09 ↩↩↩
-
Executive and Board Bios — Curbline Properties Corp. ↩↩↩↩↩↩↩↩↩
-
Alexander Otto Schedule 13D/A Regarding Curbline Properties Corp. — SEC EDGAR, 2026-08 ↩↩
-
David Lukes Named DDR's President and Chief Executive Officer — PR Newswire, 2017-03-03 ↩↩↩
-
DDR Spins Off $3 Billion Portfolio into Separate Publicly Traded REIT — Jones Day, 2018-07 ↩↩
-
SITE Centers First Quarter 2020 Results (Exhibit 99.1) — SEC EDGAR, 2020-04-30 ↩↩
-
SITE Centers Enacts Reverse Stock Split — Investing.com, 2024-08 ↩
-
SITE Centers Announces Spin-Off of Convenience Portfolio (Exhibit 99.1) — SEC EDGAR, 2023-10-30 ↩↩↩↩↩↩↩↩↩↩
-
Fitch Rates Curbline Properties' Sr. Unsecured Notes 'BBB' — MarketScreener, 2025 ↩↩↩↩↩↩↩↩↩
-
Curbline (CURB) Q4 2025 Earnings Call Transcript — The Motley Fool, 2026-02-09 ↩↩↩↩↩↩↩↩↩
-
Curbline Properties (CURB) Q2 2026 Earnings Call Transcript — The Motley Fool, 2026-07-28 ↩↩↩↩↩↩↩↩↩↩↩↩↩↩↩↩↩↩↩↩↩↩↩↩↩↩↩↩↩↩↩↩↩↩↩
-
Curbline Properties Reports Second Quarter 2026 Results (Exhibit 99.1) — SEC EDGAR, 2026-07-28 ↩↩↩↩↩↩↩↩↩↩↩↩↩
-
SITE Centers to Sell Remaining Properties After $3.7 Billion in Asset Sales — Investing.com, 2025 ↩↩↩↩
-
Curbline Properties Corp. Form 10-K for the Year Ended December 31, 2025 — SEC EDGAR, 2026 ↩↩↩↩↩↩↩
-
Curbline Properties Reports Fourth Quarter 2024 Results — Curbline Properties Corp., 2025-02-11 ↩↩↩↩
-
Curbline Properties Reports Fourth Quarter and Full Year 2025 Results — Curbline Properties Corp., 2026-02-09 ↩↩↩↩↩↩↩↩
-
Curbline Properties Q2 Earnings Call Highlights — Yahoo Finance, 2026-07 ↩↩↩↩↩↩↩
-
Curbline Properties Reports First Quarter 2026 Results (Exhibit 99.1) — SEC EDGAR, 2026-04-28 ↩
-
Curbline Properties Reports Second Quarter 2026 Results — Yahoo Finance, 2026-07-28 ↩
-
Curbline Properties Announces $150 Million Private Placement of Senior Notes — Investing.com, 2025-06-26 ↩↩
-
Curbline Properties Corp. Form 8-K: Note Purchase Agreement — SEC EDGAR, 2025-11-12 ↩↩
-
Curbline Properties 2026 Definitive Proxy Statement Summary — StockTitan, 2026 ↩↩
-
Curbline Properties Corp. (CURB) Raises its Quarterly Dividend by 6% to 17c Per Share — Yahoo Finance, 2026-02-24 ↩
 LinkedIn
 WhatsApp
 Reddit
 Hacker News
 Email
Email Kindle
 RSS Feed
 Spotify
 Apple Podcasts
 Amazon Music
 Audible
 YouTube