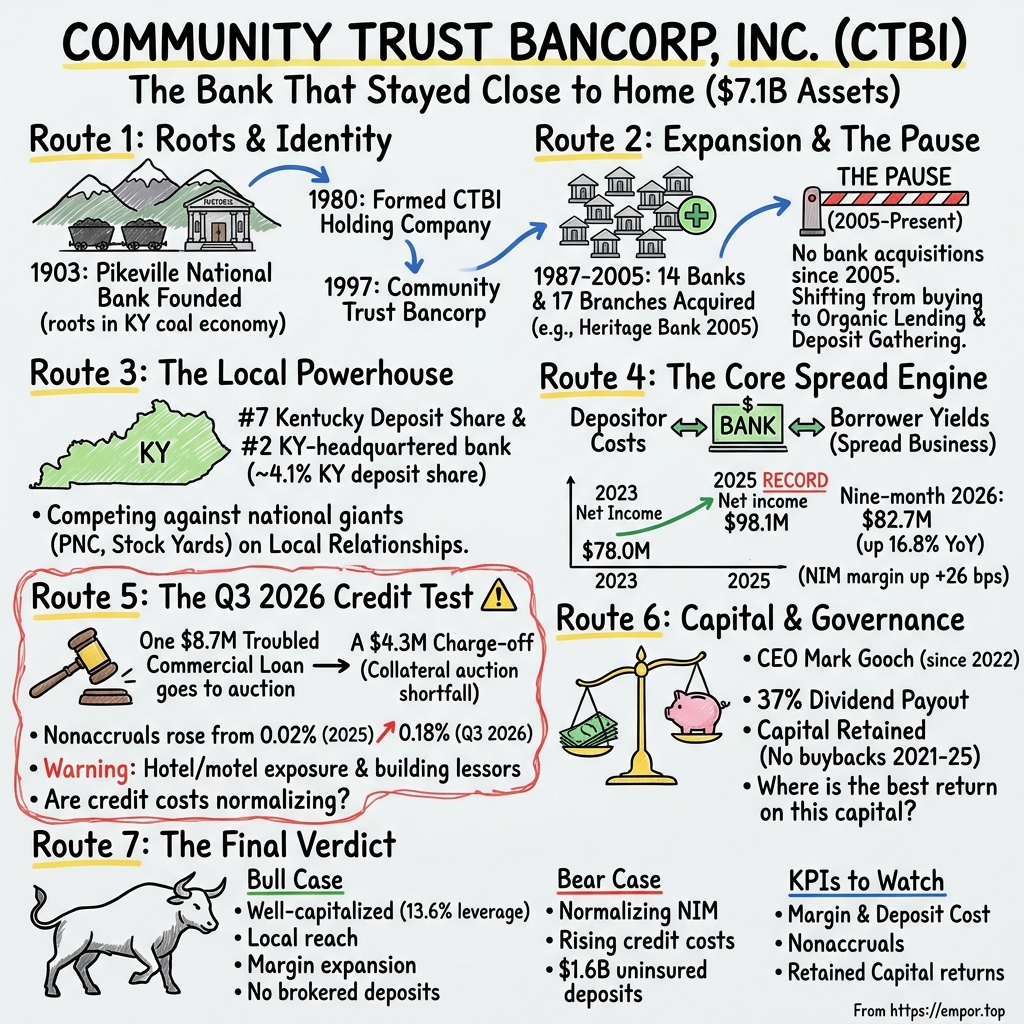
Community Trust Bancorp: The Bank That Stayed Close to Home
I. A Record Year, Then a $4.3 Million Reminder
In January 2026, Community Trust Bancorp got to use a word that banks of its kind do not get to use often. Earnings for 2025, the company told shareholders, were "a record": $98.1 million of net income, up from $82.8 million the year before, or $5.44 for every share.1 For a bank holding company headquartered in Pikeville, Kentucky, a small town in the hills of the Big Sandy Valley, that was a big number. It was the payoff of a two-year climb out of a slump, and it arrived with the balance sheet growing, the margin widening and the efficiency ratio falling. Almost every dial on the dashboard pointed the right way.
Nine months later, a different kind of number came out of an auction.
The borrower was a commercial relationship worth about $8.7 million. CTBI had already flagged it as a loan more than 90 days past due but still accruing interest and in collection, which in banker's language means: the payments have stopped, but we think the collateral covers us. At the end of June 2026, management's analysis still suggested the loan was well secured. Then, in September, the collateral went under the hammer. The winning bid was, in the company's words, "significantly lower" than expected, and CTBI wrote off $4.3 million.2 Nothing about the borrower or the property was named. What the market saw was the arithmetic: a loan the bank believed was safe in June lost roughly half its value in September.
That single loss was not a crisis. CTBI still earned $25.9 million in the third quarter of 2026 and $82.7 million across the first nine months, up 16.8% on the same stretch of 2025.2 But the quarter's net charge-offs jumped to $6.6 million, an annualized 0.50% of average loans, against just 0.07% in the quarter before, and provision expense more than tripled.2 Profit fell from $29.6 million in the second quarter to $25.9 million in the third.2 The record year had met its first hard reminder that a bank's profit is only an estimate until the loans are repaid.
The scale of the institution matters for understanding why one auction gets this much attention. CTBI is a bank holding company with about $7.1 billion of assets, roughly $5.3 billion of loans and about $6.0 billion of deposits including repurchase agreements, as of September 30, 2026.2 Its business is banking, almost entirely: a commercial bank, Community Trust Bank, and a trust company, Community Trust and Investment Company, operating only in the United States.3 It has no fintech platform, no credit-card empire, no investment-banking arm. It takes deposits from people and businesses in Kentucky, West Virginia and Tennessee, lends them out, and earns the difference. When something goes wrong in a business that simple, there is nowhere for the problem to hide.
So the story of CTBI comes down to three questions, and the auction sharpened all of them. The first is what actually changed to lift earnings from $78.0 million in 2023 to a record in 2025.1 Was it a better bank, or a kinder interest-rate environment? The second is what the local franchise is really worth: a century-old name in Appalachian Kentucky is a good story, but a good story is not the same thing as a moat. The third is whether management can keep returns steady as credit costs climb back toward normal, because they have been climbing, quietly, for four years.
To answer those questions, the story has to start where the bank did: in a coal-country town in 1903.
 Subscribe on LinkedIn
II. Pikeville Was the Beginning, Not the Whole Story
Pikeville sits in a narrow bend of the Levisa Fork of the Big Sandy River, hemmed in by steep ridges, the seat of Pike County at Kentucky's eastern edge. In 1903, Pikeville National Bank opened its doors there.4 It was a small-town bank in a region whose fortunes would come to rise and fall with coal.
The founding date is the kind of fact that banks like to put on their letterhead, and it is easy to treat a century of survival as a victory lap. The more useful way to read it is as a description of the bank's original customer. A bank in a coal-country county seat lends to the people who build stores and houses, finance trucks and equipment, and run the businesses that follow paychecks. It gathers deposits from families whose savings, in good years and bad, tend to stay close to home. The economics of that kind of bank are shaped by the economy around it, and the economy around Pikeville has spent most of the past half-century shrinking.
CTBI does not hide from this. In its 2025 annual filing, the company told investors that its markets include areas where the coal industry was historically a significant part of the local economy, and that coal's importance there has continued to decline substantially.3 It added that unemployment in many of its markets remains above the national average and that those markets have seen a lack of population and business growth in recent years.3 That is an unusually candid thing for a bank to say about its home turf, and it explains much of what happened next. A bank that wanted to grow could not rely on Pike County to grow for it.
The first step out was structural. In 1980, the bank's owners incorporated a Kentucky holding company to sit above it, which gave them a vehicle that could own more than one bank.3 Bank holding companies were the standard tool of the era for exactly this purpose: state branching laws limited how far a single bank could spread, but a holding company could buy other banks and run them as affiliates. For a Pikeville institution, the holding company was a passport.
The second step was a name. For most of its life, the company was identified with the town where it began. In 1997, it changed its name to Community Trust Bancorp, Inc.4 The new name said less about a place and more about a promise. "Community" told customers in Lexington or Ashland that the bank was theirs too, not a Pikeville outpost. "Trust" pointed to the fiduciary business it was building alongside the bank. By then, the company had already been buying banks for a decade, and the old name no longer described what it had become.
What it had become was a regional bank built from local ones. Today CTBI serves customers from 81 locations in 37 counties across Kentucky, Tennessee and West Virginia, including five trust offices.4 Its headquarters is still at 346 North Mayo Trail in Pikeville.3 The company organizes its Kentucky franchise into regions with names that read like a map of the state's eastern half: Eastern, Northeastern, Central, South Central, plus markets it calls Tug Valley and Advantage Valley on the West Virginia border.4
One detail in that map tells the story of how the old and new halves of the bank fit together. At the end of 2025, the Eastern region, the original Pikeville heartland, held about $2.2 billion of deposits but only about $1.0 billion of loans. The Central region, which includes Lexington, held about $1.5 billion of deposits and $1.2 billion of loans, and South Central held about $1.2 billion of each.4 Put simply, the mountain counties where the bank was born are now its savings account. Their deposits, gathered in places with slow economic growth and long-standing loyalty, help fund lending in the faster-growing parts of the state.
That is the enduring choice that runs through the whole story. CTBI did not grow by becoming a national consolidator or by chasing distant markets. It grew by acquiring local institutions in towns not unlike Pikeville, then folding them into one banking platform under one name, while keeping the deposit base close to home. The question was always whether that strategy built something durable, or simply something bigger. The answer begins with an eighteen-year buying spree.
III. Fourteen Banks, Then a Long Pause
Danville, Kentucky, is a college town of brick storefronts in the Bluegrass, about 150 miles west of Pikeville. On June 10, 2005, its local bank, Heritage Community Bank, stopped being a separate institution. From then on, its offices operated as branches of Community Trust Bank.5 Customers kept their tellers and their loan officers. What changed was the name on the door and the balance sheet behind it.
The Heritage deal was small, and that is exactly why it is useful. CTBI acquired about $73.7 million of loans and $69.8 million of deposits, plus roughly $8.1 million of cash.5 The total cost, including direct acquisition costs, was $12.4 million.5 About $5.5 million of that, more than 40%, was booked as goodwill and a core deposit intangible.5 Those two accounting lines are what a buyer records when it pays more than the fair value of the assets it receives. In a bank deal, the premium is mostly a payment for relationships: depositors who will probably stay, borrowers who will probably renew, and a branch presence that would take years to build from scratch. CTBI was paying for Danville's loyalty.
Heritage was the end of a long run. From 1987 through 2005, CTBI acquired 14 banks and purchased 17 branch locations.4 Each deal followed the same template the Heritage transaction illustrates: buy a local institution, keep its people and offices, convert it to the CTBI platform, and use the combined scale to spread technology, compliance and management costs across a larger base. By September 2005, the company had grown to about $2.8 billion of assets.5 That passport had turned into a regional franchise.
The popular version of this story stops there: CTBI bought its way across eastern and central Kentucky, then stopped buying in 2005 and became an organic grower. The record is slightly more complicated. In 2010, CTBI acquired LaFollette First National Corporation, which took the bank into Tennessee.4 So the pause was not absolute. But it is fair to say that the era of serial acquisitions ended in the mid-2000s. The company's own corporate history lists no bank acquisition after LaFollette, and its presentation in 2026 still frames its corporate history around the fourteen banks and seventeen branches of 1987 to 2005.4
Did those deals create value? The honest answer is that the disclosures do not settle it. The Heritage filing gives the price and the balance sheet acquired, which is more than many small-bank deals reveal. But CTBI never reported Heritage's earnings separately after the merger, and the same is true of the others. Without that, an investor cannot compute the return on the $12.4 million. What can be said is that a premium of more than 40% for a small community bank was not a bargain-basement price, and that the deals were a bet that local relationships would stay put after the name changed. The fact that the Danville market remains part of CTBI's map twenty years later suggests the relationships largely did.4
There is one comparison that does carry weight. In the third quarter of 2005, at the tail of the acquisition era, CTBI earned a return on average equity of 14.5% and a net interest margin of about 4.1%.5 In 2025, its record year, return on equity was 12.07% and the margin was 3.62%.1 The bank is roughly two and a half times bigger than it was in 2005, and its earnings are much larger, but each dollar of shareholder capital earns less than it did then. Some of that decline is the industry, not CTBI: margins across American banking compressed during the long era of near-zero rates after 2008. But it means that growth since the acquisitions stopped has mostly enlarged the bank rather than improved its returns.
So what replaced acquisitions? Management's answer, in its 2026 investor presentation, is a list that sounds sensible and conservative: quality loan growth, low-cost deposit growth, branch expansion in growth markets and more noninterest income.4 The same presentation also describes the business model as "organic growth expectations combined with de novo branching and acquisition."4 That last word matters. The company has not ruled out buying again; it simply has not done so in fifteen years. Investors are left with an open question about whether the pause is a strategy or a waiting room.
The practical consequences are easier to see than the intention. Without deals, CTBI's growth since 2005 has come from three places: more lending in its existing markets, more deposits gathered in those markets, and capital retained from earnings rather than paid out. That combination produces a bigger balance sheet almost automatically, because retained capital supports more loans. Whether it produces better returns depends on what the bank earns on each loan, net of what it pays for each deposit. That spread is the engine at the center of this business, and it is worth taking apart piece by piece.
IV. The Spread Between a Borrower and a Depositor
Picture two customers walking into the same CTBI branch on the same morning. One is a small-business owner in Lexington who needs a loan to buy the building her company has been renting. The other is a retiree in Hazard with a few hundred thousand dollars in a savings account, who has been reading about money-market funds paying more than his bank does. The first wants to pay as little interest as possible. The second wants to earn as much as possible. Everything CTBI earns, more or less, comes from standing between them and keeping the difference.
That is the simplest way to understand a bank's income statement, and it is worth translating line by line, because the terms can obscure what is really going on. At the top is interest income: what the bank earns from loans and from the bonds it holds in its securities portfolio. Below that is interest expense: what it pays depositors and other lenders. The difference is net interest income, the spread. Then come fees, which banks call noninterest income: service charges on deposit accounts, trust and wealth-management fees, loan fees and a handful of smaller lines. Subtract the cost of running the bank, which banks call noninterest expense: salaries, branches, technology. Finally, subtract the provision for credit losses, which is the bank's estimate of how much of its loan book it will never get back. What is left, after taxes, is profit.
In 2025, CTBI's two revenue lines added up to about $282.6 million: roughly $219.0 million of net interest income and $63.6 million of noninterest income.1 The spread was the engine, generating more than three-quarters of revenue. Fees were the supporting cast. That ratio tells an investor where to look first.
The fee business deserves a quick inventory before turning to the spread. The two largest fee lines in 2025 were deposit-related fees, at about $29.8 million, and trust and wealth management, at about $16.8 million.3 Gains on selling loans and securities were small, and the catch-all "other" line was about $6.1 million.3 That shape is reassuring in one way: the fees come from recurring customer activity rather than trading. It is limiting in another: total noninterest income grew only 1.7% in 2025, because the biggest fee line, deposit service charges, was almost flat.1 The growth was in trust, which rose 12.4%.1 The fee side is steady but not a second engine.
Now the spread. In 2025, net interest income rose 17.7%, and the net interest margin, which is net interest income divided by the bank's earning assets, rose 26 basis points, from 3.36% to 3.62%.1 A basis point is one-hundredth of a percentage point, so 26 of them may sound trivial. They are not. On roughly $6 billion of earning assets, each basis point of margin is worth about $600,000 of annual revenue, so the 26-point improvement was worth something like $15 million a year before taxes. That is the single biggest reason earnings hit a record.
The more important question is where those 26 basis points came from, because there are two very different stories they could tell. In one, CTBI got better at lending: it priced loans more sharply and earned more on its assets. In the other, CTBI paid depositors less as the interest-rate environment shifted. The numbers point decisively to the second. The yield on CTBI's earning assets edged up from 5.65% to 5.71% in 2025, a gain of six basis points. The rate it paid on interest-bearing liabilities fell from 3.30% to 2.95%, a drop of 35 basis points.1 Most of the margin improvement came from the cost side of the ledger.
There is an important reason this happened, and it says something about the business. When the Federal Reserve raised interest rates sharply in 2022 and 2023, banks across the country had to pay more to keep deposits, because customers like the Hazard retiree could suddenly earn 5% in a money-market fund. CTBI's funding costs rose, and its margin was stuck near 3.32% in both 2022 and 2023.4 But a bank's loans and securities reprice more slowly than its deposits. Fixed-rate loans made in 2019 or 2020 at low rates matured over time and were replaced by new loans at higher rates, while deposit costs eventually stopped rising and then fell as the Fed began cutting. The result is a lag: margin pain arrives first, and margin relief arrives later. CTBI's quarterly margin captured that lag almost perfectly, climbing from 3.39% in the third quarter of 2024 to 3.67% in the fourth quarter of 2025.4
Volume mattered too, and it is worth separating from repricing. Loans grew $408 million, or 9.1%, during 2025, and deposits including repurchase agreements grew 7.3%.1 A bigger loan book earns more interest even at the same margin. So the 17.7% rise in net interest income was a combination of a wider spread on each dollar and more dollars. Roughly speaking, the margin explains less than half of the gain and growth explains the rest.
Then came 2026, which offered a live test of whether the improvement would last. In the first half, it kept going. The margin hit 3.80% in the second quarter.2 Then, in the third quarter, it slipped to 3.63%, a drop of 17 basis points in three months.2 Again, the decomposition matters. The yield on earning assets fell from 5.68% to 5.63%, while the rate paid on interest-bearing liabilities rose from 2.64% to 2.78%.2 The tailwind that had powered 2025 reversed direction for at least one quarter: CTBI paid more to keep its funding while earning slightly less on its assets. The company did not explain the reversal in its release, which carried no management commentary and no forward guidance.2
The nine-month picture still looks strong. Net interest income for the first nine months of 2026 was up 12.3% year over year, and the margin for the period averaged 3.74%, against 3.61% in the same period of 2025.2 Noninterest income rose about 10%, with trust and wealth management up about 14%.2 And because expenses grew more slowly than revenue, the efficiency ratio, which measures how many cents the bank spends to earn each dollar of revenue, improved to about 47.5% for the nine months from about 51.1% a year earlier.2 That is a meaningfully leaner bank. But provisions for credit losses were also up, to $14.3 million for the nine months from $9.5 million.2 Stronger income continued, in other words, but a larger slice of it was being set aside against bad loans.
One more piece of bank translation is needed, because investors who come from industrial companies sometimes reach for the wrong scorecard. In a manufacturer, the gold-standard test is whether profits turn into cash from operations. For a bank, that test is close to meaningless. CTBI's consolidated cash flow statement showed $105.0 million of operating cash flow against $98.1 million of net income in 2025, which looks healthy, but the numbers that actually matter for a bank sit elsewhere in the statement.3 Making a loan shows up as an investing outflow. Taking a deposit shows up as a financing inflow. Buying bonds is investing. A bank growing quickly can show negative cash flow and be perfectly healthy, and a bank shrinking can show large positive cash flow while its franchise erodes. The right tests are liquidity, meaning how much cash and readily sellable securities the bank has against what depositors could withdraw, and capital, meaning how much loss it can absorb. Those come later in the story.
The investment question, then, is concrete. Can CTBI keep growing loans and fees without paying too much for deposits or weakening its underwriting? The third quarter of 2026 gave mixed early evidence on all three fronts: loans grew at an annualized 13.8% in the quarter, funding costs rose, and the auction loss appeared.2 That brings the story to the people on the other side of the counter and to why they choose CTBI at all.
V. A Local Franchise in a Crowded Market
Every CTBI customer has options, and most of them know it. The small-business owner in Lexington can walk across the street to a branch of a national bank with a famous brand, a slick app and a balance sheet many times CTBI's size. She can call a Louisville-based regional competitor that also courts Kentucky businesses. The retiree in Hazard can open a high-yield savings account at an online bank in ten minutes from his kitchen table, or move his money into a brokerage money-market fund without ever setting foot in a branch. The question for CTBI is not whether customers can leave. It is why they stay.
Start with what CTBI's position actually is. On the company's own description, it is the third-largest bank holding company domiciled in Kentucky, second in deposit market share among Kentucky-domiciled FDIC-insured institutions, and seventh in the state among all FDIC-insured institutions, based on deposit data as of June 30, 2025.4 That positioning is telling in both directions. Being seventh statewide means CTBI is a real force but not the dominant one: several larger institutions, most of them headquartered elsewhere, hold more Kentucky deposits. Being second among home-state banks means that when a Kentucky customer wants a bank whose decisions are made in Kentucky, CTBI is one of a very small number of serious choices.
The statewide ranking also understates what matters most, which is local share. Banking competition happens county by county, sometimes town by town. In the eastern Kentucky counties where CTBI was born, its long presence and the thinning of other competitors over the decades likely give it a much heavier position than its statewide share suggests. That is consistent with the regional map, in which the Eastern region holds more than twice as many deposits as loans.4 In Lexington or northeastern Tennessee, CTBI is one challenger among many. A fair description is that CTBI is a heavyweight in its home hills and a mid-sized competitor everywhere else.
The structure of the competition is worth laying out plainly. National banks bring brand recognition, enormous technology budgets and the full menu of products a large business might need, from treasury management to foreign exchange. Kentucky and regional banks compete on the same thing CTBI sells: local decision-making and relationships with bankers who know the market. Credit unions compete for consumer deposits and auto loans, often with tax advantages. And digital providers have widened the alternatives for deposits and payments in a way that did not exist twenty years ago. CTBI's own filing lists state and national banks, thrifts, trust companies, insurance companies, mortgage bankers, credit unions, finance companies and brokerage firms among its competitors for deposits, loans and trust relationships.3 That is a crowded field by any measure.
A moat is a structural reason customers cannot or will not leave even when a rival offers a better price. The classic sources of moats in banking are deposit stickiness, which comes from switching costs and inertia; local underwriting knowledge, which lets a bank lend profitably where outsiders cannot; trust relationships that span generations; and regulatory barriers that keep new competitors out. Testing each one against CTBI's evidence is the best way to separate a durable advantage from a good story.
Deposit stickiness is the most important test, and the 2022–23 rate cycle provided a natural experiment. When rates rose, customers who were sensitive to price had every incentive to move. CTBI's funding costs did rise, and its margin stalled for two years.4 Then, in 2025, the cost of its interest-bearing liabilities fell 35 basis points while asset yields held roughly flat.1 That pattern suggests CTBI's depositors are not fully price-insensitive, but also that the bank did not lose the war for funding. About 22% of its deposits, roughly $1.25 billion at September 2026, sat in noninterest-bearing accounts, money on which CTBI pays nothing.2 Those accounts are the cheapest funding a bank has, and they are a sign of operating relationships: payroll accounts, business checking, the account a family has had for decades. But the company does not publish a deposit beta, the measure of how much of each rate change it passes through to depositors, nor any comparison of that pass-through against peers. Without that, the case for unusually sticky deposits remains plausible but unproven.
Borrower choice is the second test. A bank with real pricing power can charge more for loans than competitors, or win business at the same price because of speed, flexibility or local knowledge. CTBI's asset yield rose only modestly in 2025 and slipped in the third quarter of 2026.12 Its loan growth has been strong, about 10.6% over the year to September 2026, with commercial nonresidential real estate up about 15% and residential mortgages up about 15%.2 Growing that fast can be a sign of strong demand and good relationships. It can also be a sign of winning loans by being a little looser on price or terms than the competition. The company does not disclose win rates, lost bids or loan yields compared with peers, so an investor cannot tell which. What can be said is that fast growth into a period of rising charge-offs is a combination to watch closely.
Local underwriting knowledge is the third test, and the auction loss is, uncomfortably, the most recent piece of evidence. The premise of a community bank is that its lenders understand local collateral and local borrowers better than a distant underwriter could. A loan that was judged well secured in June and lost roughly half its value at auction in September does not disprove that premise, because every bank misjudges collateral sometimes. But it does show that local knowledge is not a shield against a falling market.
Trust relationships are the fourth, and they are the most distinctive asset CTBI has. Community Trust and Investment Company manages about $4.1 billion of assets, including $1.1 billion held for the bank itself.4 Trust and wealth relationships tend to be sticky: they involve estates, family planning and long-term fiduciary duties that customers are reluctant to move. The fiduciary role is also visible in the shareholder register, where Community Trust and Investment Company appears as the largest holder of CTBI stock, at about 10.9%, through trust, ESOP and 401(k) accounts it administers for beneficiaries.6 The trust business grew fees 12.4% in 2025 and about 14% in the first nine months of 2026.12 It is a genuinely useful franchise. But at roughly $17 million of annual revenue against $219 million of net interest income, it is a complement to the loan book, not a second engine.1
Regulation is the last test, and it cuts both ways. Starting a new bank in the United States requires capital, regulatory approval and years of patience, which does protect incumbents from new local entrants. But regulation does nothing to keep out national banks already licensed nationwide, or digital competitors with established charters, which are precisely the competitors that threaten CTBI's deposit base.
Technology deserves a word in proportion. CTBI has been investing: its data-processing expense rose from about $9.7 million in 2023 to $12.6 million in 2025, while full-time equivalent staff fell from 998 in 2020 to 930 at the end of 2025.37 That pattern suggests technology is replacing some labor, which helps explain the improving efficiency ratio. Artificial intelligence and automation may further change how CTBI handles fraud detection, customer service and back-office work. But there is no evidence that technology creates a new profit pool for a bank like this one. It is a cost of staying competitive, and the national banks spend far more on it. Cybersecurity risk travels with that dependence: CTBI disclosed a data breach at a third-party vendor in 2023, though it reported no breach of its own systems.3
Put it all together, and the verdict is measured. CTBI has meaningful local scale, especially in eastern Kentucky, and a trust business that deepens customer relationships. But statewide share and branch presence alone do not prove a moat, and the evidence that would prove one, retention rates, deposit pricing against peers, loan returns against peers, is not something the company publishes. What the evidence does show is that CTBI's earnings swing with the rate cycle like any bank's. The question is how much of the recent surge was franchise and how much was cycle.
VI. When Higher Rates Became Higher Earnings
There is a version of CTBI's recent history that sounds like a classic turnaround: a long-serving chief executive retires, a new leader takes over, earnings dip, and then the new team drives them to a record. It is a tidy story. The record suggests it is mostly the wrong one.
Start with the timeline. In 2021, CTBI earned $87.9 million, a strong year flattered by a pandemic economy in which loan losses almost vanished: the bank's net charge-off ratio that year was effectively zero.43 Then earnings fell, to $78.0 million by 2023.1 Over the next two years they climbed again, to $82.8 million in 2024 and the $98.1 million record in 2025, an 18.4% jump in the final year.1 Earnings per share told the same story, falling from $4.94 in 2021 to $4.36 in 2023 before rising to $5.44 in 2025.4 In the first nine months of 2026, EPS reached $4.58, against $3.93 a year earlier.2
That V-shape is precisely the pattern the rate cycle would predict for a bank with CTBI's balance sheet. In 2021, deposit costs were near zero. In 2022 and 2023, the Federal Reserve raised rates at the fastest pace in four decades, deposit costs jumped, and the margin stalled at about 3.32% in both years.4 Meanwhile, the bank's credit costs began to rise from their pandemic lows. By 2024 and 2025, the lag between asset repricing and deposit repricing turned in CTBI's favor, and the margin widened to 3.62%.4 Earnings followed the margin down, and then followed it up.
The leadership change happened in the middle of all this. In July 2021, CTBI announced that its chief executive, Jean Hale, would retire and that Mark Gooch would succeed her.8 Gooch took over as vice chairman, president and chief executive officer of the holding company effective February 7, 2022.6 It is tempting to divide the record into a Hale era, covering the growth of 2016 to 2021, and a Gooch era, covering the dip and the record. But that division overstates the change. Gooch had been president and chief executive of the bank subsidiary, Community Trust Bank, since July 1999.6 He had been running the bank, in a meaningful sense, for more than twenty years under Hale before he became the top executive of the holding company. The 2022 transition was a promotion within a long-standing team, not a new regime. That makes it hard to credit the recovery to a change in leadership, and equally hard to blame the 2023 dip on one.
The decade-long base rate gives a useful yardstick. From 2016 to 2025, CTBI's net income rose from $47.3 million to $98.1 million, a compound annual growth rate of about 8.4%.91 The revenue proxy, net interest income plus fees, grew more slowly, from about $181.5 million to $282.6 million, roughly 5.1% a year.91 The gap between the two growth rates is itself informative. Profits grew faster than revenue largely because costs and taxes took a smaller bite: the bank's staff count fell while its balance sheet grew, and the federal corporate tax rate was cut during the period. Those gains are real, but they are mostly one-time steps rather than a repeatable engine.
Against that decade-long trend of about 8% profit growth, the most recent stretch stands out. Earnings rose about 26% from 2023 to 2025, or roughly 12% a year, and then grew another 17% in the first nine months of 2026.12 The acceleration is real. But its main reported driver was the margin expansion analyzed earlier, and that expansion came mostly from falling funding costs, not rising loan yields. That is a favorable rate phase doing much of the work.
The case for genuine operational improvement rests on the expense side. The efficiency ratio fell from about 54.3% in 2023 to 50.5% in 2025, and to about 47.5% in the first nine months of 2026.42 A bank spending 47 cents to earn each dollar of revenue is meaningfully leaner than one spending 54 cents, and part of that improvement came from expense control rather than only revenue growth. In the third quarter of 2026, for example, personnel costs fell by about $1.5 million from the second quarter, helped by lower group medical and life insurance costs.2 That kind of saving is welcome but not necessarily repeatable: health-care costs can move against a bank as easily as for it.
There is also a less flattering comparison that the record-earnings headline obscures. Return on equity in 2025 was 12.07%, a solid number but below the 12.88% the bank earned in 2021.4 In other words, CTBI's record profit came on a bigger equity base, and each dollar of shareholder capital earned slightly less than it had four years earlier. That is the natural consequence of retaining most earnings, a pattern that becomes central later in this story. In the first nine months of 2026, return on equity improved to about 12.5%, still below the 2021 level.2
The quarterly pattern through 2026 provides the sharpest test of the favorable-rate explanation. If the margin gains were purely a lagged effect of the rate cycle, they should eventually plateau as the bank's older, low-yielding assets finish repricing and as deposit costs find a floor. The 3.80% margin of the second quarter of 2026 and the drop to 3.63% in the third, driven by rising funding costs, are consistent with a cycle that is maturing.2 One quarter is not a trend. But it is the first time in more than two years that the margin moved meaningfully the wrong way.
Management's own goals offer a benchmark for what the company expects next. In early 2026, CTBI presented goals for the year of $105.1 million to $109.3 million of net income and $5.78 to $6.02 of EPS.4 After nine months, it had earned $4.58 per share.2 Reaching the bottom of that range requires about $1.20 in the fourth quarter, and the top requires about $1.44. The third quarter, with its auction loss, produced $1.43.2 So the goals remain within reach even if the fourth quarter looks like the third. That is a reasonable record of target-setting so far. But it also means the year's outcome now depends on whether the fourth quarter brings more credit surprises.
The conclusion is straightforward. The recovery is stronger than the decade-long trend, and some of it reflects a leaner bank. But the main reported lift came from net interest income and margin expansion in a favorable rate phase. The case for durable improvement depends on what the bank earns once funding costs settle and provisions return to normal. And it was exactly at that point, in September 2026, that the collateral went to auction.
VII. The Collateral Was Worth Less at Auction
Every commercial loan begins with a story about what happens if things go wrong. The borrower signs documents pledging collateral, a building, equipment, land or receivables, and the bank's lender writes a memo estimating what that collateral would fetch in a sale. As long as the borrower pays, the estimate never gets tested. When the borrower stops paying, the estimate becomes the only thing standing between the bank and a loss.
The $8.7 million commercial relationship remained accruing after 90 days past due, a status allowed when a loan is well secured and in collection.2 Management's analysis still considered it well secured at the end of June 2026.2 The September auction then produced a significantly lower-than-expected bid, and CTBI recorded a $4.3 million charge-off.2
That sequence is worth slowing down on, because it shows how a delinquency becomes a loss. An appraisal or internal valuation is an opinion about what an asset is worth in an orderly sale. An auction is a fact about what someone will pay right now. The gap between the two is the risk that every secured lender carries and rarely sees until the hammer falls. A bank can be right about a borrower's character and right about the collateral's value in a normal market, and still lose money if it has to sell into a thin market of bidders. CTBI did not disclose the type of collateral or the borrower's industry, so investors cannot judge whether the shortfall reflects a specific asset or a broader decline in values.
The auction loss drove most of the third quarter's credit numbers. Net charge-offs for the quarter totaled about $6.6 million: about $5.0 million was commercial, about $1.3 million came from consumer indirect lending, which mostly means auto loans made through dealers, and about $0.3 million came from consumer direct lending.2 The annualized charge-off rate of 0.50% compared with 0.07% in the second quarter and 0.23% a year earlier.2 For the first nine months, the rate was 0.23%, up from 0.16% in the same period of 2025.2
The longer view is more revealing than any single quarter. CTBI's annual net charge-off ratio was effectively zero in 2021, then rose to 0.02% in 2022, 0.08% in 2023, 0.13% in 2024 and 0.16% in 2025.4 That is four straight years of rising credit costs, from an unsustainably low pandemic level toward something more normal. The auction did not start that trend; it punctuated it. Whether the trend levels off, or keeps rising, is the single most important variable for CTBI's earnings in the next few years.
Nonaccrual loans tell a mixed story. At September 30, 2026, they stood at about $9.5 million, or 0.18% of total loans, up sharply from 0.02% at the end of 2025.10 That jump sounds alarming, and it does mean more loans have stopped paying interest this year. But context helps: nonaccruals were about $15.6 million a year earlier, at September 30, 2025, and about $10.8 million at the end of June 2026.2 So the level rose sharply during 2026 from an unusually clean year-end, but it is not out of line with where it sat a year ago. Total nonperforming loans, which include both nonaccruals and loans 90 days past due but still accruing, were about $22.5 million, down $7.3 million from June, mostly because the troubled relationship left the category when it was charged off.2 Early-stage delinquencies, loans 30 to 89 days past due, rose to about $23.1 million from $20.3 million in June and $18.5 million a year earlier.2 Foreclosed property held by the bank rose to about $5.2 million from $3.1 million at year-end.10 None of those figures is large against a $5.3 billion loan book. But several of them are moving in the same direction.
The allowance for credit losses is the bank's cushion against those trends, and it is worth understanding what it is and is not. The allowance is an estimate, made each quarter, of the losses the bank expects over the life of its current loans. At September 30, 2026, it stood at about $65.1 million, or 1.23% of loans, unchanged as a percentage from June and from a year earlier.2 It covered nonperforming loans 2.9 times.2 Those ratios sound comfortable, and by community-bank standards they are reasonable. But coverage ratios can mislead. The 289% coverage figure rose from 212% in June precisely because the troubled loan left the nonperforming category when it was charged off, which shrank the denominator.2 The ratio improved because a loss happened, not because the cushion got thicker.
The composition of the third-quarter provision also matters. In the bank's own breakdown of how the allowance moved during the quarter, new loan volume added about $6.1 million, while changes in historical loss rates and qualitative adjustments barely moved the total.2 The cushion grew mainly because the loan book grew, not because the bank decided its existing loans had become riskier. CTBI said as much: its provision rose because of higher net charge-offs and significant loan growth.2 That is a reasonable explanation, but it implies the bank is adding loans quickly at the same moment its credit losses are rising, a combination that has historically been where banks get into trouble.
The loan mix shows where future losses could come from. Hotel and motel loans totaled about $539 million at September 30, 2026, about a tenth of the loan book, up from about $498 million at year-end.10 At the end of 2025, hospitality credits equaled about 65% of the bank's Tier 1 capital plus allowance, a measure regulators use to gauge whether a single sector could threaten a bank's solvency.3 Lessors of residential and nonresidential buildings were the next-largest concentrations, at about 53% and 33% of the same measure.3 Hotels are a cyclical business, sensitive to travel demand and interest rates, and their value as collateral can fall quickly when occupancy drops. The good news is that CTBI recorded no hotel charge-offs in the first nine months of 2026.10 The concentration is a risk to watch, not a problem that has materialized.
The bank's auditor, BDO, had already flagged this area before the auction. In its report on the 2025 financial statements, BDO identified the allowance for credit losses as a critical audit matter, pointing in particular to management's judgments about economic conditions, delinquencies in nonresidential commercial real estate and consumer indirect loans, and collateral values.3 A critical audit matter is not a finding of error. It is the auditor's way of saying: this is where the numbers depend most on judgment, and where a reasonable person could reach a different answer. BDO gave a clean opinion on both the financial statements and internal controls.3 But it is striking that collateral values, the very estimate that failed at auction, were singled out as a source of judgment nine months earlier.
CTBI's credit practices, as the company describes them, include frequent delinquency reviews and a near-complete annual review of commercial loans.10 Those practices are sensible, and they may well be why the bank's losses have stayed modest by historical standards. But they did not prevent a loan judged well secured in June from producing a $4.3 million loss in September.
So is the 2026 commercial loss an isolated problem or the start of a turn? The evidence supports a narrower verdict than either extreme. One loss, however disappointing, is not enough to establish a broad deterioration. But the rise in nonaccruals from year-end, the four-year upward drift in charge-offs, the climb in early-stage delinquencies and the collateral shortfall together make the next few quarters a genuine test. The figures that will settle it are subsequent commercial charge-offs, the balance of criticized and classified loans, which the company reports in its quarterly filings, and recovery values on any other loans that go to sale. And the person responsible for that test, more than anyone, is the chief executive who has been running the bank's lending for a quarter of a century.
VIII. Mark Gooch's Capital-Allocation Test
Mark Gooch has spent his whole career at CTBI. He joined in 1981 and worked his way through nearly every job a community bank offers: branch manager, cashier, retail lender, commercial lender, vice president, compliance officer.6 From 1993 to January 1997, he ran First Security Bank & Trust, one of the affiliate banks, as president and chief executive.6 He then became executive vice president of operations at Community Trust Bank, and in July 1999 its president and chief executive.6 He took over the holding company in February 2022 and became chairman of the board in March 2024.6 He also chairs the bank's loan committee.6
His outside commitments read like a map of eastern Kentucky civic life. He serves on the boards of Pikeville's economic and industrial development authority, the Big Sandy Regional Industrial Development Authority and the Big Sandy Area Development District, sits on the national advisory council of the Christian Appalachian Project, and is a past chairman of the Pike County Chamber of Commerce and of One East Kentucky.6 He also sits on the board of the Kentucky Pro Football Hall of Fame.6 At 67, with 45 years in banking, he is the archetype of the community banker: a man whose reputation is bound up with the region his bank serves.6
That biography explains a lot about how CTBI operates. It is a bank run by a lender who grew up inside it, with a loan committee chaired by the chief executive. That can be a strength: decisions are made by people who know the markets, and the culture is continuous. It can also be a weakness: continuity can shade into insularity, and a chief executive who chairs the loan committee is directly accountable for the kind of credit decision that produced the September auction.
Pay is the first test of alignment. Gooch's total compensation rose from about $1.14 million in 2023 to $1.31 million in 2024 and $1.64 million in 2025.6 Over the same two years, net income rose from $78.0 million to $98.1 million.1 So pay rose about 44%, while profit rose about 26%. Part of the difference is structural: a chief executive's cash incentive is paid as a percentage of salary based on performance tiers, so a strong year can lift pay faster than profit. His 2025 incentive award was $740,400, up from $594,750 a year earlier.6 His base salary rose 6.9%, to $775,000, for 2026.6
The incentive design rewards earnings per share and return on average assets.6 Both are reasonable bank metrics, but both can be flattered by a favorable rate environment, and neither directly penalizes the bank for growing risky loans or under-provisioning for losses, at least not until losses show up. For 2026, the base targets were return on assets of 1.56% and EPS of $5.90, with a corresponding net income target of about $107.2 million.6 Through nine months, return on assets was 1.61% and EPS was $4.58, which puts the base target within reach.2
One detail of the 2025 award suggests a degree of discipline worth noting. The plan requires that performance goals be met after accruing the cost of the bonuses themselves. CTBI's 2025 results were strong enough to reach the third payment tier, but if the extra cost of paying at that tier had been accrued, performance would have fallen back to the second tier, so the executives were paid at the second tier.6 That is a small but real safeguard against bonuses that fund themselves. The long-term plan, which pays executives in cash for cumulative net income over three years, paid out at 75% of the base tier for 2023 to 2025.6 The committee set a new three-year target for 2026 to 2028, noting the challenges to the local economy in some of CTBI's markets.6
Ownership is the second test. Gooch beneficially owned 91,991 shares in early 2026, including about 28,000 held in the company's 401(k) plan and about 24,000 in the employee stock ownership plan, over which he has voting power, plus about 5,000 restricted shares.6 At the $74.22 share price at the end of September 2026, that stake was worth roughly $6.8 million, about four times his 2025 pay.2 Directors and executive officers as a group owned about 2.6% of the company.6 That is meaningful alignment for a community bank, but not control: the outside institutions, including BlackRock at about 7.2%, Dimensional Fund Advisors at about 6.4% and Vanguard at about 5.1%, together own far more than insiders.6
Governance is the third test. The chief executive and chairman roles have been combined since March 2024, a structure the board defends on the grounds that the chief executive knows the business best.6 To balance it, the board appointed Eugenia "Crit" Luallen, a former Lieutenant Governor of Kentucky, as lead independent director.6 Eight of the ten directors are independent.6 At the April 2026 annual meeting, about 12.2 million shares voted for the advisory resolution on executive pay and about 354,000 against, which means 97.2% of votes cast supported it.11 Shareholders, in other words, have shown little appetite for challenging management.
Capital allocation is the real test, and it is where the record is most debatable. A bank that earns money has four main choices for it: pay dividends, buy back stock, make acquisitions, or retain the capital to support growth. CTBI's record across those choices is distinctive.
Dividends are the company's signature. CTBI has increased its cash dividend for 45 consecutive years, and its dividend grew at a compound rate of about 5.5% over the five years to 2025.4 In 2025, it paid $2.00 per share, about 37% of earnings, which was below its stated desired payout range of 40% to 50%.14 Then, in the third quarter of 2026, it declared a dividend of $0.71 per share, up from $0.53, an increase of about a third.2 The company's release did not explain the jump. It may reflect the board's effort to move the payout ratio back into its target range, but that is an inference rather than a disclosed rationale.
Buybacks are the conspicuous absence. CTBI's repurchase program began in 1998 and has bought back about 2.47 million shares cumulatively, but there were no repurchases at all from 2021 through 2025, even though about 1.03 million shares of authorization remained.3 Acquisitions have been absent since 2010. That leaves retention as the main use of capital. In the first nine months of 2026, CTBI retained about 61% of its earnings.2
Retained capital has supported the bank's loan growth, and it has built a large cushion: CTBI's community bank leverage ratio was 13.60% at September 30, 2026, far above the regulatory threshold.2 But a skeptical investor would ask a pointed question. If acquisitions are no longer the plan, and buybacks have been absent for five years, what return should shareholders expect on the capital that stays inside the bank? The answer, so far, is about 12% on equity, a respectable number but one that has drifted below the 2021 level and well below the roughly 14% the bank earned in 2005.45 In early 2026, the stock traded at about 1.2 times book value.4 When a bank trades close to book and earns around 12% on equity, repurchasing shares is, at least arithmetically, a reasonable use of excess capital. The board's choice not to do so may reflect caution about rates, credit or regulatory capital, but it has not been explained in detail.
The credibility test looks at outcomes rather than descriptions. On the evidence, management has done what a conservative bank says it will do: grown steadily, kept capital high, paid a rising dividend, and hit its earnings goals. That supports steady operations more clearly than it supports exceptional capital allocation. Whether retained capital is earning enough to justify keeping it is the question the board has not yet answered, and the auction loss makes it more pressing. The case for and against CTBI as an investment turns on exactly that kind of question.
IX. Analysis & Bear vs. Bull Case
Put two numbers side by side and the whole debate about CTBI comes into focus. On one side is $98.1 million, the record 2025 profit, built on 26 basis points of margin expansion.1 On the other is $6.6 million, the third-quarter 2026 net charge-offs, built on one collateral auction and a broader rise in credit costs.2 The bull case says the first number reflects a well-run bank that is earning what its franchise deserves. The bear case says the first number was a rate-cycle gift and the second is the beginning of the bill.
The bull case starts with earnings. CTBI's profit has recovered well above its 2021 peak, and nine-month 2026 earnings are running about 17% ahead of 2025.2 Fee income is growing again, led by trust and wealth management, which adds some diversification beyond the spread. The bank is lean, with an efficiency ratio under 48% for the first nine months of 2026.2 And capital is strong: a community bank leverage ratio of 13.60%, a tangible common equity ratio around 11.6%, and no brokered deposits.210 Brokered deposits are funds placed by intermediaries chasing the highest rate, the flightiest kind of bank money. A bank that has none is funding itself with local relationships. CTBI also had about $553.6 million of available borrowing capacity from the Federal Home Loan Bank system at September 30, 2026, and only about $0.3 million of advances outstanding.10
The bear case starts with the margin. The 2025 expansion came mostly from falling deposit costs, and the third quarter of 2026 showed those costs rising again while asset yields slipped.12 If the margin normalizes back toward the 3.3% range of 2022 and 2023, a large part of the earnings gain would disappear. Credit costs have risen for four consecutive years. Nonaccrual loans rose sharply in 2026 from a clean year-end, the auction recovery fell far short, and early-stage delinquencies are climbing.210 The bank is growing loans at double-digit rates into that environment. And about $1.6 billion of its deposits were uninsured at September 30, 2026, meaning they exceeded the federal insurance limit and could move quickly if depositors became nervous or found better rates elsewhere.10
The competitive structure helps weigh the two cases. Using Michael Porter's five forces, the power of buyers is significant: depositors and borrowers can shop, and in a world of online banking and money-market funds, depositors have more alternatives than ever. The threat of substitutes is real on the deposit side, where digital banks and brokerage sweeps pull money away, and more modest on the lending side, where local commercial borrowers still value a banker who knows them. Rivalry is intense, with national banks, regional competitors and credit unions all fighting for the same customers. The threat of new entrants is limited by regulation and capital requirements, which genuinely protect incumbents from new local banks. Supplier power, which in banking means the power of depositors as suppliers of funds, is the force that moved most visibly during the rate cycle, when CTBI's funding costs jumped. The overall picture is an industry where returns are capped by competition, and where a bank's advantage has to come from cost, relationships or underwriting rather than from structure.
Hamilton Helmer's seven powers framework asks a sharper question: what, specifically, gives a company durable returns above its cost of capital? For CTBI, most of the seven powers are absent or weak. Network effects are negligible in community banking. Counter-positioning, where an incumbent cannot copy a newcomer's model without hurting itself, does not apply. A cornered resource, such as a unique license or asset, does not exist; CTBI's charter is valuable but not unique. Process power, a superior way of operating that is hard to copy, is possible in credit underwriting, but the auction loss and rising charge-offs make it unproven. Brand matters locally, especially in eastern Kentucky, where the bank's name has meant something for generations. Switching costs are real but modest: moving a checking account or a trust relationship is a hassle, but not a barrier. Scale economies are the one power CTBI can plausibly claim, but only relative to smaller local banks; against the national banks, it is at a scale disadvantage. The honest conclusion is that CTBI has a durable local presence and some switching costs, but a distinctive moat remains unproven. Its returns look like those of a well-run community bank, not of a bank with a structural edge.
Financial strength needs a bank-specific stress test, not an industrial one. The relevant questions are whether CTBI could meet a sudden wave of withdrawals, and whether it could absorb losses without impairing capital. On liquidity, CTBI held about $331.6 million of cash and equivalents at September 30, 2026, plus about $180.3 million of unpledged securities available for sale that could be sold or pledged quickly.10 With $553.6 million of borrowing capacity on top, the bank has roughly $1.1 billion of readily available liquidity against $1.6 billion of uninsured deposits.10 That is a reasonable but not overwhelming cushion: it covers most uninsured deposits, not all.
The securities portfolio is the hidden pressure point. CTBI held about $1.1 billion of available-for-sale debt securities at September 30, 2026, with gross unrealized losses of about $128.8 million, up from about $87.6 million at year-end.10 Nearly 98% of the portfolio was underwater.10 Those losses do not hit the income statement unless the bonds are sold, but they reduce shareholders' equity through accumulated other comprehensive income, and they would become real losses if the bank ever had to sell the bonds to meet withdrawals. That is the mechanism that turns a paper loss into a real one. This is why CTBI's book value per share fell from $49.10 in June 2026 to $48.29 in September, even though the bank earned $25.9 million in the quarter.2 CTBI is not close to that point, because its deposit base is far more granular and its liquidity sources cover most uninsured deposits. But the underwater bonds mean the bank's liquidity is less flexible than its headline cash suggests.
The bank's debt structure is simple. At the end of 2025, its borrowings consisted mainly of about $309 million of short-term repurchase agreements with customers, and about $63.8 million of long-term debt, including about $57.8 million of floating-rate junior subordinated debentures due in 2037.3 There is no refinancing pressure, but the floating rate means the debentures cost more when rates are high.
Three indicators will tell investors most of what they need to know. The first is the net interest margin, together with the cost of interest-bearing funds. The margin was 3.63% in the third quarter of 2026, down from 3.80% in the second, while funding costs rose to 2.78% from 2.64%.2 The direction of those two numbers will show whether the 2025 margin gain was durable or cyclical. The second is credit quality, measured through nonaccrual loans and net charge-offs. Nonaccruals were 0.18% of loans at September 30, up from 0.02% at year-end, and third-quarter net charge-offs were 0.50% annualized, the highest in years.102 The third is fee income alongside the efficiency ratio, which shows whether the bank is broadening its revenue and controlling costs. Noninterest income grew about 10% in the first nine months of 2026, and the efficiency ratio was about 47.5%, improving.2
Valuation needs careful framing. In its February 2026 presentation, CTBI showed its stock trading at about 10.4 times earnings and 1.2 times book value, with a dividend yield of about 3.75% and a market capitalization of about $1.0 billion.4 By September 30, 2026, the stock had climbed to $74.22.2 Against trailing twelve-month EPS of about $6.09 and book value of $48.29 per share, that implies roughly 12 times earnings and about 1.5 times book, a meaningful re-rating in seven months.2 At that price the dividend yield was about 3.83%, held up by the larger dividend.2 What does the higher multiple appear to assume? Mostly that the record earnings level is durable and that the credit losses are contained. If the margin normalizes and credit costs keep rising, the earnings base the market is paying for would shrink. If earnings hold after provisions and deposit costs settle, the multiple looks less demanding. Investors should refresh those figures against the current price, tangible book value and the bank's own valuation history before drawing any conclusion.
The investment case, in the end, is conditional. It improves if earnings hold after provisions and deposit costs settle, and if the third-quarter loss proves isolated. It weakens if credit losses rise while the margin benefits recede. CTBI is neither a broken bank nor a fortress with an unassailable moat. It is a well-capitalized regional bank whose next few quarters will show which version of 2025 was real.
X. Playbook: Business & Investing Lessons
CTBI's history divides into two eras that teach different things: an acquisition era and a more recent reliance on organic growth and retained capital.4913 The first tested whether local banks could be stitched together. The second has tested whether the result can earn its keep. Out of that history come four lessons that belong to this company and no other.
The first lesson is that a local footprint is an asset only when it earns its keep. CTBI's deposit-rich mountain counties still fund lending in the growing parts of the state. But, as the rate cycle showed, presence is not power; for investors, a branch map is a hypothesis about advantage, and the proof is in the spread. Call it the Pikeville paradox: the hills that built the bank cannot grow it, but they can still fund it.
The second lesson is that a loan is not safe because the collateral looked safe. The September auction put the gap between assessed collateral value and actual recovery in sharp relief.2 The auditor had flagged collateral values as a key judgment.3 For anyone judging a bank, the lesson is to treat collateral as a probability rather than a guarantee, and to watch the gap between what a bank says its collateral is worth and what it actually recovers. The appraisal is an opinion; the auction is the verdict.
The third lesson is that retained capital is a decision. CTBI's capital-allocation record shows that retaining earnings supported growth, while returns on equity remained below earlier levels.45 A board that neither acquires nor repurchases is still making a bet: that the next dollar retained will earn more inside the bank than it would in shareholders' hands. The test of that bet is not the size of the cushion, but the return on it. Doing nothing with capital is not the absence of a decision; it is a decision with a price.
The fourth lesson is about reading the past honestly. CTBI's acquisition record is historical strategy, not proof that it can create value through acquisitions today. The company still lists acquisitions as part of its model but has not bought a bank since 2010.4 An investor who assumes CTBI could successfully buy its way to growth again is relying on a record that is fifteen to twenty years old. The relevant evidence is what the bank has done with its capital lately, and that record is one of patience rather than deal-making.
Underneath all four lessons is a single idea: a community bank is a spread business, and the spread is earned through discipline rather than a single breakthrough. Local relationships matter, but underwriting and funding determine whether those relationships produce adequate returns. That discipline is being tested in real time.
XI. Epilogue
Tonight, CTBI stands at an interesting point. Its stock has re-rated, but credit and margin pressure are coming into view.210 The next quarterly report, covering the fourth quarter of 2026, will arrive in early 2027 with fresh data on all of these fronts.
The first thing to watch is whether the commercial loss stays contained. If the fourth quarter brings no further large commercial charge-offs, and criticized and classified loan balances remain stable, the auction will look like an isolated outcome on one relationship. If more commercial losses follow, particularly in the hotel and building-lessor concentrations, the auction will look like the first crack in a larger pattern. The September 2026 credit picture provides the baseline for that test.210
The second thing to watch is the balance between loan growth, deposit retention and deposit pricing. CTBI grew loans at an annualized 13.8% in the third quarter, while deposits including repurchase agreements grew at about 5.7% annualized.2 That gap cannot persist indefinitely without the bank either paying more for deposits or slowing its lending. The cost of interest-bearing funds, 2.78% in the third quarter, will show which way the pressure breaks.2 If funding costs keep rising while asset yields stall, the margin gains of 2025 will continue to erode. If deposit costs stabilize, the margin may hold near its recent range.
The third thing to watch is whether growth is broader than a rate-driven margin rebound. Fee income, especially trust and wealth management, and the efficiency ratio will show whether CTBI is building revenue streams and cost advantages that do not depend on the rate cycle. Capital returns will show whether the board has an answer to the question of what retained capital should earn: whether the larger dividend is the start of a higher payout, and whether buybacks return after a five-year absence.
The central tension remains unresolved. CTBI's record 2025 and strong 2026 could prove to be the start of a durably more profitable bank, leaner and better funded than it was a decade ago. Or they could prove to be the high point of a favorable rate cycle, with credit costs and deposit competition gradually eroding the gains. The evidence so far supports neither conclusion fully. What will settle it is whether CTBI can preserve its earnings after credit costs normalize, while funding its loan book without giving away the spread.
XII. Outro
In 1903, a bank opened its doors in a narrow valley in eastern Kentucky to serve a coal-country town. More than a century later, its descendant posted a record profit before a collateral auction produced a $4.3 million loss.12 The distance between those two moments is the whole story of community banking: the familiar local relationship on one side, the hard arithmetic of recovery value on the other.
What makes CTBI unlike a bank built around fast expansion is that it has bet its future on staying close to its communities. It stopped buying banks long ago and has grown since by lending in places it knows and funding itself with deposits from places that have trusted it for generations. That wager can produce steady returns. But it only works as long as the bank keeps seeing risk clearly, especially when the collateral goes under the hammer. The cycle is turning, and the question is whether community banking in the Kentucky hills can keep earning its spread when it does.
References
-
2025 Annual Earnings Release, Exhibit 99.1 — Community Trust Bancorp, Inc., 2026-01-21 ↩↩↩↩↩↩↩↩↩↩↩↩↩↩↩↩↩↩↩↩↩↩↩↩
-
Q3 2026 Earnings Release, Exhibit 99.1 — Community Trust Bancorp, Inc., 2026-10-21 ↩↩↩↩↩↩↩↩↩↩↩↩↩↩↩↩↩↩↩↩↩↩↩↩↩↩↩↩↩↩↩↩↩↩↩↩↩↩↩↩↩↩↩↩↩↩↩↩↩↩↩↩↩↩↩↩↩↩↩↩↩↩↩↩
-
2025 Form 10-K — Community Trust Bancorp, Inc., 2026-02-27 ↩↩↩↩↩↩↩↩↩↩↩↩↩↩↩↩↩↩↩↩
-
February 2026 Investor Presentation, Exhibit 99 — Community Trust Bancorp, Inc., 2026-02 ↩↩↩↩↩↩↩↩↩↩↩↩↩↩↩↩↩↩↩↩↩↩↩↩↩↩↩↩↩↩↩↩↩
-
Q3 2005 Form 10-Q: Heritage Community Bank Acquisition — Community Trust Bancorp, Inc., 2005-11 ↩↩↩↩↩↩↩↩
-
2026 Proxy Statement — Community Trust Bancorp, Inc., 2026-04-01 ↩↩↩↩↩↩↩↩↩↩↩↩↩↩↩↩↩↩↩↩↩↩↩↩↩
-
CEO Succession Plan, Form 8-K — Community Trust Bancorp, Inc., 2021-07-28 ↩
-
Q3 2026 Form 10-Q — Community Trust Bancorp, Inc., 2026-10-21 ↩↩↩↩↩↩↩↩↩↩↩↩↩↩↩↩
-
2026 Annual Meeting Results, Form 8-K — Community Trust Bancorp, Inc., 2026-04-29 ↩
 LinkedIn
 WhatsApp
 Reddit
 Hacker News
 Email
 Kindle
 RSS Feed
 Spotify
 Apple Podcasts
 Amazon Music
 Audible
 YouTube