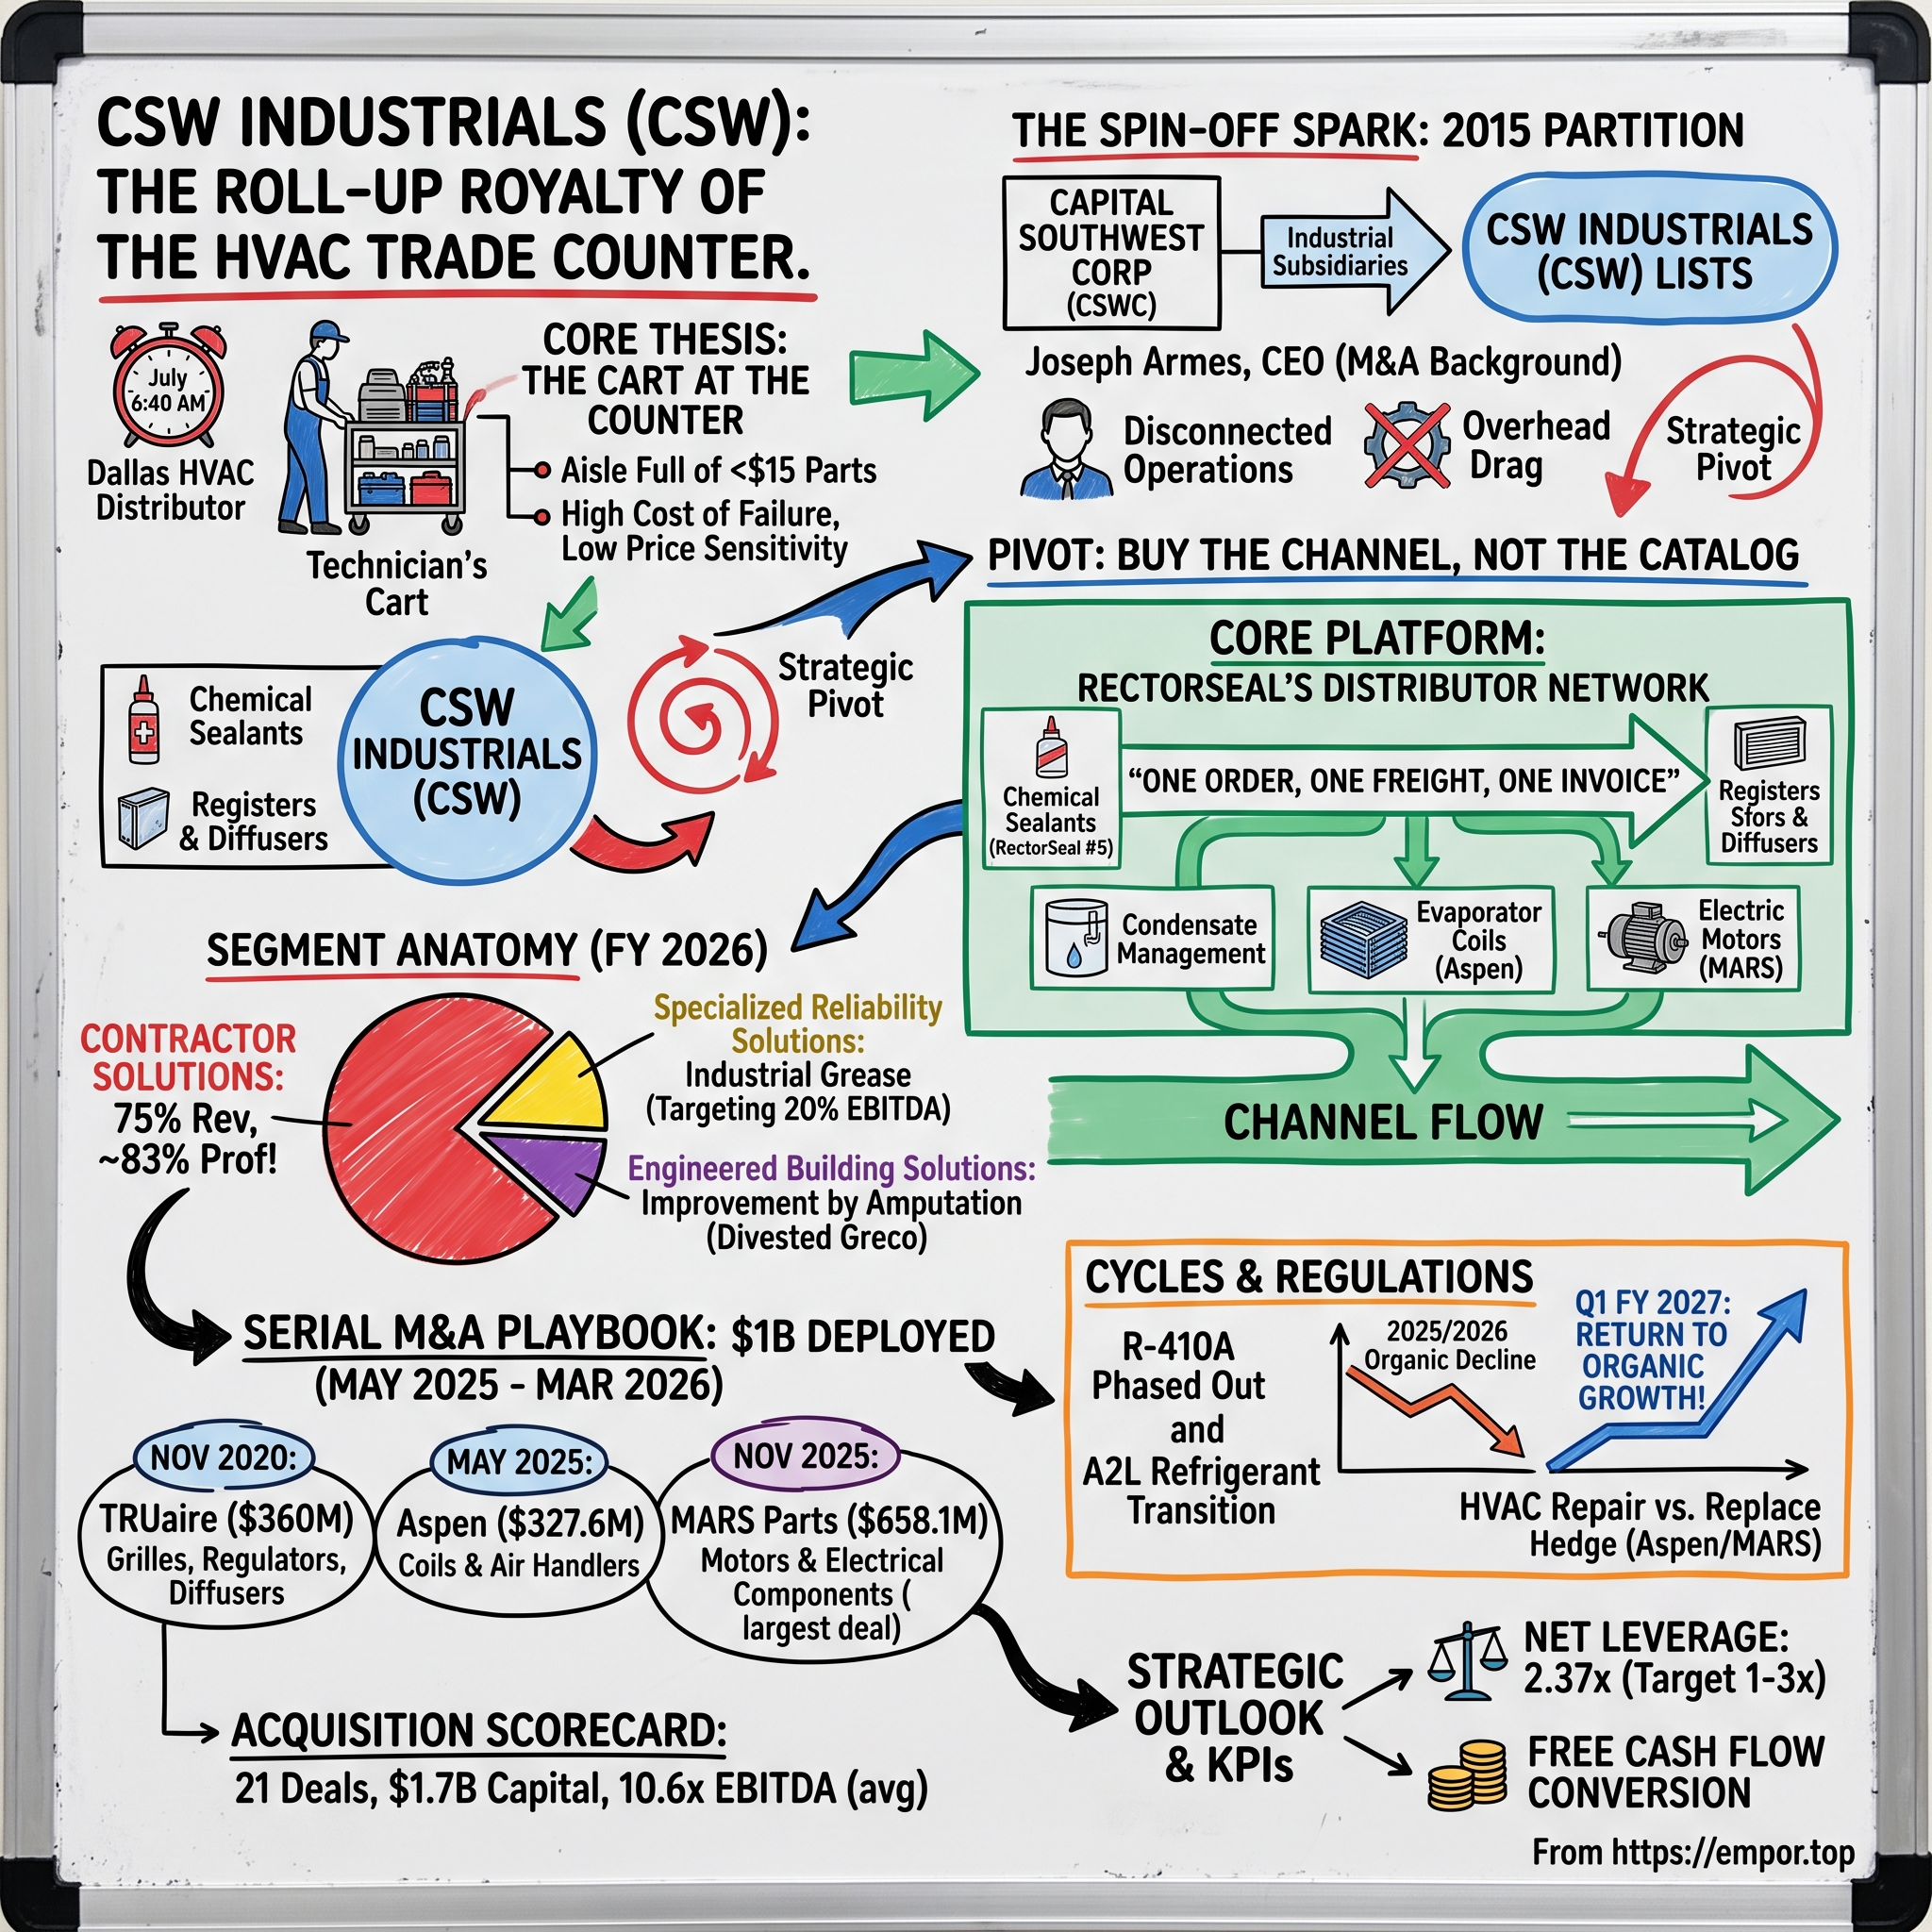
CSW Industrials: The Roll-Up Royalty of the HVAC Trade Counter
I. Introduction & Episode Roadmap
The Cart at the Counter
It is 6:40 on a July morning in Dallas, and the parking lot of a wholesale heating, ventilation, and air conditioning distributor is already three trucks deep. A technician walks in with a work order for a condenser swap on a 1990s ranch house whose air conditioning failed overnight. He picks up the big-ticket item — the outdoor unit, costing four or five figures. Then he walks the aisle and fills the rest of the cart almost without thinking: a tube of thread sealant, a condensate trap, a line-set cover, a couple of capacitors, a surge protector, and a return-air grille to replace one bent during a previous repair. None of those items costs more than a few hundred dollars; several cost less than a restaurant lunch. The technician does not comparison-shop a single one of them.
That cart encapsulates the core investment thesis for CSW Industrials, while also explaining why the company remains easy to overlook. CSW does not manufacture the condenser. Instead, it produces nearly everything the technician places around it. As of the summer of 2026, the company carried a market valuation of roughly $5.2 billion and traded on the New York Stock Exchange under the ticker symbol CSW — a listing transferred from Nasdaq on June 9, 2025, when it retired its former "CSWI" symbol.1810 For its fiscal year ended March 31, 2026, CSW reported revenue of $1.08 billion, a 23.3 percent increase year-over-year, alongside adjusted EBITDA of $269.6 million.2 Ten years earlier, the company was a corporate afterthought: a collection of operating businesses spun out from a Dallas investment firm seeking to focus exclusively on lending.
The Monopoly of the $15 Part
The business model rests on the economics of small, mission-critical components. A $15 tube of pipe thread sealant or a $30 condensate drain trap sits inside an installation worth thousands of dollars. If the sealant fails, the contractor loses far more than $15 — incurring an unpaid callback, a potential water-damage claim, and reputation damage among local homeowners. Because the cost of component failure outweighs the purchase price by a factor of hundreds, price sensitivity diminishes, and contractor brand loyalty solidifies into habit. That economic asymmetry, rather than proprietary technology, has historically sustained adjusted gross margins in the low-to-mid 40 percent range and segment EBITDA margins above 30 percent in CSW's core business.1
It is worth specifying what that economic asymmetry does and does not provide. It does not make the products technically difficult to manufacture. Chemical plants can easily formulate thread sealants, and stamping lines can readily produce return-air grilles. Instead, the asymmetry secures the right to be specified by habit — to remain the immediate choice a technician reaches for, and consequently the product a distributor must stock. That advantage is commercial rather than technical, favoring the brand with the longest shelf presence and the sales network that simplifies distributor operations. Consequently, the primary strategic question regarding CSW is not what it manufactures, but how it secured its shelf placement and what additional products it can distribute through the same network.
The Year the Line Bent
However, CSW's trajectory has not followed an unbroken straight line, and its situation in 2026 highlights notable operational shifts. In fiscal 2026, the company expanded revenue by nearly a quarter, but that top-line growth was entirely acquisition-driven. Organic revenue fell 2.1 percent overall, and dropped 3.6 percent in the primary Contractor Solutions segment.2 During those same twelve months, CSW deployed roughly $1 billion across five acquisitions, shifted from a net cash position to $843 million in net debt, and recorded a $15.6 million non-cash impairment on a business acquired just a few years earlier.3 A company whose valuation thesis depends on organic compounding experienced a year without organic growth, raising the question of whether this decline reflected a temporary cyclical pause or a structural shift.
In late July 2026, the company reported its June 2026 first-quarter results, prompting a sharp rise in the stock price toward the upper end of its 52-week range of roughly $230 to $337.118 That market reaction reflected previous investor concern over whether acquisition activity had outpaced organic performance. The quarterly results demonstrated a return to organic growth in the core segment, margin expansion, and debt reduction. The key issue remains whether a single quarter resolves broader multi-year performance trends.
Roadmap
The roadmap for this analysis explores how a spin-off from a business development company established the operating platform; what RectorSeal provides and why its distributor relationships represent the core asset; how the three operating segments differ in quality; the commercial dynamics of the trade counter and the "one order, one freight, one invoice" distribution logic; the serial M&A record benchmarked deal by deal, including the $650 million acquisition that expanded the company in late 2025; the impact of refrigerant regulations that present both opportunities and headwinds; management's execution relative to prior targets and guidance; the company's competitive positioning evaluated through Helmer's 7 Powers and Porter's Five Forces; the bear case from a skeptical investor's perspective; and the key financial metrics that will determine CSW's trajectory over the coming years.
The analysis begins where the company originated: with an investment firm's decision to divest its industrial operating subsidiaries.
 Subscribe on LinkedIn
II. The Spin-Off Spark: Capital Southwest & The 2015 Partition
An Investment Company That Happened to Own Factories
Capital Southwest Corporation operated for decades as a publicly traded Dallas investment company holding controlling stakes in mature industrial businesses. RectorSeal had sat in its portfolio since 1969. Founded in 1937 as a division of Rector Well Equipment to produce oil-field thread sealants, RectorSeal established its core market presence in the 1950s with RectorSeal No. 5, a yellow pipe thread sealant that became a standard fixture among North American plumbers.6 By 2015, Capital Southwest had owned RectorSeal for 46 years. Its portfolio also included Jet-Lube and Whitmore, manufacturers of industrial greases and anti-seize compounds; Balco, an architectural product maker focused on expansion joint covers and stair nosings; and Smoke Guard, a producer of flexible fire and smoke curtains for commercial buildings.
The Partition
This hybrid model created valuation friction: public investors seeking exposure to a middle-market credit vehicle resisted holding industrial manufacturers, while equity investors looking for industrial compounders avoided financial loan books. On September 30, 2015, Capital Southwest resolved the structural mismatch by distributing its industrial operating subsidiaries to shareholders. The tax-free, pro-rata spinoff issued roughly 15.6 million shares of a newly formed entity, CSW Industrials, delivering one share for each Capital Southwest share held as of the September 18 record date.5 Following the separation, Capital Southwest transitioned into a pure-play business development company. CSW Industrials began life as a standalone company organized across three disparate reporting segments—Industrial Products, Coatings, Sealants and Adhesives, and Specialty Chemicals—with no unifying central strategy.5
The Dealmaker Who Inherited an Inventory
To lead the new company, Capital Southwest appointed Joseph B. Armes, who had served as Capital Southwest’s president and chief executive officer since June 2013. Armes remained chairman of Capital Southwest until 2017 while simultaneously serving as chairman and chief executive of CSW Industrials.11 Rather than a traditional manufacturing operator, Armes brought an M&A background, holding finance degrees from Baylor University and a law degree from Southern Methodist University, having begun his career as a corporate attorney at Weil, Gotshal & Manges.11 His board experience included chairing the audit committee at RSP Permian and serving on the board of Switchback Energy Acquisition Corporation through its combination with ChargePoint.11
Armes inherited a collection of unrelated businesses rather than an integrated platform: Houston-based pipe dopes and firestopping caulks, Fort Worth-based open-gear lubricants for mining draglines, flexible smoke curtains for high-rises, and aluminum stair nosings. Inside a financial investment fund, product diversification functioned simply as portfolio allocation. Within an operating company, however, operational scatter created overhead drag, diluting managerial focus and capital allocation across disconnected end markets.
CSW spent its initial years restructuring rather than expanding organically. The original three-segment reporting structure was later streamlined into the current trio of Contractor Solutions, Specialized Reliability Solutions, and Engineered Building Solutions. Executive management also turned over: Christopher J. Mudd, who served as president and chief operating officer at the time of the spin-off, and Kelly Tacke, the initial chief financial officer, both departed in the years following the separation.5 Early financial results reflected this operational transition as management rationalized operations and established corporate governance.
The Pivot: Buy the Channel, Not the Catalog
The strategic turn occurred when management identified the portfolio's most defensible commercial asset: RectorSeal’s entrenched shelf position across HVAC and plumbing wholesale distributors. Rather than treating RectorSeal as merely a product manufacturer, CSW reoriented its strategy around that wholesale distribution channel as its core platform. M&A criteria shifted to evaluate whether target products could be funneled through RectorSeal's existing distributor network. This transition turned CSW from a passive holding company into a channel-focused consolidator, explaining why subsequent acquisitions targeted items such as grilles, coils, condensate pumps, surge protectors, and motors rather than expanding into general industrial lubricants.
The 2015 separation did not grant CSW an immediate moat or unified operating culture; rather, it provided a legacy chemical brand with deep distributor relationships, an unleveraged balance sheet, and leadership equipped to execute corporate acquisitions. CSW’s subsequent expansion relied on concentrating capital behind that distributor channel asset.
That same channel focus eventually dictated portfolio exits, leading management years later to write down and prepare non-core inherited assets for divestiture. Before examining those portfolio shifts, analyzing CSW requires evaluating the exact revenue and profit contribution of its core HVAC distribution platform relative to its secondary segments.
III. Segment Anatomy: Sizing the Economic Engine
An investor reading CSW Industrials' reports might be tempted to assign equal weight to each of its three reporting segments, but the financial data tells a different story. In fiscal 2026, Contractor Solutions generated $810.3 million of the company's $1.08 billion in consolidated revenue and $248.8 million of adjusted segment EBITDA — accounting for roughly three-quarters of the top line and, before corporate costs, nearly five-sixths of segment profit.2 By the June 2026 quarter, that concentration increased further, with Contractor Solutions generating $276.0 million of $350.6 million in total revenue and $94.3 million of segment adjusted EBITDA.1 The other two segments provide operational support and cash generation, but value creation is overwhelmingly concentrated in Contractor Solutions.
Contractor Solutions: Three-Quarters of the Revenue, Most of the Profit
Contractor Solutions is the primary engine of the business. Its product lines encompass the consumables and accessories required around HVAC, plumbing, and electrical installations: chemical sealants, solvent cements, condensate traps and pumps, line-set covers, grilles, registers, diffusers, surge protectors, indoor air quality equipment, evaporator coils, air handlers, and — following late 2025 acquisitions — electric motors and capacitors. These products carry trade brand names rather than consumer labels: RectorSeal, TRUaire, Shoemaker, Dust Free, Cover Guard, PSP Products, Aspen Manufacturing, MARS Parts, and Amrad.13 Virtually none of this catalog is sold directly to homeowners; instead, it flows through wholesale distributors to professional trade contractors.
The segment's underlying economics reflect this distribution model. Consolidated adjusted gross margin reached 42.6 percent in fiscal 2026 before expanding to 45.1 percent in the June 2026 quarter, while Contractor Solutions delivered a 34.2 percent adjusted EBITDA margin during that same quarter.21 These figures reflect branded-consumable economics rather than heavy-equipment manufacturing, generated on components that carry low absolute price tags but high costs of failure. The segment is similarly capital-light: in fiscal 2026, organic capital expenditure across the entire company was $17.3 million against $269.6 million in adjusted EBITDA.2 Chemical formulation, light assembly, and metal stamping do not require the capital investment of heavy manufacturing facilities.
Specialized Reliability Solutions: The Cash Generator That Kept Missing Its Target
Specialized Reliability Solutions represents the legacy industrial business — comprising Whitmore, Jet-Lube, and, as of fiscal 2026, Hydrotex and ProAction Fluids — which supplies high-performance greases, anti-seize compounds, and lubrication management equipment to mining, rail, energy, steel, and heavy industrial maintenance sectors.13 Generating $160.1 million in fiscal 2026 revenue, the segment represents roughly a seventh of total company sales.2 Its strategic function is twofold: it generates steady cash flow to fund HVAC acquisitions and provides diversification beyond residential construction cycles. Conversely, its place in the bear case stems from years of failing to sustain the 20 percent EBITDA margin target established by management — finishing fiscal 2026 at 18.5 percent, a level achieved only after operational restructuring and two higher-margin acquisitions.23 In the June 2026 quarter, the segment finally cleared its benchmark at 20.8 percent with 16.5 percent organic revenue growth, the highest organic growth rate in the company.1 While a single quarter does not establish a trend, it offers initial evidence that the segment's target is operationally achievable.
Engineered Building Solutions: Improvement by Amputation
Engineered Building Solutions operates in code-driven commercial construction niches: Smoke Guard's intumescent fire and smoke curtains, Balco's expansion joint covers and stair nosings, and Greco's architectural railings and metals sold into commercial, institutional, and multi-family structures.13 This segment experienced significant operational restructuring in fiscal 2026, as revenue declined 1.0 percent to $119.9 million and the segment posted a $1.2 million GAAP operating loss. The loss stemmed from management's decision in the March 2026 quarter to sell Greco's U.S. operations and wind down Greco Canada, recording a $15.6 million non-cash impairment alongside $2.1 million in exit expenses, while projecting $1 million to $2 million in additional costs.23 Excluding Greco, the remaining core business shows stronger underlying metrics: $86.5 million in fiscal 2026 revenue growing at 6.0 percent with a 21.8 percent adjusted EBITDA margin, which expanded to 26.2 percent in the June 2026 quarter.21
Understanding these product categories clarifies why demand persists. Smoke Guard manufactures flexible fabric curtains that deploy across elevator shafts and stairwells during fire alarms, containing toxic smoke without requiring permanent walls. Balco produces specialized metal covers that span structural expansion gaps — allowing concrete to expand and contract without cracking — alongside abrasive stair nosings. These components represent non-discretionary purchases required to secure building occupancy certificates. Consequently, segment demand tracks commercial construction starts and building code enforcement rather than consumer sentiment, with revenue flowing through project bid backlogs rather than daily trade counter transactions.
The Greco divestiture provides a clear case study of management's capital allocation discipline. On the fourth-quarter earnings call, management cited specific headwinds: a weakening Canadian economy, a steep decline in Canadian multi-family construction, reduced cross-border sales into the Upper Midwest, and elevated aluminum input costs.3 Armes characterized the exit as return-on-capital discipline, stating that businesses failing to meet target return parameters would not remain long-term holdings.3 The decision reflects a combination of enforced capital discipline and the realization of an underperforming acquisition.
A key reporting nuance governs these segment figures. CSW reports segment adjusted EBITDA before allocating corporate overhead, meaning segment margins do not sum directly to consolidated margins — Contractor Solutions' 34.2 percent margin versus the consolidated company's 29.0 percent margin in the June 2026 quarter reflects corporate administrative expense.1 Tracking this differential indicates operating leverage: an effective serial acquirer expands without a proportional increase in corporate costs, whereas expanding corporate overhead alongside revenue indicates a lack of true scale economies.
This segment analysis confirms that CSW Industrials is fundamentally structured around one high-margin growth engine, one cash-generative industrial segment working to stabilize its margins, and a smaller code-driven building products unit undergoing portfolio optimization. The core investment case centers on Contractor Solutions — and specifically on the trade counter distribution network where its products are sold.
IV. Deep Dive: Contractor Solutions & The HVAC/R Trade Counter Economics
How a Technician Actually Buys
A wholesale HVAC distributor branch operates nothing like a conventional retail store. Behind the trade counter sits a warehouse, while in front stands a steady stream of contractors who arrive with jobs already scheduled and trucks already carrying primary equipment. From the distributor, technicians require everything else immediately; delaying an installation to drive across town for a minor fitting leaves a customer without cooling and wastes billable contractor hours. This purchasing environment creates buying habits distinct from typical e-commerce: contractors do not use price-comparison tools at the counter, relying instead on immediate availability, brand familiarity, and established distributor habits.
This dynamic underpins the stability of the Contractor Solutions segment. Because a distributor branch maintains limited shelf space and catalog capacity, securing a stocking position for a minor accessory requires meeting three criteria: contractors must request the product by name, inventory must turn quickly enough to justify space allocation, and the supplier must minimize administrative burden for the distributor. These advantages accumulate gradually over time. RectorSeal established contractor brand preference over nearly nine decades, as generations of technicians grew accustomed to how its pastes cure and set.6 Meanwhile, CSW addressed distributor administrative friction by consolidating what would otherwise be a dozen separate vendor relationships into a single supplier contact.
One Order, One Freight, One Invoice
That consolidation mechanism serves as a primary commercial driver. Managing hundreds of separate supplier accounts for low-margin hardware creates operational complexity for wholesale distributors, requiring individual purchase orders, freight routes, invoices, payment terms, and sales representatives. By combining chemical formulations, condensate management, line-set covers, electrical components, grilles, registers, evaporator coils, and electric motors under a single sales organization and invoice, CSW acts as a category manager rather than a simple product vendor. This enables distributor branches to consolidate orders onto a single pallet or truckload.
Despite broader e-commerce disintermediation across industrial supply chains, this distribution model persists due to time constraints and liability risks. A contractor at a job site requiring an immediate component cannot wait days for delivery; local branch availability takes precedence over minor online price differences. While digital ordering portals have become standard across distributor networks, CSW's focus on enterprise resource planning (ERP) integration aligns with this shift. Electronic ordering tends to reinforce incumbent suppliers, as vendors with complete catalog integration feature prominently in distributor portal searches. E-commerce typically disrupts distribution when buyers can afford delivery delays and products are readily interchangeable—conditions absent in urgent HVAC repairs.
Management highlighted this integration strategy during its fiscal fourth-quarter earnings call, pointing to the software consolidation of recent acquisitions—including moving MARS Parts onto the company's ERP system in January 2026 and Aspen's customer portal in May 2026. Executive management noted that distributor clients can now order across the expanded catalog from a single interface, citing an unnamed customer account: "we've got a customer that a few years ago, we weren't even in their top 20 and right now we're number one."3 Chief Executive Officer Joseph Armes described cross-selling newly acquired product lines into existing distributor accounts directly, calling the conversion "an organic growth opportunity that is very accretive for us."3 The strategic objective is straightforward: acquiring product lines and distributing them through established logistics routes allows acquired brands to achieve higher growth under CSW than as independent entities.
Financial disclosures provide empirical support for this distribution strategy. Aspen Manufacturing expanded revenue by 10.4 percent during the quarter ended March 31, 2026, and achieved 13.5 percent growth following its acquisition by CSW, despite volume declines reported by major residential HVAC equipment manufacturers over the same period.3 Similarly, during the quarter ended September 30, 2025—which marked the lowest point of industry inventory destocking—Aspen and PF Waterworks achieved a combined weighted average growth rate exceeding 40 percent.4 These reported figures demonstrate how expanding distribution access can drive top-line performance for acquired product lines even during broader market contractions.
The Competitive Map, Category by Category
Competitive dynamics differ across product categories. In chemicals and consumables, RectorSeal competes alongside established suppliers such as DiversiTech, Nu-Calgon, and Oatey, all of which distribute through similar wholesale channels. Rather than claiming technological superiority, CSW bases its competitive advantage on contractor habituation and catalog breadth; technicians frequently prefer brands they have used consistently throughout their careers. In grilles, registers, and diffusers, CSW's TRUaire and Shoemaker brands compete with manufacturers including Titus, Hart & Cooley, and Price Industries. TRUaire maintains a cost advantage through a company-owned production facility in Vietnam combined with extensive U.S. distribution scale.7 In evaporator coils and air handlers, Aspen competes against Mortex and Lennox's Advanced Distributor Products division, positioning itself as an independent supplier compatible with multiple original equipment manufacturers (OEMs) and unencumbered by ownership from competing equipment makers.
Where the Moat Stops
The segment's commercial advantage has clear operational boundaries. CSW's pricing power consists primarily of passing through input cost inflation rather than expanding base margins independently. Executive management has repeatedly stated on investor calls that its priority is protecting absolute margin dollars rather than maintaining margin percentages, acknowledging that tariff-driven cost increases compress margin rates in the short term.43 During the fiscal fourth-quarter earnings call, management outlined ongoing cost pressures, including ocean freight rate increases of 25 to 30 percent stemming from Middle East shipping disruptions, higher diesel costs offsetting domestic logistics efficiencies, and petroleum-based plastic expenses flowing into cost of goods sold with a multi-month lag.3 These cost dynamics illustrate that while CSW possesses solid cost-pass-through capabilities, its pricing leverage remains bounded by external supply chain conditions.
The wholesale trade counter remains CSW's foundational commercial asset. The critical analytical question is what capital CSW must deploy—and what acquisition prices it must pay—to continue expanding the catalog flowing across that counter.
V. The Serial M&A Playbook & Benchmarking Capital Deployment
Between May 2025 and March 2026, CSW Industrials deployed approximately $1 billion toward acquisitions — representing more than half of its total cumulative M&A capital deployment since becoming an independent public company — even as organic revenue in its core segment contracted.32 This rapid surge in capital deployment highlights the central thesis and risk profile of CSW's strategy, requiring a transaction-by-transaction examination.
The Formula and the Scorecard
The core acquisition strategy has remained consistent since the 2015 spin-off: acquire niche market leaders generating high gross margins at disciplined valuation multiples, then route their products through CSW's established wholesale distribution channel. According to investor disclosures for the June 2026 quarter, the cumulative scorecard stands at 21 acquisitions since October 2015, representing approximately $1.7 billion in deployed capital at a weighted-average multiple of 10.6 times EBITDA.14 Over this period, annual revenue expanded from under $270 million to $1.17 billion on a trailing twelve-month basis, accompanied by an 860 percent total shareholder return.14 These reported metrics reflect management's framing; notably, the 10.6 times average multiple incorporates synergy adjustments in select transactions, as explicitly detailed in the disclosure for the MARS Parts acquisition.
Benchmark Deal One: TRUaire
TRUaire, announced November 5, 2020. This transaction marked CSW's major pivot from a legacy chemicals manufacturer to a dedicated HVAC accessories platform. Total consideration reached approximately $360 million — funded through cash on hand, borrowings under a $300 million credit facility, and roughly 850,000 shares issued to the sellers — representing a multiple of roughly 10 times TRUaire's expected 2020 adjusted EBITDA on $108 million in expected annual revenue.7 TRUaire brought grilles, registers, and diffusers — products adjacent to RectorSeal's chemical catalog, sold through identical distributor branches to the same trade contractors. The transaction included a manufacturing facility in Vietnam, five domestic distribution centers, and a revenue base heavily weighted toward residential end markets, which accounted for 86 percent of its 2019 sales.7 Following the acquisition, HVAC/R products were projected to generate nearly 49 percent of CSW's annual revenue, establishing a core segment majority.7 By 2021, TRUaire became RectorSeal's largest operating brand.6 The strategic driver was not operational cost reduction, but increasing revenue generated per distributor counter visit.
Benchmark Deal Two: Aspen Manufacturing
Aspen Manufacturing, announced March 18, 2025, and closed May 1, 2025. CSW acquired the Humble, Texas-based producer of residential and light commercial evaporator coils and air handlers for $313.5 million in cash — approximately 11 times estimated 2024 adjusted EBITDA of $28.5 million — with final net consideration recorded at $327.6 million following working capital adjustments.813 The acquisition added approximately 350 employees and significantly expanded CSW's dollar content per job, raising revenue per residential replacement project from tens of dollars to hundreds of dollars. Aspen's status as an independent manufacturer, unaffiliated with a single original equipment manufacturer (OEM), positioned it as a preferred option for mixed-brand retrofit and replacement projects. Carrying a trailing twelve-month revenue base of roughly $125 million at the close of fiscal 2025, Aspen was projected by management to deliver mid-teens revenue growth in fiscal 2026, a target management later noted the unit exceeded.43 Aspen operated at lower margin rates than legacy Contractor Solutions, generating EBITDA margins in the low twenties against CSW's mid-twenties baseline, with management targeting expansion back toward mid-twenties percentage levels.3 The transaction demonstrated CSW's willingness to accept initial margin dilution in exchange for higher absolute cash flow generation.
Benchmark Deal Three: MARS Parts, the Biggest Bet
MARS Parts, announced October 1, 2025, and closed November 4, 2025. Representing the largest acquisition in company history, CSW purchased Motors & Armatures' parts business for $650 million in cash at closing, plus up to $20 million in contingent consideration tied to twelve-month revenue targets, with final consideration recorded at $658.1 million.913 The acquired operations — encompassing electric motors, capacitors, HVAC/R electrical components, and installation hardware supported by 200 employees across domestic and contract manufacturing operations — brought approximately $200 million in annual revenue at mid-twenties EBITDA margins.94
The valuation disclosures surrounding MARS Parts provided detailed context on synergy expectations. CSW reported the purchase price as 10.4 times pro-forma trailing twelve-month EBITDA adjusted for identified synergies, while concurrently disclosing an unadjusted purchase multiple of 12.4 times based on MARS Parts' standalone trailing EBITDA of $52.3 million.9 This dual disclosure illustrated the degree to which the transaction's reported purchase multiple depended on subsequent operational execution.
Subsequent execution markers indicate progress toward those synergy targets. At announcement, management set targets of $10 million in run-rate synergies and a 30 percent run-rate EBITDA margin by November 2026.4 On the March 2026 earnings call, management reported actioning over $10 million in cost savings and raised the synergy target to more than $12 million.3 By the June 2026 quarter, CSW disclosed $13 million in achieved synergies and confirmed the unit had reached the 30 percent EBITDA margin target.14
However, an operational shift will affect near-term reported revenue trends. CSW initiated SKU rationalization across MARS Parts, exiting product lines where the brand lacked differentiation or where legacy Contractor Solutions lines — such as surge protection — offered superior profitability. As executive commentary noted, MARS Parts' top-line revenue growth over the subsequent twelve months will not directly mirror underlying end-market demand due to this intentional volume transition to legacy product channels.3 While margin-accretive, this rationalization complicates headline organic revenue comparisons.
The Bolt-Ons Nobody Notices
DuctStrip, closed in the March 2026 quarter. CSW acquired DuctStrip, a specialized electrical cable combining conductors for ductless mini-split systems into a single jacket, for $21 million, representing roughly 7 times trailing EBITDA of $3 million.3 Because CSW previously acted as master distributor for the product, incremental EBITDA contribution to the company was estimated at $2 million rather than the standalone $3 million figure.3 The deal illustrates CSW's strategy of acquiring familiar distribution lines at modest valuations.
Additionally, CSW executed a $4.8 million incremental minority investment in Flair, a developer of smart grilles, registers, diffusers, and ductless thermostat controls, maintaining exposure to room-level airflow automation technology.3
Within Specialized Reliability Solutions, CSW completed two acquisitions in the December 2025 quarter — Hydrotex and ProAction Fluids — extending its channel consolidation strategy into industrial lubricants.313 While individual purchase prices were not disclosed separately in financial releases, the integration of these higher-margin businesses, combined with $5 million in pre-tax restructuring costs initiated in the March 2026 quarter, drove a 640-basis-point margin expansion for the segment during that quarter.3
The Overpay Test
Evaluating CSW's capital deployment requires examining the valuation dynamics of serial roll-ups. CSW has historically paid between 7 and 11 times EBITDA for asset-light, high-margin consumables businesses. While larger public HVAC distributors and equipment manufacturers frequently trade at higher enterprise multiples — giving rise to multiple-arbitrage arguments — that gap reflects structural differences. Private niche manufacturers generating $30 million to $50 million in EBITDA differ from national public distributors in liquidity, operational scale, and customer breadth. Multiple expansion creates value only if acquired units sustain operational performance, a dynamic underscored by CSW's previous impairment in the Greco business. While Aspen's revenue growth and MARS's synergy realization demonstrate integration capability, transaction multiples remain bounded by underlying business performance rather than structural valuation arbitrage.
Funding the Machine
CSW's acquisition cadence has been supported by flexible capital allocation. In September 2024, the company completed its initial public equity offering, issuing 1.265 million shares at $285 per share for $347.4 million in net proceeds, using the capital to pay down $115 million in revolver debt.16 The remaining cash balance subsequently funded the Aspen acquisition seven months later. To finance MARS Parts, CSW established a $600 million five-year syndicated Term Loan A, expanded its credit revolver to $700 million, and executed a $300 million three-year interest rate swap fixing SOFR at 3.42 percent.93 During fiscal 2026, the company repurchased $128 million of its common stock at an average price of $253 per share, executing buybacks below the price of its prior equity issuance.3
During the fiscal fourth-quarter earnings call, management noted that seven or eight target transactions came to market during the year, with CSW evaluating each opportunity.3 Selecting five transactions required balancing deal flow against integration capacity and valuation discipline. Demonstrated outcomes — including accelerated synergy delivery at MARS, above-model growth at Aspen, and portfolio rationalization in non-core units — indicate disciplined execution across recent integrations.
Leverage: Up Fast, Down Fast
Debt metrics adjusted rapidly following transaction closes. Net debt for covenant purposes stood at $32 million as of September 30, 2025 — representing a leverage ratio of 0.12 times — before rising to $843 million, or 2.55 times leverage, by March 31, 2026.43 By June 30, 2026, net debt declined to $814.8 million, reducing leverage to 2.37 times and placing the balance sheet within management's target range of 1.0 to 3.0 times.1 This reduction reflects cash generation applied toward debt paydown following peak deal activity, establishing the leverage baseline as regulatory shifts impact end-market demand.
VI. Hidden & Emerging Engines: IAQ, Refrigerant Transition, & Optionality
Every serial consolidator eventually develops narrative drivers about future growth, and CSW Industrials has two primary storylines. One represents a modest cross-sell opportunity; the other is a broad regulatory transition that has created as many near-term headwinds as tailwinds.
Indoor Air Quality: A Small, Real Option
The smaller opportunity is indoor air quality. Dust Free, acquired in 2024, added ultraviolet air purifiers, photocatalytic oxidation filtration, and duct-mounted air scrubbers to RectorSeal's sales catalog. These devices bolt onto existing ductwork to irradiate or chemically treat circulating air. For CSW, the strategic appeal lies not in proprietary technology, but in commercial distribution: selling an air quality unit through an existing distributor contact incurs negligible incremental sales expense while attaching to a project a contractor is already completing. CSW does not disclose standalone air quality revenue, requiring investors to size the category prudently as a cross-sell feature within an $810 million segment rather than a primary growth engine. Management grouped air quality with ductless accessories and surge protection as "faster-growing areas" intended to help the segment outperform a flat broader market — a plausible claim that remains unverifiable at current financial disclosure levels.3
Myth vs. Reality: The Refrigerant Transition
The larger narrative centers on the industry-wide transition to low global warming potential refrigerants, where popular investment assumptions require qualification. Under the Environmental Protection Agency's Technology Transitions rule implementing the AIM Act, stationary residential and light commercial air conditioning and heat pump systems faced a global warming potential cap of 700. The regulation established manufacturing and import restrictions effective January 1, 2025, alongside a matching installation compliance date — subject to an exemption for systems whose specified components were manufactured or imported prior to that cutoff.15 In practice, the mandate phased out R-410A, which carries a rating above 2,000, in favor of A2L refrigerants such as R-454B, with ratings in the mid-400s. Because A2L refrigerants are mildly flammable, the transition mandated redesigned equipment, updated leak detection sensors, and modified handling procedures rather than a simple refrigerant swap.
A common bullish thesis argued that homeowners would be forced to replace aging systems entirely, driving mandatory demand for Aspen's replacement coils and RectorSeal's specialized line-set fittings. While directionally sound, the immediate operational reality in fiscal 2026 proved more complex. Higher equipment prices for A2L-compliant systems, combined with elevated interest rates and sluggish existing home sales, prompted many consumers to repair existing equipment rather than purchase complete system replacements. On the September 2025 earnings call, Chief Financial Officer James Perry attributed Contractor Solutions' organic revenue decline directly to "continued soft housing activity in the quarter and the shift to repair from replacement of HVAC units by many consumers, which is being primarily driven by the higher cost of new units with the new refrigerant standards as well as the impact from tariffs."4 Consequently, the regulation functioned in the short term as a demand suppressant for full-system replacement components.
Furthermore, regulatory mandates carry inherent policy risk. In 2025, the EPA proposed amendments to the Technology Transitions rule, including removing the installation deadline for residential and light commercial systems whose specified components were manufactured or imported before January 1, 2025.15 This shift underscores that regulatory tailwinds are subject to administrative modification, delay, or reversal. Investment arguments reliant on environmental mandates implicitly incorporate political risk alongside commercial execution.
The Hedge Nobody Called a Hedge
This dynamic highlights an essential portfolio nuance: CSW's recent acquisition activity functioned as an operational hedge across the HVAC repair and replacement cycles. Aspen focuses primarily on the replacement and repair market, while MARS Parts skews toward repair components alongside replacement parts. Conversely, legacy Contractor Solutions products — particularly TRUaire and Shoemaker grilles, registers, and diffusers — depend more heavily on new residential construction and full-system installations. Acquiring Aspen and MARS Parts provided CSW with direct exposure to repair demand during periods when high system replacement costs curtailed new installations. Chief Executive Officer Joseph Armes articulated this positioning during the fiscal fourth-quarter earnings call, noting that the acquisitions "increased our exposure to the HVAC repair cycle, providing a more balanced product offering that enables us to perform well as the repair versus replace mix changes."3
This balanced product exposure proved effective during the June 2026 quarter. Contractor Solutions delivered 5.9 percent organic revenue growth — marking a second consecutive positive quarter — while the segment's adjusted EBITDA margin expanded 110 basis points to 34.2 percent.1 The segment achieved organic expansion despite broader residential HVAC end-market demand remaining essentially flat.
The company's investment in Flair fits into a similar category of measured optionality. Smart grilles and automated registers offer a potential path to transition commodity metal hardware into connected devices carrying higher price points. However, CSW committed a modest sum toward a minority stake rather than executing an outright acquisition — a cautious posture toward an unproven product category indicating that management does not yet view automated airflow control as a core market.3
Ultimately, neither indoor air quality nor refrigerant regulations alter CSW's foundational business model, which remains grounded in consumable trade products, contractor purchasing habits, and distributor shelf access. They influence product mix and quarterly demand timing. Investors evaluating CSW as a pure regulatory play risk misinterpreting its underlying drivers; those evaluating it as a channel consolidator must monitor regulatory shifts primarily as a source of near-term volume fluctuations.
This brings the analysis to management's execution record and capital allocation discipline.
VII. Management Credibility, Governance, & Conference Call Evidence
A Succession Statement Delivered as Reassurance
On the October 30, 2025 earnings call — during the weakest organic quarter CSW had reported in years — Chief Executive Officer Joseph Armes delivered an unexpected announcement mid-script. He informed listeners that he had told the board he intended to remain CEO for several more years, citing "the compelling growth and value creation opportunity ahead of us in our second decade" and a belief in "a partnership between capital and labor."4 The statement offered continuity during a period when the stock was under pressure and the company was preparing to close its largest transaction to date. However, it also highlighted that the company lacked a publicly designated successor.
Armes has served as chairman and chief executive since the 2015 spin-off and added the president title in February 2018.11 His legal and transaction background is reflected in CSW's detailed disclosures, which regularly publish unpromising figures alongside positive ones — including the unadjusted 12.4-times MARS purchase multiple, the reduced incremental EBITDA from DuctStrip, and initial acquisition-driven margin dilution.
James E. Perry has served as chief financial officer since June 2020, following nine years as CFO of Trinity Industries and earlier roles in investment banking at JP Morgan Chase and consulting at Ernst & Young.12 Perry has guided the company's capital allocation frameworks, including its target net debt leverage ratio of 1.0 to 3.0 times, the interest rate swap fixing $300 million in floating rate debt, rapid debt reduction following the Aspen acquisition, and specific guidance on analytical metrics. On the fiscal fourth-quarter earnings call, Perry noted that with intangible asset amortization stepping up to approximately $61 million in fiscal 2027 and interest expense reaching roughly $46 million, "adjusted EBITDA and free cash flow are the most appropriate metrics by which to measure how the business is performing."3 While this focus offers a practical view of operating cash generation, it also diverts attention from GAAP net earnings per share, which declined 20.0 percent in fiscal 2026.2
On May 12, 2026, the company promoted Jeff A. Underwood to Executive Vice President, with Armes characterizing him as the primary driver of growth in Contractor Solutions and the executive responsible for completing and integrating acquisitions.3 Elevating the executive who manages three-quarters of total revenue provides a clear operational signal regarding leadership continuity.
Human capital management also plays a functional role in CSW's business model. For fiscal 2026, the board approved an employee stock ownership plan contribution equal to 6 percent of each U.S. employee's salary, alongside an additional 3 percent profit-sharing 401(k) contribution on top of an existing 6 percent match. Armes noted that employees collectively hold approximately 3 percent of company equity through the plan.3 Additionally, the company was certified as a Great Place to Work for a fourth consecutive year.3 While workforce satisfaction does not constitute an economic moat on its own, retaining experienced sales representatives and trade counter personnel supports the long-standing distributor relationships that underpin the segment's advantage.
Incentives and Governance
Executive compensation structure aligns closely with operational cash flow and shareholder returns. According to the 2026 proxy statement, 84.7 percent of target CEO pay is performance-based, with incentives linked to EBITDA, operating cash flow, and total shareholder return, supported by executive share ownership guidelines, a clawback policy, and prohibitions on hedging and pledging.17
For compensation calculations, the proxy defines return on invested capital as adjusted EBITDA after tax divided by the sum of year-end net debt and shareholders' equity.17 Including net debt in the denominator creates an operational constraint against debt-funded expansion, requiring acquired earnings to offset the additional capital base. However, utilizing pre-amortization adjusted EBITDA in the numerator provides a favorable benchmark for serial acquisitions, as purchase-price amortization is excluded from the calculation. Governance oversight includes a seven-member board with six independent directors, led by Dr. Linda A. Livingstone, who has served as lead independent director since August 2025.17
Testing the Narrative Against Itself
Evaluating management credibility requires comparing executive guidance against operational outcomes over time. On long-term strategy, management has maintained a consistent framework, projecting that Contractor Solutions should generate mid-to-high single-digit organic growth through full economic cycles while acknowledging quarterly volatility. Executive management reiterated this baseline in October 2025 despite a 7.7 percent organic revenue contraction in the segment, observing: "We are not recession-proof, but we have been recession-resistant over time due to the essential nature of the products we sell."4
Management repeated that long-term outlook in May 2026. When questioned by an analyst regarding potential risks to fiscal 2027 growth, Armes focused on relative execution rather than fixed targets, stating: "We are not immune to the market. Last year, the OEMs were down pretty dramatically on volume, and we outperformed them meaningfully. Our expectation is we will outperform the market meaningfully. We have an assumption of a market that is flattish, but we do not have a crystal ball."3
However, near-term forecasting has shown occasional misalignments. In October 2025, management temporarily withdrew qualitative organic growth guidance, stating it was "not able to give an updated view of organic growth for the rest of this fiscal year" and deferring revised estimates to the following quarter.4 Perry acknowledged the forecasting error directly, noting: "We clearly thought we would see organic growth in the middle of the summer. And we and others have said that we missed that."4 This record demonstrates consistent strategic positioning alongside occasional near-term forecasting errors during demand downturns.
Myth vs. Reality: The "40% Gross Margin Floor"
An investment thesis often applied to CSW suggests that management maintained a 40 percent gross margin floor throughout the distributor destocking cycle without discounting, demonstrating strong pricing power. Financial disclosures indicate a more nuanced dynamic. CSW's adjusted gross margin remained above the 40 percent threshold — reaching 42.6 percent for fiscal 2026 and 45.1 percent in the June 2026 quarter — keeping the threshold intact.21 However, margin rates experienced temporary compression during the cycle's trough: consolidated gross margin declined 260 basis points year-over-year in the September 2025 quarter across all three operating segments, while adjusted gross margin fell 70 basis points in the March 2026 quarter due to acquisition dilution, raw material inflation, and tariffs.43
Rather than reflecting absolute pricing immunity, these fluctuations illustrate cost-pass-through mechanics. Management avoided widespread price discounting, emphasizing its commitment to protecting total margin dollars through a "thoughtful rather than reflexive approach to price."3 Consequently, gross margin percentages fluctuated alongside raw material costs, freight rates, and transaction mix. While CSW has sustained elevated gross margin levels, its margin percentage remains subject to broader supply chain cost dynamics.
What the Analysts Keep Asking
Sell-side inquiries on quarterly earnings calls consistently focus on three core areas: distributor channel inventory levels, the breakdown of organic growth between price and volume, and post-acquisition debt leverage. Management has provided detailed disclosures on unit volume versus price dynamics when questioned. For the September 2025 quarter, the company disclosed that legacy Contractor Solutions unit volume declined in the low-double-digit to low-teen percentage range, while pricing realized a mid-single-digit increase.4 For the March 2026 quarter, management reported that pricing actions "more than offset a slight unit volume decline."3 Providing explicit price-volume breakdowns during cyclical downturns offers operational transparency, enabling investors to evaluate underlying demand independent of price adjustments.
With leadership execution and governance disclosures established, evaluating CSW requires assessing its broader competitive positioning.
VIII. Strategic Frameworks: Helmer's 7 Powers & Porter's 5 Forces
Helmer's 7 Powers: Three Held, Two Missing
Strategic frameworks provide the most value when identifying structural vulnerabilities rather than merely validating an investment thesis. Evaluating CSW Industrials through Hamilton Helmer’s 7 Powers framework indicates that the company holds three distinct powers and partially demonstrates a fourth, while lacking the two powers that typically generate long-term compounding.
Process Power and Distribution Access. CSW's primary commercial advantage aligns closely with process power and a cornered resource. Securing shelf space for low-cost components across thousands of wholesale distributor branches is fundamentally a matter of long-term commercial relationships and trust rather than capital expenditure. RectorSeal has cultivated its trade counter distribution footprint since the 1950s.6 The primary evidence of this power lies in post-acquisition operational performance: CSW can acquire a business like Aspen Manufacturing and immediately accelerate its growth rate above standalone historical levels simply by routing products through its existing distribution network.3 Broad distributor relationships support this position, as evidenced by Contractor Solutions being named Vendor of the Year by both Gensco and Standard Supply during the quarter ended March 31, 2026.3
Switching Costs Through Trade Habituation. Switching costs function at the individual contractor level through product habituation. A technician familiar with how a specific thread sealant cures, how a grille fits a rough opening, or how an evaporator coil installs during a retrofit is unlikely to switch brands for minor cost savings when an installation failure risks an unpaid callback. However, this protection stems from contractor habit rather than contractual lock-in. It remains vulnerable to aggressive shelf-space acquisition by competitors or concerted private-label promotion by major distributors.
Scale Economies. Shared administrative, sales, logistics, and enterprise resource planning systems allow acquired companies to eliminate redundant overhead upon integration. The integration of MARS Parts provides clear empirical support, as management expanded its initial $10 million synergy target to $13 million achieved ahead of schedule.414 Most of these savings comprised immediate corporate overhead reductions eliminated at closing rather than recurring operational efficiencies.3 While providing immediate margin expansion, these overhead reductions represent one-time cost captures rather than compounding operational advantages.
Partial Counter-Positioning. Major original equipment manufacturers—such as Carrier, Trane, and Lennox—focus primarily on high-dollar heating and cooling units, leaving component and accessory markets largely unaddressed. However, this dynamic represents a choice of strategic focus rather than a structural barrier to entry, as evidenced by Lennox operating its Advanced Distributor Products division to compete directly against Aspen in evaporator coils. Equipment manufacturers generally refrain from competing in low-cost chemical and hardware categories because those markets generate insufficient scale relative to their core equipment operations, not because entry is prohibited.
Conversely, CSW lacks network effects and consumer brand equity. Residential property owners rarely recognize trade brand names such as RectorSeal, framing the precise boundaries of the company's market power within professional wholesale channels.
Porter's Five Forces: Where the Pressure Actually Comes From
Applying Porter's Five Forces highlights where commercial pressures concentrate across the business model:
Threat of New Entrants: Low. While competing manufacturers can readily formulate chemical sealants or stamp metal hardware, replicating decades of contractor brand preference and establishing catalog placement across national distributor branch networks presents a substantial commercial barrier. The primary barrier to entry remains wholesale channel distribution rather than product manufacturing.
Bargaining Power of Buyers: Moderate. Major wholesale distributors—including Ferguson, Watsco, Johnstone Supply, Winsupply, and Carrier Enterprise—possess substantial purchasing scale. However, customer concentration remains balanced: CSW disclosed in its fiscal 2026 annual report that no single customer accounted for 10 percent or more of consolidated net revenue.13 Furthermore, direct contractor demand limits distributor leverage, as replacing established trade brands requested by name creates operational friction at wholesale trade counters.
Bargaining Power of Suppliers: Low to Moderate. Raw material inputs consist primarily of widely available industrial commodities—including aluminum, copper, steel, PVC resin, base oils, and specialty chemicals—limiting individual supplier power while leaving cost structures exposed to broader commodity cycles. During fiscal 2026, operating results reflected input cost pressures, including raw material inflation, direct and indirect tariff impacts, elevated ocean freight rates, and rising base oil costs.3 Geographic supply chain allocation further influences input exposure. Management disclosed that by the end of fiscal 2026, Contractor Solutions had reduced its cost-of-goods sourcing exposure to China to approximately 10 percent, with Vietnam accounting for the low 30-percent range through a company-owned facility, other Asian countries representing roughly 15 percent, and the remainder produced in the United States.4 As of March 31, 2026, the company employed approximately 2,700 people globally, including roughly 1,500 in North America and 1,200 in Asia-Pacific.13 This manufacturing footprint reflects a multi-year shift away from Chinese production, transferring operational and tariff exposure toward Vietnam.
Threat of Substitutes: Very Low. Building codes and physical installation requirements necessitate specific chemical sealants, condensate traps, evaporator coils, and ventilation components, preventing direct technological substitution for core hardware accessories.
Competitive Rivalry: Low to Moderate. Most component categories remain fragmented, positioning CSW as one of the few scaled consolidators operating across HVAC accessories. However, category fragmentation limits rapid organic market share expansion, necessitating continuous acquisition activity to maintain top-line growth.
Comparing CSW against adjacent industry participants clarifies its market position. Large wholesale distributors monetize contractor relationships through inventory breadth and logistics efficiency, whereas major equipment manufacturers focus on high-capital primary systems while bearing equipment redesign and regulatory burdens. CSW occupies a position between these tiers: generating specialized branded accessories that remain secondary to equipment makers while maintaining sufficient contractor brand preference to avoid commodity treatment by distributors. This positioning supports elevated operating margins but limits organic expansion into adjacent large-scale markets, reinforcing acquisition activity as a core growth driver rather than a secondary strategy.
Ultimately, CSW’s competitive advantage remains rooted in wholesale channel distribution and contractor habituation. While this relative advantage allows the company to outperform broader market growth during expansionary periods, it does not insulate operating performance during cyclical end-market contractions, as demonstrated by organic revenue declines in fiscal 2026.
IX. Activist & Skeptical Investor Stress Test
An activist memo analyzing CSW Industrials' fiscal 2026 annual report would unlikely argue that the company is a poor business. Instead, it would contend that public markets are pricing a compounding growth engine while receiving, at least temporarily, a heavily leveraged consolidator. Four specific challenges define this skeptical thesis.
Challenge One: Compounder or Acquirer?
Is organic growth genuine, or merely purchased? Fiscal 2026 provided skeptical investors with compelling evidence. Consolidated organic revenue declined 2.1 percent, or $18.4 million, while acquisitions contributed $222.6 million in top-line growth.2 Contractor Solutions — designated as the company's primary mid-to-high single-digit organic engine — contracted 3.6 percent organically for the full year and 7.7 percent during the September quarter.24 Stripping acquisition revenue from the company's core operating segment reveals underlying contraction, indicating that deal volume masked operational performance.
The counter-argument involves both cyclical industry dynamics and subsequent performance data. Cyclically, the broader residential HVAC end market experienced contraction: distributors reduced channel inventory, equipment manufacturers reported volume drops, and higher refrigerant-driven system prices led consumers to choose repairs over full replacements.4 CSW managed to outperform that broader downturn. Operationally, Contractor Solutions returned to organic growth, posting 2.6 percent in the March 2026 quarter and 5.9 percent in the June 2026 quarter — two consecutive positive periods that restored performance to historical target ranges.21 Management also presented a pro-forma organic metric assuming MARS Parts and Aspen Manufacturing were owned in prior periods, showing 5.5 percent organic expansion for Contractor Solutions in the March quarter.3 While that metric reflects management's preferred baseline, it highlights underlying performance across recent additions.
This leaves the core investment question unresolved. Two quarterly expansions do not establish a multi-year cycle, particularly given that the June quarter compared against a weak destocking period. A balanced assessment indicates that CSW's organic growth remains genuine but cyclical. The company's through-cycle mid-to-high single-digit organic expansion target survived a sharp downturn that included a two-year recovery period, demonstrating that smooth year-over-year organic compounding remains subject to broader macro volatility.
Challenge Two: The Distributors on the Other Side of the Counter
Customer concentration and private-label threats. A key bear case argument posits that large wholesale distributors could exert pricing pressure or substitute private-label alternatives. Corporate disclosures show limited acute concentration, with no single customer representing more than 10 percent of fiscal 2026 revenue.13 However, ongoing distributor consolidation and the vulnerability of low-differentiation consumables to private-label substitution maintain this underlying risk. The primary defense remains contractor brand preference at the counter, which can be monitored through the price-versus-volume breakdowns management provides on quarterly calls. Sustained price increases alongside eroding unit volumes in a healthy end market would signal market share loss disguised as pricing power.
Challenge Three: The Deferral Nobody Modeled
Macroeconomic and housing market sensitivity. While emergency equipment replacements are non-discretionary during summer months, fiscal 2026 demonstrated a subtler consumer response: when replacement unit prices rise sharply, homeowners defer complete system replacements by choosing component repairs. CSW's legacy portfolio carried heavy exposure to full replacement and new construction components, particularly in grilles, registers, and diffusers, which underperformed as residential starts slowed.4 The $985 million deployment into Aspen Manufacturing and MARS Parts served as a strategic pivot, expanding repair-market exposure to counterbalance installation softness.
Challenge Four: Discipline, Measured When It Was Expensive
Leverage and balance sheet discipline. Balance sheet management represents a critical point of investor scrutiny. The company transitioned from a conservative 0.12 times net leverage position in September 2025 to 2.55 times by March 2026.43 Financing involved a combination of 2024 equity proceeds and $600 million in new term debt, alongside $128 million in share repurchases executed while integrating its largest transaction to date.3 Fiscal 2026 operating cash flow dropped 11.1 percent to $149.7 million despite a 23.3 percent top-line increase, and the March quarter generated a free cash outflow of $6.8 million — compared to a $22.8 million inflow a year earlier — as working capital requirements, integration costs, and debt service expanded.23
Subsequent quarterly performance demonstrated rapid cash generation. In the June 2026 quarter, operating cash flow rebounded 25 percent to $75.6 million, free cash flow reached $69.6 million, and net leverage declined to 2.37 times, even as the company repurchased $36.3 million in shares and distributed its thirtieth consecutive quarterly dividend of $0.30 per share.1 On its fourth-quarter earnings call, management outlined a clear capital allocation hierarchy: prioritize operational integration, evaluate selective bolt-on acquisitions, execute share buybacks opportunistically, and direct remaining cash flow toward debt reduction.3 Annual interest expense for fiscal 2027 was guided to approximately $46 million to $48 million.314
This debt posture requires ongoing monitoring rather than immediate alarm. CSW has demonstrated a track record of rapid deleveraging following major acquisitions, such as TRUaire and Aspen, and leverage of 2.37 times sits within its stated target range of 1.0 to 3.0 times. Nonetheless, executing a $650 million transaction following fifteen months of organic contraction indicates an aggressive capital deployment stance that increases execution sensitivity.
Portfolio Complexity and the Question Nobody Asked
A governance review of CSW's organizational structure highlights notable portfolio complexity. The company operates three distinct segments: one generating the vast majority of consolidated profits, one consistently working toward its 20 percent EBITDA margin benchmark, and a third that recently absorbed a non-cash impairment and divested its primary operating unit. While exiting Greco represented sound capital discipline, it raises broader questions regarding the strategic fit of Engineered Building Solutions.
Capital markets discussions have focused primarily on Contractor Solutions, leaving the smaller segments under limited external scrutiny. Proponents of retaining Engineered Building Solutions point out that, excluding Greco, the core business delivered an adjusted EBITDA margin above 20 percent alongside a trailing eight-quarter book-to-bill ratio of 1.05 to 1, indicating backlog growth relative to revenue.3 Conversely, operating a project-based commercial construction unit alongside a residential trade counter business risks diluting management focus, particularly while integrating $1 billion in recent acquisitions. The divestiture of Greco demonstrates management's willingness to reallocate capital away from underperforming units when necessary.
X. Risk Radar & The 1–3 KPIs That Matter Most
The Risks That Actually Have a Mechanism
Not every macro risk applies to a company that sells condensate traps. The ones that do apply share a mechanism, and the mechanism is worth naming precisely.
Distributor channel bullwhip. CSW does not sell to contractors; it sells to the distributors who sell to contractors. That one degree of separation creates amplification. When end demand softens, distributors stop reordering before they stop selling, so CSW's revenue falls faster than the underlying market. When demand recovers, the reverse happens. The CFO described the asymmetry directly: "As they restock, our growth rate could be higher than our customers report due to timing differences."4 Investors reading a single quarter of CSW's organic growth are reading a signal with a distributor-inventory error term attached — in both directions.
Input cost and tariff exposure. The mechanism is a lag, not a level. Costs enter through cost of goods over several months as inventory turns; price increases go out on an annual cadence in Contractor Solutions and more frequently elsewhere. In fiscal 2026 CSW took its normal Contractor Solutions increase effective June 2025 and three separate increases in Specialized Reliability Solutions on the first of April, May and June 2026, plus a 7% increase in that segment effective late September 2025.43 The result is a margin rate that compresses during inflation even when margin dollars are protected. Management said explicitly it had not yet taken incremental Contractor Solutions pricing action as of the May 2026 call, preferring to absorb the lag rather than knee-jerk.3
Acquisition integration and execution. With almost $1.2 billion deployed across fiscal 2024–2026, the concentration of integration risk is unusual for a company this size.13 The MARS ERP conversion in January 2026 delayed some order fulfillment early in the March quarter — a small, disclosed, temporary problem, but a live illustration of what integration risk looks like in practice.3
Concentration in Vietnam. Roughly 1,200 of the company's 2,700 employees sit in Asia Pacific, and Contractor Solutions' Vietnamese sourcing is in the low thirties as a share of segment cost of goods, largely through a company-owned plant.134 The multi-year migration out of China reduced one exposure by increasing another. Any tariff or trade action touching Vietnam would land directly on the segment that produces most of CSW's profit.
Accounting judgment. The fiscal 2026 impairment was a goodwill, intangible and long-lived asset write-down of $15.6 million tied to the Greco decision, with $2.1 million of Canadian exit expense and $1–2 million more anticipated.3 The Greco U.S. business was classified as held for sale at March 31, 2026. Separately, the company changed its adjusted EPS methodology during fiscal 2026 to exclude amortization of acquired intangibles — a change disclosed and applied consistently, but one that flatters year-over-year adjusted EPS comparisons for a company whose intangible amortization steps up to roughly $61 million in fiscal 2027.43 The gap between fiscal 2026 GAAP EPS of $6.70 and adjusted EPS of $10.38 is not a red flag on its own, but it is large, and it is growing.2
One risk that does not obviously apply is technological disruption. There is no software substitute for a physical condensate trap, and the artificial intelligence wave that threatens information-services business models mostly shows up here as a productivity tool rather than a competitive threat — management described deploying AI tools to help customers track orders and to manage inventory and receivables more efficiently, framed as incremental operating leverage rather than as strategy.3 Investors should be appropriately skeptical of that framing in both directions: it is neither the disruption risk some sectors face nor the transformative opportunity that phrase sometimes implies.
The Three Numbers That Settle the Argument
Given all of that, three metrics carry most of the signal. Not a dashboard — three.
1. Contractor Solutions organic revenue growth. This is the single number that settles the argument between "compounder" and "acquirer." It strips out purchased revenue and reports whether the trade counter is actually pulling product through. The reference points are established: negative 3.6% for fiscal 2026, positive 2.6% in the March 2026 quarter, positive 5.9% in the June 2026 quarter, against a management claim of mid-to-high single digits through the cycle.21 Watch also the price-versus-volume split management discloses when asked, because pricing-driven growth with declining volume is a materially different outcome than balanced growth.
2. Consolidated adjusted gross margin, and Contractor Solutions segment EBITDA margin alongside it. Gross margin tests whether pricing power survives input inflation and acquisition mix. Adjusted gross margin was 42.6% for fiscal 2026 and 45.1% in the June 2026 quarter; Contractor Solutions segment adjusted EBITDA margin ran 30.7% for fiscal 2026 and 34.2% in the June quarter.21 The segment margin is the better test of the acquisition thesis specifically, because acquisitions arrive dilutive and are supposed to converge upward as synergies land. MARS reaching a 30% run-rate margin by its November 2026 anniversary is the near-term checkpoint management has publicly committed to.3
3. Free cash flow conversion and the trajectory of net leverage. These are one metric in practice, because the promise embedded in the roll-up model is that acquisitions convert to cash fast enough to delever and fund the next deal. Fiscal 2026 was the stress test and it was uncomfortable — operating cash flow down 11.1% on 23.3% revenue growth.2 The June 2026 quarter was the rebuttal — free cash flow of $69.6 million and leverage down to 2.37x.1 The reported trailing free cash flow per share of $8.72 is the cleanest single number for tracking whether the machine is converting.14
Everything else — backlog in Engineered Building Solutions, the SRS margin target, the pace of bolt-ons — is secondary to those three.
A note on what not to track. Reported revenue growth is close to useless for this company in the near term, because it blends purchased and organic revenue, and because the deliberate SKU rationalization at MARS is shifting demand between reported entities. GAAP earnings per share is similarly distorted by an intangible amortization step-up that has nothing to do with cash generation and by interest on debt that is being repaid. Neither is a reason to accept management's adjusted figures uncritically — the adjusted EPS methodology change makes year-over-year comparisons more flattering than they would otherwise be — but both are reasons to anchor on the three metrics above rather than on the headline numbers that will move first.
XI. Bear vs. Bull Case & Playbook Lessons
The Bear Case
The bear case does not require anything to go dramatically wrong. It only requires the last twelve months to have been an exception rather than a temporary cyclical pause.
Start with the demand backdrop. Existing home sales and new housing starts remained sluggish through the period, leading management to project a flat market for fiscal 2027 with no expectation of rate relief. On its fiscal fourth-quarter earnings call, management noted that its forecast assumed "a flat interest rate curve for the rest of the calendar year."3 If replacement demand remains deferred, CSW's legacy installation-linked products will continue to underperform, placing the burden of top-line expansion entirely on acquired revenue. A second consecutive year of organic contraction would materially undermine the company's through-cycle compounding thesis.
Next is the rising cost of growth. Higher interest rates elevate the hurdle rate for M&A and slow the transaction pipeline. Management observed that the industry saw no major transactions during the first half of calendar 2026, noting its own near-term focus would center on smaller bolt-ons while digesting the $1 billion already deployed.3 A serial acquirer unable to execute large deals must rely on organic growth—which leads directly back to the primary concern. Meanwhile, fiscal 2027 carries roughly $46 million to $48 million in interest expense alongside approximately $61 million in intangible amortization. Consequently, GAAP earnings will remain suppressed even during a strong operating year, further widening the gap between GAAP and adjusted figures.314
Compounding these risks are margin pressures from commodity and freight inflation subject to multi-month pass-through lags, potential private-label encroachment as wholesale distributors consolidate, and the reality that the Greco impairment demonstrated the acquisition engine can misstep. While none of these factors is fatal individually, together they portray a company whose growth is more acquired, more leveraged, and more cyclical than its compounder narrative implies.
The Bull Case
The bull case rests on a narrower and more testable claim: that the distribution position is real and that it converts acquired products into faster-growing products.
Empirical support for this thesis is substantial. Aspen Manufacturing expanded revenue by 13.5 percent under CSW ownership during the March 2026 quarter despite a depressed broader market.3 Target synergies for MARS Parts—initially set at $10 million and later raised to over $12 million—were delivered at $13 million, reaching the 30 percent EBITDA margin goal ahead of its one-year anniversary.314 Following the distributor destocking trough, Contractor Solutions recorded two consecutive quarters of organic expansion, capped by a June 2026 quarter that generated a record $101.6 million in consolidated adjusted EBITDA at a 29.0 percent margin—up 290 basis points year-over-year—and adjusted earnings per share of $3.84, a 34.6 percent increase.1 Adjusted gross margin expanded 110 basis points despite initial acquisition mix dilution.1 Meanwhile, net leverage declined even as the company repurchased shares and raised synergy targets.
If the June 2026 quarter proves representative rather than anomalous, the math becomes compelling: a business generating approximately $1.17 billion in trailing revenue and $302.5 million in trailing adjusted EBITDA, with a proven track record of acquiring targets at seven to eleven times EBITDA and routing them through an established distribution channel, can compound free cash flow per share at a healthy pace without requiring aggressive assumptions.14 Regulatory shifts offer marginal product mix support, while expanded exposure to repair components leaves the business less reliant on the direction of residential construction cycles.
The honest synthesis is that the bull and bear cases are not arguing about the quality of the business. They are arguing about the durability of one number—Contractor Solutions organic growth—and about the price of the acquisitions required to keep total revenue growing when that number disappoints.
Framed through the two strategic lenses already applied, the disagreement resolves into something specific. The Helmer question is whether the distribution position is a durable power or a long lead that competitors and consolidating distributors gradually close. The Porter question is whether buyer power stays moderate as distribution consolidates. Neither question will be answered by a press release. Both will be answered slowly, in the price-versus-volume split, in whether acquired brands keep outgrowing their end markets after the first year of ownership, and in whether the company's largest customers keep buying more categories from it rather than fewer. Those are observable metrics. An investor who tracks them is doing real analytical work; an investor who tracks only the valuation multiple is not.
Playbook Lessons
The durable lessons extend well beyond this particular company.
Low-cost, mission-critical consumables are structurally advantaged. Not because the products are hard to manufacture, but because the cost of component failure is enormous relative to purchase price, which suppresses buyer price sensitivity and hardens habit into something functionally close to a switching cost. Investors seeking this pattern should look for the ratio between the price of the part and the financial cost of its failure, not the technical complexity of the item.
Distribution position is the primary asset; product is the freight it carries. CSW's most valuable inheritance from Capital Southwest was not a chemical formula. It was nearly ninety years of shelf space and trade counter relationships, which the company utilized as a distribution platform for everything else. The key strategic insight was recognizing that the wholesale channel, not the product catalog, was the durable asset—and organizing every subsequent capital allocation decision around whether an acquired product line could ride that channel.
A spin-off can transform a passive asset basket into an operating platform—but that transformation is an active choice, not an automatic event. CSW inherited five unrelated operating businesses and a dealmaker CEO. What produced the outcome was the management decision to concentrate capital rather than diversify, alongside the willingness—demonstrated with Greco a decade later—to divest an asset that stopped clearing return hurdles.
Discipline is a claim that only carries weight when tested. CSW's capital allocation record includes equity issued near a high and repurchased lower, acquisition multiples disclosed on both an adjusted and unadjusted basis, synergy targets raised and met early, net leverage taken to 2.55 times and brought back within target range inside two quarters—and a written-down business sold at a loss. That represents a nuanced operational record presented with high reporting transparency, providing investors with the empirical evidence needed to judge whether the strategy will deliver long-term compounding.
References
-
CSW Industrials Reports Impressive Fiscal 2027 First Quarter with All-Time Record Results; Contractor Solutions Segment Delivers Second Consecutive Quarter of Positive Organic Growth — GlobeNewswire, 2026-07-30 ↩↩↩↩↩↩↩↩↩↩↩↩↩↩↩↩↩
-
CSW Industrials Reports Robust Fiscal 2026 Fourth Quarter with Record Quarterly and Full Year Results; Contractor Solutions Segment Returns to Positive Organic Growth in Fourth Quarter — GlobeNewswire, 2026-05-26 ↩↩↩↩↩↩↩↩↩↩↩↩↩↩↩↩↩↩↩↩
-
CSW Industrials Fiscal 2026 Fourth Quarter and Full Year Earnings Call Transcript — Seeking Alpha, 2026-05-26 ↩↩↩↩↩↩↩↩↩↩↩↩↩↩↩↩↩↩↩↩↩↩↩↩↩↩↩↩↩↩↩↩↩↩↩↩↩↩↩↩↩↩↩↩↩↩↩↩↩↩↩↩↩↩↩↩↩↩
-
CSW Industrials Fiscal 2026 Second Quarter Earnings Call Transcript — Seeking Alpha, 2025-10-30 ↩↩↩↩↩↩↩↩↩↩↩↩↩↩↩↩↩↩↩↩↩↩↩
-
Capital Southwest Corporation Completes Spin-Off of CSW Industrials — GlobeNewswire, 2015-10-01 ↩↩↩
-
CSW Industrials Announces Definitive Agreement to Acquire TRUaire for $360 Million — GlobeNewswire, 2020-11-05 ↩↩↩↩
-
Latham & Watkins Advises Aspen Manufacturing in Acquisition by CSW Industrials for US$313.5 Million — Latham & Watkins, 2025-03-18 ↩
-
CSW Industrials Completes Previously Announced Accretive, Complementary, and Synergistic Acquisition of Motors & Armatures Parts — GlobeNewswire, 2025-11-04 ↩↩↩↩
-
CSW Industrials Announces Transfer of Listing of Common Stock to the New York Stock Exchange and Change in Ticker Symbol — GlobeNewswire, 2025-04-29 ↩
-
CSW Industrials Announces James E. Perry to Become Executive Vice President and Chief Financial Officer — GlobeNewswire, 2020-04-21 ↩
-
CSW Industrials, Inc. Annual Report on Form 10-K for Fiscal Year Ended March 31, 2026 — filing summary, 2026-05-26 ↩↩↩↩↩↩↩↩↩↩↩
-
CSW Q1 FY27 slides: record results, 33% revenue growth, margins expand — Investing.com, 2026-07-30 ↩↩↩↩↩↩↩↩↩
-
Technology Transitions HFC Restrictions by Sector — U.S. Environmental Protection Agency ↩↩
-
CSW Industrials Reports Record Fiscal 2025 Second Quarter Results — GlobeNewswire, 2024-10-30 ↩
-
CSW Industrials, Inc. Definitive Proxy Statement (DEF 14A) — filing summary, 2026 ↩↩↩
-
CSW Industrials, Inc. (CSW.N) Company Profile & Quote — Reuters ↩↩
 LinkedIn
 WhatsApp
 Reddit
 Hacker News
 Email
Email Kindle
 RSS Feed
 Spotify
 Apple Podcasts
 Amazon Music
 Audible
 YouTube