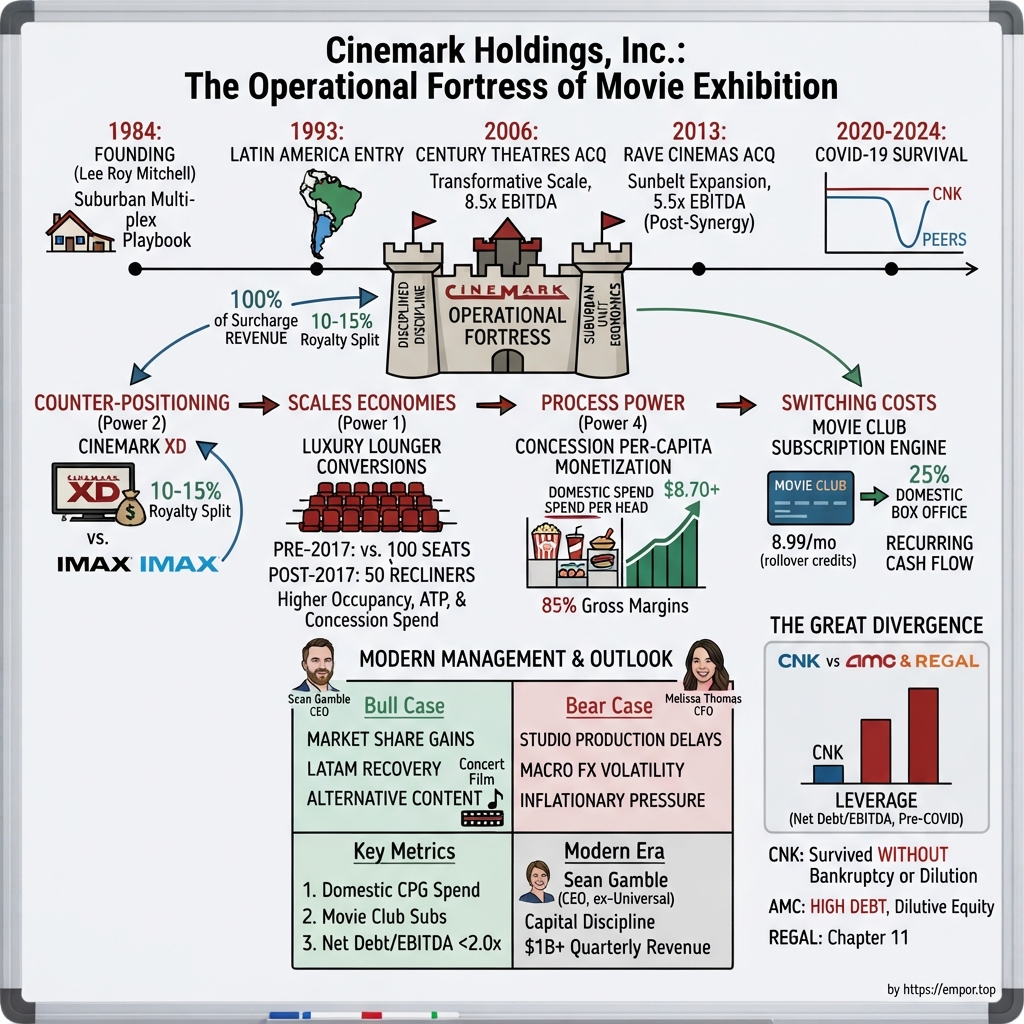
Cinemark Holdings, Inc.: The Operational Fortress of Movie Exhibition
I. Introduction & Episode Roadmap
On July 30, 2026, a company long viewed by Wall Street as facing secular decline reported the highest quarterly revenue in its 42-year history. Cinemark Holdings, the third-largest movie theatre chain in North America, generated over $1 billion in quarterly revenue for the first time. More than 60 million patrons attended a Cinemark auditorium during the quarter. Admissions revenue reached an all-time high of $540 million, while concession sales set a record at $433 million. Adjusted EBITDA reached $294 million, representing a 27.1% margin — the company's second-best margin on record, missing its all-time peak by 10 basis points.12
These results challenged the narrative of an industry in terminal decline.
However, a side-by-side comparison with its primary peer tempers any broader industry resurrection narrative. During the same quarter, industry leader AMC Entertainment — operating roughly 850 theatres and 9,500 screens — generated $1.60 billion in revenue compared to Cinemark's $1.08 billion. Yet AMC converted its larger top line into $321.4 million in adjusted EBITDA, a 20.1% margin. Cinemark, operating on two-thirds of AMC's revenue, produced 91% of its EBITDA.31 The divergence in balance sheet health was equally stark: AMC held $3.91 billion in corporate borrowings and a shareholders' deficit of $1.45 billion, after its diluted share count expanded from 433 million to 722 million over the preceding year.3 Cinemark ended the quarter with $504 million in cash, approximately $1.9 billion in gross debt, and a net leverage ratio of 2.0 times.4
That performance gap — across identical films, studio terms, and operating weekends — defines the company's central narrative and highlights why Cinemark warrants decision-oriented analysis rather than simple sentiment.
Attributing this performance solely to superior operational execution is incomplete. A more precise framing centers on a series of structural choices made over previous decades: prioritizing suburban real estate over high-cost urban locations, developing a proprietary premium large-format screen rather than licensing one, implementing a margin-protective subscription model, and maintaining conservative leverage capable of absorbing extended revenue disruption. When pandemic restrictions halted theater operations, those choices preserved Cinemark's balance sheet flexibility while severely constraining competitors, allowing the company to capture post-crisis market share.
Whether those market share gains reflect a permanent structural advantage or a temporary cyclical surge remains an open question for investors, and management has avoided aggressive assertions. On the fourth-quarter 2025 earnings call, Chief Executive Officer Sean Gamble told analysts the company believed "at least 100 basis points" of its post-pandemic market share gains were sustainable — a conservative assertion.5 Six months later, on the second-quarter 2026 call, Chief Financial Officer Melissa Thomas took a cautious stance, telling analysts that Cinemark requires "more runway of a consistent box office to see what is structural within those market share gains."2 This restraint underscores that management has yet to validate the permanency of its market expansion.
The roadmap for this analysis is as follows:
- The founding. Lee Roy Mitchell, the son of a Texas drive-in operator, building a suburban multiplex model from 1984 onward and expanding into Latin America in 1993, well ahead of industry peers.
- The two deals that shaped the company. The acquisitions of Century Theatres in 2006 and Rave Cinemas in 2013, examining transaction economics and antitrust scrutiny into related-party arrangements involving the founder.
- The margin wedge. The economics of Cinemark XD (the largest exhibitor-branded premium format), Luxury Lounger recliner rollouts, and Movie Club, a subscription service designed for margin preservation.
- The Great Divergence. The operational breakdown between 2020 and 2024 during total industry shutdown, showing why Cinemark maintained its equity base while competitors faced restructuring or severe dilution.
- The modern operating model. Economics across US and Latin American segments, film rental cost structures, and high-margin concessions as the core profit driver.
- The strategic stress test. The Sean Gamble leadership era, executive compensation alignment, competitive moat framework (7 Powers and Five Forces), and the investment thesis as of August 2026.
The story begins in Texas during the early 1960s, at a Ford dealership.
 Subscribe on LinkedIn
II. Company Origins & The Suburban Multiplex Playbook (1984–2005)
Lee Roy Mitchell was selling cars in Forney, Texas, when his father called. The elder Mitchell owned small theatres in Bastrop and Elgin, and in 1962 he asked for his son's help buying a drive-in in Ennis, a town southeast of Dallas.6 That drive-in marked the start of a theatrical exhibition career spanning more than six decades — and established the operating logic of the company Mitchell would build.
Small-town drive-ins of the 1960s did not compete for top-tier films; exhibitors received titles weeks after urban theaters. Success depended on controlling cost per seat, driving rapid concession throughput, and filling lots on off-peak nights. Mitchell is credited with popularizing the discount admission night, a promotion later adopted across the industry.6 Rather than relying on prestige titles, Mitchell focused on yield management: with near-zero marginal cost per additional patron once a projector is running, discounted admission can drive high-margin concession sales. Mitchell learned exhibition economics from the bottom of the market.
In 1984, Mitchell opened his first Cinemark theatre in the United States, expanding the circuit throughout the late 1980s and 1990s.7 The core strategic insight was geographic. While rival chains competed in dense urban centers and coastal metros with elevated rents, labor costs, and real estate prices, Mitchell targeted underserved markets: suburbs, exurbs, and mid-sized metropolitan areas across the Sun Belt and American interior. Rather than constructing bespoke urban palaces, Cinemark built purpose-designed multiplexes with standardized footprints, repeatable construction, and lean staffing models.
A movie theatre functions as a fixed-cost asset. Rent, taxes, insurance, utilities, and base labor remain relatively static regardless of attendance. Because film studios capture roughly half of ticket revenue, an exhibitor's most critical financial metric is occupancy cost per screen — the baseline cost to keep an auditorium open. A suburban multiplex carries a structurally lower fixed cost than a location in Manhattan or San Francisco. That cost differential compounds over time. During soft box office cycles — such as 2025, when North American industry box office reached approximately $8.9 billion — operators with lower fixed costs per screen maintain profitability while higher-cost competitors face margin compression.7
Cinemark also treated concessions as its primary profit engine. While several competitors pursued capital-intensive dine-in concept conversions, Cinemark focused on optimizing high-margin core concessions: popcorn, fountain drinks, and candy. These items feature low cost of goods sold and prioritize counter throughput over menu complexity. The economics remain central to the business: in 2025, Cinemark generated $1,227.2 million of concession revenue against $240.5 million of concession supplies expense, yielding a gross margin north of 80%.7 In effect, ticket sales cover distributor terms, while concessions generate operating returns.
In 1993, Cinemark expanded internationally by opening a theatre in Santiago, Chile.7 While domestic peers focused on North America, Cinemark built a presence across Latin America — including Brazil, Argentina, Colombia, Peru, and Central America — securing anchor positions in shopping centers during the region's retail expansion. Today, that footprint spans 13 Latin American countries.7 Beyond top-line growth, international operations provided geographic and content diversification, offsetting regional box office volatility while securing real estate on favorable terms.
By the mid-2000s, Cinemark had established a low-cost, high-cash-conversion, geographically diversified exhibition circuit. In 2004, private equity firm Madison Dearborn Capital Partners acquired a controlling interest in the company.8 That institutional backing positioned Cinemark to shift from organic site development to large-scale acquisitions — setting up its next phase of growth.
III. Strategic Expansion & M&A: The Century & Rave Plays
Century Theatres was, in many respects, Cinemark's mirror image. Founded in 1941 by Raymond J. Syufy and run by his sons Raymond W. and Joseph, it was a family business operating across the American West, including California, Nevada, and Washington. By 2006, it operated 78 theatres with 994 screens.8 Where Cinemark had scaled through repeatable suburban builds, Century had built a reputation for premium amenities: 77% of its screens featured stadium seating, an unusually high proportion for the era.9
On August 8, 2006, the two companies announced a merger. "This transaction establishes the premier international movie theatre circuit," Raymond Syufy said in the announcement.8 When the acquisition closed on October 5, 2006, the combined company operated approximately 391 theatres and 4,395 screens across 37 states and 13 countries.8
While contemporary accounts often characterized the Century acquisition as a $1.5 billion transaction, Cinemark's SEC filings show an actual purchase price of approximately $681 million, plus the assumption of roughly $360 million in debt — establishing an enterprise value near $1.04 billion.9 The Syufy family accepted part of its consideration in equity, receiving just over 10 million shares.9 Although Cinemark did not disclose a trailing EBITDA multiple, the deal added about 23% to Cinemark's screen count while securing West Coast screens in affluent suburban markets where per-screen revenue substantially exceeded Cinemark's circuit average.
The strategic rationale extended beyond screen counts. First, national scale strengthened film licensing negotiations. Studios allocate prints and terms circuit by circuit; expanding into major West Coast markets like Los Angeles, San Francisco, and Seattle gave Cinemark greater bargaining leverage with distributors. Second, Cinemark retained the Century brand in Western markets rather than rebranding every marquee. Preserving established local brand equity in markets where consumer loyalty attached to individual theatre locations protected customer goodwill.
The Century acquisition laid the groundwork for Cinemark's public listing. On April 23, 2007, Cinemark Holdings priced its initial public offering of 28 million shares at $19.00 per share, with trading commencing on the New York Stock Exchange the following day under the ticker CNK.10 Controlling shareholder Madison Dearborn Capital Partners used the offering to reduce its ownership stake from 66.3% to 47.2%, while Cinemark applied its net proceeds toward debt reduction.10 The transaction completed Cinemark's transition into a publicly traded corporation retaining founder leadership alongside an exiting private equity sponsor.
Cinemark's second major transaction offered a clearer look at its capital allocation strategy. On November 16, 2012, Cinemark announced an agreement to acquire substantially all assets of Rave Cinemas — comprising 32 theatres and 483 screens across 12 states — for approximately $240 million.11 Unlike the Century acquisition, Cinemark disclosed Rave's financial metrics: for the twelve months ending September 27, 2012, the target circuit generated $228.9 million in revenue, 18.8 million patrons, and $41.7 million in adjusted EBITDA.11
At $240 million, the purchase price represented an unadjusted trailing EBITDA multiple of roughly 5.8 times — prior to overhead synergies, purchasing efficiencies, or concession margin optimization. The acquired portfolio was fully digitized, contained seven IMAX auditoriums and nine proprietary premium large-format screens, and established Cinemark in seven new designated market areas, including New England.1112 Chief Executive Officer Tim Warner highlighted the expansion of Cinemark's proprietary XD brand to 129 screens worldwide as a key strategic driver of the deal.12
The transaction faced regulatory hurdles. On May 20, 2013, the U.S. Department of Justice and the State of Texas filed an antitrust complaint against Cinemark Holdings, Rave Holdings, and Alder Wood Partners, alleging the deal would substantially lessen competition in first-run movie exhibition across several regional markets — including eastern Louisville and the Voorhees-Somerdale market in New Jersey — in violation of Section 7 of the Clayton Act.13
The court filings also revealed a related-party conflict. Movie Tavern, Inc., a Dallas-based dine-in theatre chain operating locations in Fort Worth and Denton, was controlled by Cinemark founder and chairman Lee Roy Mitchell and majority-owned by Alder Wood Partners — placing it in direct competition with Rave in parts of Texas.13 To settle the regulatory challenge, Cinemark agreed to divest Movie Tavern alongside additional Texas locations, ultimately divesting three theatres under the Department of Justice's final consent judgment.1312 The transaction closed on May 29, 2013, expanding Cinemark's domestic circuit into 40 states.12
The antitrust intervention highlighted governance risks tied to founder-related holdings operating in adjacent market segments. Mitchell eventually relinquished his executive chairman role and retired from Cinemark's board of directors in February 2023 at age 85.6
Cinemark's commercial ecosystem also relied on joint venture partnerships, most notably National CineMedia (NCM), the in-theatre advertising network behind the "Noovie" pre-show. When NCM filed for Chapter 11 bankruptcy restructuring and emerged on August 7, 2023 under lender ownership, Cinemark's equity stake in the operating entity was wiped out.14 However, the underlying commercial agreement survived: Cinemark continues to receive a monthly theatre access fee that combines a per-patron screen rental rate with revenue sharing.7 The bankruptcy demonstrated that Cinemark's operational cash flow was insulated by its distribution contract even as its equity investment lost all value.
With the Century and Rave acquisitions completed and its advertising revenue secured through long-term contracts, Cinemark turned its attention from expanding screen count to maximizing screen productivity.
IV. Innovation & Premiumization: Cinemark XD, Recliners, & Movie Club
Around 2009, the theatrical exhibition industry reached a strategic crossroads as audiences began paying premium prices for larger screens and enhanced audiovisual presentation. While competitors such as AMC Entertainment chose to license established third-party formats like IMAX, Cinemark evaluated the underlying unit economics and pursued a proprietary strategy.
The primary drawback of third-party licensing lies in ongoing revenue distribution rather than technology. Under standard licensing arrangements, the exhibitor funds the specialized auditorium hardware and construction costs while also sharing box office receipts with the licensor—on top of the film rental fees owed to studios. On sold-out blockbuster weekends with a $4 to $5 ticket surcharge, the exhibitor retains a significantly smaller share of incremental revenue than it would from an auditorium it owns outright.
In response, Cinemark developed its proprietary premium large format, Cinemark XD, featuring wall-to-wall screens, surround sound, and recliner seating in most auditoriums. Cinemark XD grew into the largest exhibitor-branded premium large-format footprint globally, encompassing 301 XD auditoriums as of December 31, 2025, alongside 16 licensed IMAX and 12 ScreenX screens.7 In SEC filings, the company notes that XD provides strategic programming flexibility, allowing management to schedule any content on those screens "with no additional revenue share component outside of routine film rental."7
That economic structure operates along two main axes: margin retention and programming agility. By eliminating licensor revenue sharing, Cinemark retains the full premium ticket surcharge. Furthermore, because third-party licenses often carry contractual scheduling commitments, a proprietary format enables Cinemark to align screen inventory with live box office demand on any given weekend—whether placing an overperforming mid-budget title, a faith-based film, an anime release, or alternative content into its highest-yielding auditoriums. At the same time, Cinemark maintains selective third-party partnerships where local market economics justify them. In the first half of 2026 alone, the company added seven XD auditoriums, twelve ScreenX houses, two IMAX screens with three 70-millimeter projectors, and 112 D-BOX motion-seat auditoriums, bringing the circuit to roughly 350 premium large format screens and about 660 D-BOX auditoriums globally.2
Management has acknowledged the natural ceiling of premium screen conversion. Chief Executive Officer Sean Gamble noted on both the fourth-quarter 2025 and second-quarter 2026 earnings calls that premium formats generate roughly 15% of overall box office, leaving the remaining 85% to standard auditoriums.52 Consequently, premiumization functions as a margin enhancer rather than a standalone operating model. Physical constraints also limit deployment, as smaller auditoriums cannot accommodate premium screen dimensions. Approximately 10% of Cinemark's domestic circuit features two XD screens, indicating a real but bounded expansion runway.5
Cinemark's second major premiumization initiative centered on seating upgrades. Installing electric "Luxury Lounger" recliners represented a fundamental shift in real estate utilization, as each recliner occupies roughly twice the floor space of a standard seat, effectively cutting an auditorium's seating capacity in half.
Reducing physical seat capacity in a fixed-cost business succeeds because average weekly theater occupancy across the industry historically hovers in the low double digits. Because unassigned standard seats during off-peak showtimes generate minimal revenue, recliner conversions trade unused seat inventory for enhanced pricing power. Reserved recliner seating supports higher ticket prices, encourages advance online ticketing, boosts concession participation by drawing guests earlier, and differentiates locations from nearby competitors. The primary capacity constraint occurs during opening weekend peak hours for major blockbuster releases, a bottleneck Gamble addressed with analysts in July 2026 when several major titles opened concurrently.2 As of year-end 2025, 69% of Cinemark's domestic circuit featured Luxury Loungers, and management stated on the fourth-quarter call that domestic recliner coverage had reached 72% and that attractive conversion opportunities remained.75
Beyond auditorium hardware upgrades, Cinemark introduced a subscription model designed to stabilize attendance and protect operating margins.
On December 5, 2017, Cinemark announced Movie Club: $8.99 a month for one 2D ticket, with unused tickets rolling over indefinitely, additional tickets at the same $8.99 member price, waived online fees, and a 20% discount on concessions.15 Unlike third-party subscription attempts such as MoviePass—which offered unlimited daily tickets below cost while reimbursing exhibitors at full face value—Cinemark built a financially sustainable structure.
By capping base subscription usage at one ticket per month, Cinemark bounded its marginal cost per subscriber. The rollover feature converts potential breakage into stored credit, creating an effective switching cost for members who accumulate unused ticket balances. Furthermore, the 20% concession discount incentivizes subscriber spending at the company's highest-margin profit center.
Operational metrics reflect the program's commercial scale. By the second quarter of 2026, Movie Club exceeded 1.5 million paid subscribers, delivering approximately 30% of Cinemark's domestic box office while surpassing 200 million lifetime ticket sales and averaging over 5,000 members per theatre.1 Combined with the free Movie Fan tier and international equivalents, Cinemark's global loyalty ecosystem reaches roughly 30 million enrolled moviegoers globally, with Gamble placing total addressable direct-marketing reach at 40 million consumers worldwide and direct channels accounting for about half of company revenue.12 Management has noted that subscription growth is maturing; although Movie Club enrollment has expanded more than 50% above 2019 levels, Gamble informed analysts that he expects membership growth to "level off a bit more as the program continues to mature."5
This direct customer relationship provides Cinemark with proprietary consumer data and targeted marketing reach. By tracking moviegoer preferences and maintaining direct communication channels, the company reduces reliance on distributor marketing campaigns, strengthening its demand-generation capabilities during periods of film supply volatility.
V. COVID-19 Survival & Balance Sheet Divergence
In March 2020, every screen went dark.
For a business whose costs are fixed and whose revenue arrives daily in cash, that is the worst possible shock — not a demand decline but a demand deletion, with the rent still due. The numbers are almost hard to read. Cinemark's revenue fell from $3.28 billion in 2019 to $686.3 million in 2020, and the company posted a net loss of $616.8 million.16 Then 2021 brought $1.51 billion of revenue and another $422.8 million loss, and 2022 brought $2.45 billion and a further $271.2 million loss.17 Three consecutive years of losses totaling roughly $1.3 billion.
Every major exhibitor faced the identical shock. What separated them was entirely what they had done before it arrived — which is the single most important lesson in this entire story.
Consider the three responses.
Cineworld and Regal. In 2018, the UK-listed Cineworld Group acquired Regal Entertainment for $3.6 billion, creating the world's second-largest chain with 747 sites and 9,139 screens across ten countries.18 The deal was debt-financed. When the pandemic hit, Cineworld was carrying roughly $5 billion of debt against zero revenue, and no amount of operational competence can service that. In September 2022, Cineworld filed for Chapter 11 protection in the Southern District of Texas.18 The restructuring that followed did what restructurings do: wiped out the equity, rejected leases, and shrank the circuit. Regal survived as an operating brand. Its owners did not survive as owners.
AMC. AMC had built its own debt-funded global empire through the Odeon and Carmike acquisitions and entered 2020 with a leverage profile that made bankruptcy the base case. It escaped through the strangest financing channel in modern capital markets history: a retail investor movement that drove its share price to levels utterly disconnected from its fundamentals, allowing AMC to issue equity relentlessly into that bid. The company avoided bankruptcy court. But it did so by transferring the loss from creditors to shareholders through dilution, and it is still doing so — diluted shares outstanding rose from 433.1 million in the second quarter of 2025 to 722.0 million a year later, a 67% increase in twelve months, alongside a $1.45 billion shareholders' deficit.3 AMC's operating recovery has been genuine: first-half 2026 adjusted EBITDA of $359.7 million was more than two and a half times the $131.8 million of the prior-year period.3 The business recovered. The per-share claim on it did not.
Cinemark. Cinemark entered 2020 with $488.3 million of cash and roughly $1.78 billion of long-term debt excluding leases against 2019 EBITDA of about $663 million — call it under two turns of net leverage, the strongest position among the majors.16 That gave it a genuinely different menu of options.
On April 13, 2020, with theatres shuttered, Cinemark priced $250 million of 8.750% senior secured notes.19 Read the coupon carefully: 8.75%, secured against leasehold interests, in a business with no revenue. That was not cheap money. It was available money, and the distinction is everything. A company with a clean balance sheet can borrow expensively in a crisis; a company already levered cannot borrow at all. In August 2020 Cinemark added $460 million of 4.50% convertible senior notes.7 Alongside the financings came the unglamorous work: capex cut to survival levels, lease negotiations, and cost containment.
The equity outcome tells the story. Cinemark's weighted-average share count was 116.3 million in 2019 and 116.7 million in 2020, and it stood at 118.2 million by 2022 — essentially flat across the worst three years in the industry's history.1617 Existing shareholders were not wiped out, and they were not diluted into irrelevance. They simply owned a company that had lost a great deal of money for three years and still owned the whole thing afterward.
The recovery phase then became an exercise in methodically unwinding the crisis capital structure. Over the three years through 2025, Cinemark extinguished more than $700 million of COVID-related debt while generating nearly $1.8 billion of cumulative adjusted EBITDA and over $1.3 billion of operating cash flow, reinvesting more than half a billion in capital expenditures and returning $315 million to shareholders through dividends and buybacks.5 The 8.75% secured notes were retired. A $500 million issue of 7.00% senior unsecured notes due 2032 was placed in July 2024 and used partly to repay the 5.875% notes.7
The most technically interesting repair was the convertible. The 4.50% notes matured on August 15, 2025 with Cinemark's stock well above the conversion price — the classic scenario in which a convertible becomes an expensive equity issuance in retrospect. Cinemark settled the $460 million principal in cash and issued approximately 16.2 million shares for the $472 million of value owed above par, then unwound the associated warrants with roughly $97.9 million of cash and 3.6 million shares, recognizing losses of $15.1 million and $24.2 million on the warrant adjustments.7 The blunt reading: the convertible hedge and warrant structure did not fully protect shareholders, and the settlement cost real cash and roughly 20 million shares. The blunter reading: that was the price of surviving 2020, and it was a fraction of what the alternatives cost at AMC and Cineworld.
By the end of 2025, the capital structure was ordinary again — a $632.3 million term loan due 2030 at roughly 5.6% after swaps, $765 million of 5.25% notes due 2028, the $500 million of 7.00% notes due 2032, an undrawn $225 million revolver, and a consolidated net total leverage ratio of 2.51 times.7 The dividend was reinstated during 2025 and now runs at $0.36 per share annually, and on October 30, 2025 the board authorized a $300 million share repurchase program, of which $25.3 million had been used through June 30, 2026.420
Balance sheet strength is not a moat in the Helmer sense — it confers no pricing power and no cost advantage in normal times. It is something arguably more valuable in a cyclical, fixed-cost industry with exogenous shock risk: it is option preservation. Cinemark's competitors spent 2020 through 2023 negotiating with creditors. Cinemark spent those years operating. The market share gap that emerged is largely the compounding of that difference.
VI. Core Economics & Segment Breakdown
Behind Cinemark's unified brand sit two distinct operating models that share a purchasing organization and film-licensing scale, but diverge on nearly every unit economic metric.
The domestic segment represents the core profit engine. Operating 303 theatres and 4,241 screens across 42 states at the end of 2025, the U.S. circuit generated $2,502.2 million of revenue — roughly 80% of the total — and produced $462.0 million of adjusted EBITDA at an 18.5% margin.7 Domestic operations drew 120.3 million patrons during the year, with average ticket prices reaching $10.52 and concession spend averaging $8.30 per person.7
The international segment presents a contrasting financial profile. Operating 193 theatres and 1,396 screens across 13 Latin American countries, the division generated $612.8 million of revenue and $115.9 million of adjusted EBITDA — an 18.9% margin, slightly outperforming domestic profitability.7 However, the underlying unit economics operate at a fraction of U.S. levels, with 72.7 million patrons paying an average ticket price of $3.83 and spending $3.15 on concessions.7
This comparison highlights a key structural efficiency in Cinemark's global footprint. Latin America delivers roughly 38% of Cinemark's total attendance on just 25% of its global screen count, generating comparable operating margins despite ticket prices that average one-third of domestic levels. Because local operating costs — including rent, wages, and utilities — scale down with lower price points, the region provides high attendance density and demographic youth, balanced against heightened macroeconomic volatility.
That volatility is particularly evident in foreign exchange translation. In 2025, the international segment's reported average ticket price rose only 3.5% and concession spend per patron grew 7.9% — yet on a constant-currency basis, those figures expanded 13.2% and 16.8%, respectively.7 Foreign currency translation absorbed most of those gains, converting double-digit local growth into low-to-mid single-digit gains in U.S. dollars. Chief Financial Officer Melissa Thomas highlighted additional operational friction in Latin America, noting that restrictive local labor laws limit staffing flexibility as box office volume ramps, government-mandated wage increases have outpaced inflation in key markets, and lease expenses carry greater variability than domestic agreements.2 Chief Executive Officer Sean Gamble offered a counterweight to macro concerns, noting that attendance in Argentina remained "neck and neck with pre-pandemic levels" despite severe inflation and political instability.5 Consequently, Latin America functions as a structurally profitable circuit whose underlying performance is periodically masked by currency fluctuations.
An examination of Cinemark's revenue streams clarifies the drivers behind its overall profitability.
Admissions reached $1,544.7 million in 2025, representing just under half of total revenue.7 Although ticket sales drive box office headlines, distributor terms limit their direct contribution to bottom-line profits. Cinemark incurred $877.0 million in global film rental and advertising expenses against those admissions — with the domestic segment spending $733.8 million against $1,266.0 million in ticket sales, establishing an effective film cost of roughly 58%.7 Because studio terms scale upward for major blockbusters, high-volume box office quarters do not automatically yield higher margin percentages. On the second-quarter 2026 earnings call, Gamble noted that the industry's theatrical exclusivity window remains "down approximately 40% from the pre-pandemic norm," adding that Cinemark does not expect a return to a full 45-day window to alter film rental rates because distributor scales were originally established independently of window length.21 Whether studios eventually seek to renegotiate terms as distribution windows evolve remains an ongoing industry risk.
Concessions generated $1,227.2 million in 2025.7 Supported by just $240.5 million in concession supplies expense, high-margin food and beverage sales fund the broader enterprise while expanding faster than underlying attendance. Thomas provided granularity on domestic per-patron concession growth in 2025: out of approximately five percentage points of overall growth, roughly three points derived from strategic pricing, one point from increased purchasing incidence, and one point from expanded product mix, including merchandise and high-tier food items.5 In the first quarter of 2026, pricing again accounted for the majority of the 7.5% increase in concession spend per patron.21
The composition of that growth provides key insight into earnings quality. While expansion driven by purchasing incidence and product mix reflects structural gains in consumer behavior, pricing-led expansion faces natural consumer resistance over time. Management has characterized food and beverage optimization as "a game of singles and doubles" focused on counter throughput, planogram refinement, menu innovation, and collectible merchandise.5 Movie-themed merchandise sales reached a record $25 million in the second quarter of 2026 as the company expanded retail offerings across its circuit.2 Nevertheless, the heavy reliance on price increases underscores the need to drive higher purchase frequency to sustain long-term concession growth.
Other revenue totaled $343.1 million in 2025, encompassing screen advertising, transaction fees, promotional partnerships, arcade gaming, and auditorium rentals.7 Although representing a smaller share of the top line, these high-margin revenue streams outpaced core theater growth, expanding 12.3% domestically and 29.6% on a constant-currency basis internationally during the second quarter of 2026.20
Cinemark's cost structure generates significant operating leverage. Thomas informed analysts that approximately 40% of the company's total cost base is fixed, allowing top-line gains to create operating leverage over facility lease expense, general and administrative costs, property insurance, and real estate taxes, while semi-variable items like labor rise more slowly than attendance.2 This fixed-cost structure explains how a strong film slate drove a 27.1% adjusted EBITDA margin in the second quarter of 2026, whereas a softer box office environment in 2025 resulted in an 18.6% full-year margin.5 Operating leverage magnifies profitability during box office peaks while compressing margins during volume contractions.
Two specific cost categories present ongoing operational headwinds. First, utility expenses have faced upward pressure from rising market electricity rates. Thomas repeatedly cited Cinemark's concentration in Texas, where expanding data center power demand has driven up regional energy prices.2 Second, facility maintenance costs remain elevated as the company executes a multi-year repair program initiated in 2025 that continues through 2026.2 This deferred maintenance spending reflects necessary reinvestment following reduced capital expenditure budgets during the industry shutdown.
Positioned against global peers, Cinemark operates roughly 5,637 screens compared to AMC's market-leading circuit of approximately 9,500 screens.73 Domestic competition centers primarily on Regal and AMC, while international markets feature regional operators including Cinépolis, Cine Colombia, CinePlanet, Kinoplex, UCI, Royal Films, and Araujo.7 Although smaller than AMC by total screen count, Cinemark generates higher EBITDA profitability per dollar of revenue — a margin advantage rooted in lower occupancy costs per screen and a capital structure that minimizes cash interest burdens.
That operational discipline places the focus squarely on the executive leadership tasked with sustaining Cinemark's competitive position.
VII. Modern Management & Capital Allocation under Sean Gamble
Cinemark's chief executive, Sean Gamble, evaluates studio release dynamics from a dual perspective, having previously operated on the distribution side of the industry. Gamble spent five years at NBCUniversal as executive vice president and chief financial officer overseeing global financial operations for Universal Pictures before joining Cinemark as CFO in 2014. He had previously held senior finance roles at General Electric, including managing finance for GE Oil & Gas Equipment in Italy.22 He subsequently served as chief operating officer starting in 2018 and president in 2021, before becoming chief executive on January 1, 2022, succeeding Mark Zoradi.23
That distribution background informs management's approach to industry coordination. Asked in July 2026 whether Cinemark could persuade studios to space theatrical releases more evenly across the calendar, Gamble detailed the structural mechanics governing studio release decisions. Noting that his perspective "dates back to my time at Universal," he explained how studios balance internal release slates, talent relationships, and competitive release dates — creating a calendar that can be individually rational for a distributor yet suboptimal for the overall exhibition market.2 The explanation highlights a strategic reality: the theatrical calendar reflects complex negotiations among independent distributors rather than a variable exhibitors can directly control.
Chief Financial Officer Melissa Thomas brings an external financial perspective to the executive team. Thomas joined Cinemark in November 2021 from Groupon, where she served as chief financial officer starting in August 2019 following roles as chief accounting officer and treasurer.24 She began her career at PricewaterhouseCoopers and holds an MBA from the University of Chicago Booth School of Business.24 On earnings calls, Thomas emphasizes detailed quantitative breakdown, decomposing per-patron revenue growth into discrete pricing, attendance incidence, and product-mix components. During the first-quarter 2026 call, she cautioned analysts regarding upcoming second-quarter labor cost comparisons, noting that A Minecraft Movie had generated such concentrated volume in the prior-year period that operating labor hours ran below standard staffing ratios.21
Management's capital allocation execution can be evaluated across key operational behaviors:
Narrative consistency. Management has maintained a consistent three-pillar capital allocation framework: prioritizing balance sheet strength, pursuing accretive investments including select acquisitions, and returning excess capital to shareholders. This sequence and its associated financial criteria — covering leverage targets, cash balances, and overall liquidity — have remained uniform across earnings calls from the fourth quarter of 2025 through the second quarter of 2026.5212
Performance attribution. When addressing softer box office results in 2025, Gamble noted that initial industry expectations "got a little bit overinflated coming in," pointing to the absence of a major summer animated feature or a release grossing over $500 million domestically. He observed that a single $300 million animated title would have significantly altered full-year results.5 While offering a concrete explanation, this attribution frames performance variance around studio content slates rather than internal execution.
Capital allocation discipline. Cinemark has avoided speculative diversification outside theatrical exhibition and large, highly leveraged acquisitions. Management's stated acquisition criteria focus on high-quality theatre assets with low deferred maintenance in existing markets to leverage established infrastructure.212 Capital expenditures are projected to step up to $250 million in 2026, up from 2025 levels, with $50 million to $60 million allocated to international operations. This spending supports a reactivated development pipeline, including a new site opened in El Paso in 2025, a location planned for Greenville, Texas in 2026, and a project in Omaha scheduled for 2027.5 Thomas emphasized that ongoing capital spending at this level will depend on available high-return investment opportunities rather than representing a fixed annual run rate.5
Compensation structure and alignment.
Cinemark's short-term incentive plan is structured around worldwide, domestic, and international adjusted EBITDA targets.23 A key feature of the design is the industry box office adjustment, which revises EBITDA targets up or down at year-end to neutralize variance between actual and budgeted industry box office. The plan adjusts targets by roughly $13 million for every 1% change in North American box office assumptions and roughly $3 million for every 1% change in Latin American attendance assumptions.23
This mechanism isolates management performance from macro box office fluctuations outside executive control. In 2025, North American box office finished approximately 9.6% below budget expectations, while Latin American attendance ran 13.9% below plan.23 Consequently, performance targets were adjusted downward. Against these lowered baselines, worldwide short-term incentive plan adjusted EBITDA of $564.0 million reached 123.3% of the target, international reached 149.8%, and domestic reached 117.8% — resulting in bonus payouts of 200% of target, the plan maximum, for Gamble, Thomas, and two other named executives.23 Gamble's total 2025 compensation reached $10.8 million ($10,815,407), compared to a median employee compensation of $11,718, representing a ratio of 923 to 1.23
This incentive structure creates an analytical tension when evaluated against reported financial performance. In 2025, Cinemark's revenue rose 2.1% to $3.12 billion ($3,115.0 million) while net income declined from $309.7 million to $138.2 million, and the share price traded well below where it trades in August 2026.7 Despite lower net earnings, executives earned maximum variable payouts.
Proponents argue that management successfully delivered on controllable factors — driving per-patron revenue, maintaining ticket pricing, defending market share, and controlling costs during a soft box office slate — fulfilling the explicit design of the incentive plan, and the proxy statement highlights these controllable factors.23 Critics contend that automatic downward target adjustments can generate asymmetric payouts over a full cycle, enabling maximum executive bonuses during years of declining net profit. Additionally, roughly 60% of named executive officer compensation is performance-based, with performance stock units — making up 60% of annual long-term equity grants — tied equally to three-year cumulative adjusted EBITDA and three-year cumulative cash flow.23 Because these metrics rely on internal accounting measures rather than relative total shareholder return or explicit return-on-invested-capital targets, governance analysts note that executive alignment remains focused primarily on absolute operational cash generation rather than capital efficiency metrics.
VIII. Playbook: Business & Strategic Lessons
Four transferable lessons emerge from Cinemark's history, clarifying how structural operational choices shape corporate performance during severe industry disruption.
Lesson 1: Own the layer where the premium accrues. Developing Cinemark XD was not a bet that the company could outperform third-party technology providers like IMAX. Rather, it reflected a recognition that in an industry already paying a major revenue share to film studios, adding a second licensing fee onto incremental ticket surcharges degrades unit margins. When a business already operates under high supplier power, introducing another toll-collector into the core offering compounds cost friction. Owning a proprietary format allows an operator to retain full premium ticket surcharges and preserve scheduling agility. The strategy holds as long as the proprietary product maintains quality parity with licensed alternatives, allowing selective third-party partnerships where brand equity justifies the fee.
Lesson 2: Subscription design is risk management, not marketing. The contrasting trajectories of Cinemark's Movie Club and early third-party subscription models like MoviePass highlight the importance of unit economics. While third-party models exposed themselves to unbounded marginal liabilities by offering unlimited attendance, Movie Club capped usage at one ticket per month and introduced a rollover feature that converted unused admissions into customer retention. A subscription program's financial terms define its underlying business model; offering unlimited access to a product with real marginal costs risks insolvency. Conversely, allowing unused benefits to roll over transforms a simple transaction into long-term subscriber engagement.
Lesson 3: In a fixed-cost cyclical business, pre-crisis leverage determines post-crisis market share. The divergence among theater chains following the 2020 industry shutdown illustrates how capital structure choices constrain strategic options. While Cinemark, AMC, and Cineworld faced identical revenue halts, their outcomes were largely dictated by balance sheet decisions made years earlier. Moderate pre-crisis leverage allowed Cinemark to access emergency capital markets and preserve its equity base without undergoing bankruptcy or catastrophic share dilution. In fixed-cost industries prone to external shocks, balance sheet conservatism acts as an option-preservation mechanism, enabling operational continuity when leveraged competitors are forced into defensive restructuring.
Lesson 4: Understand which line item actually drives profitability. While box office admissions generate the majority of total revenue, concessions deliver the bulk of operating profit. Film distributors capture roughly half of ticket sales, whereas concession supplies consume roughly a fifth of concession revenue.7 Functionally, an exhibitor operates as a high-margin food and beverage retailer that uses film distribution as its customer acquisition channel. Under this framework, capital investments — such as recliner conversions, premium format installations, and loyalty discounts — serve primarily to increase patron volume and expand counter spend. Evaluating management capital allocation requires identifying the true profit engine rather than focusing solely on top-line revenue figures.
A fifth, more critical observation accompanies these takeaways: each of these operational advantages is defensive. While Cinemark has successfully optimized its market position, these strategies protect market share rather than expand overall moviegoing demand. This structural limitation shifts the focus to the strategic threats and competitive pressures facing the circuit.
IX. Strategic Analysis: 7 Powers, 5 Forces, & Skeptical Stress Test
Hamilton Helmer's 7 Powers
Scale Economies — present but modest. With 5,637 screens, Cinemark possesses genuine purchasing leverage across concession supplies, beverage contracts, and projection hardware, while spreading corporate overhead over a broad operational base.7 Yet AMC operates nearly twice as many screens while earning lower operating margins, demonstrating that scale alone is not the primary source of Cinemark's advantage. Where scale genuinely provides strategic leverage is in film licensing, where a national footprint featuring strong West Coast positions grants the circuit bargaining standing it would lack as a regional operator.
Counter-Positioning — real, and the strongest of the four. Counter-positioning in Helmer's framework requires a business model an incumbent cannot copy without self-inflicted financial damage. Cinemark XD qualifies on a meaningful technicality: an exhibitor deeply committed to licensing IMAX screens cannot easily deploy a proprietary large format without cannibalizing its existing contractual commitments. Movie Club represents an even clearer counter-position: a competitor whose subscription program was built around multiple monthly visits cannot pivot to a single-ticket cap without imposing an obvious downgrade on its subscriber base. Although both advantages are narrow and impermanent, each provides real competitive insulation.
Switching Costs — modest and honestly assessed. Movie Club's accumulated rollover credits generate meaningful friction, as members with banked tickets face a tangible economic loss if they cancel. Yet moviegoing remains fundamentally local; if a competitor opens a superior theater five minutes closer, subscription credits rarely override geographic convenience. Consequently, switching costs are real for frequent moviegoers but negligible for casual patrons who visit twice a year — precisely the demographic the industry must recapture.
Process Power — the most likely true source of advantage, and the hardest to verify. Process power encompasses site selection, showtime scheduling, labor management, and concession throughput — decades of accumulated operational knowledge embedded in systems and personnel. Management frequently highlights these internal capabilities, citing sophisticated scheduling systems, data-driven decision tools, and artificial intelligence applied to pricing and showtime optimization.215 Cinemark's sustained margin premium over AMC offers the strongest external evidence of this operational edge. However, because process power cannot be independently verified from the outside, the margin advantage is equally consistent with a structurally lower-cost suburban real estate footprint. Both factors likely contribute, though lower real estate overhead is the only one that can be verifiably documented.
The remaining 7 Powers — branding, network economies, and cornered resources — are not meaningfully present. Cinemark's brand conveys operational competence rather than consumer magnetism, as moviegoers generally choose based on film selection and local convenience. The business generates no network effects and holds no exclusive film content.
Porter's Five Forces
Supplier power — very high, and this is the defining feature of the industry. Five major studios control film supply, capture the majority of ticket revenue, and unilaterally dictate release dates and theatrical exclusivity windows.7 No exhibitor has ever altered this structural asymmetry. The clearest evidence of supplier dominance is the evolution of the theatrical window itself: after years of exhibitor advocacy, the restored 45-day window remains roughly 40% shorter than pre-pandemic standards.21 Theater operators did not negotiate that term; they accepted it.
Threat of substitutes — high, but more nuanced than the consensus. Streaming, gaming, and short-form video compete directly for consumer leisure time. However, Chief Executive Officer Sean Gamble highlighted a counter-trend, noting that moviegoers under age 25 increased their attendance frequency by roughly 20% year over year, suggesting that younger audiences value the immersive, offline nature of the theater as a novel experience.2 Furthermore, low-budget, creator-led films — such as Iron Lung, Backrooms, and Obsession — outperformed expectations in 2026 by drawing established digital fanbases into auditoriums.2 While these developments do not eliminate the substitution threat, they demonstrate evolving demand patterns. Alternative content — including faith-based titles, anime, international films, live concerts, and creator projects — has represented over 10% of Cinemark's box office for several consecutive years, with 2025 alternative content revenue reaching more than double 2019 levels.5
Buyer power — low individually, moderate in aggregate. While individual moviegoers possess no bargaining power, aggregate consumer behavior exhibits sharp price sensitivity at the margin. When asked about a competitor pricing premium IMAX tickets at $55, Gamble indicated Cinemark would evaluate similar price points cautiously to avoid eroding patron value perception and attendance frequency.21 This disciplined approach reflects management's awareness that ticket pricing power is constrained by customer retention risks that are difficult to quantify.
Threat of new entrants — low. Developing new multiplexes requires substantial upfront capital, multi-year real estate site development, and established distributor relationships, yielding extended payback periods. Cinemark's development pipeline demonstrates these high entry barriers, as new theatre projects require two to three years from site identification to grand opening.5 Consequently, new entrant competition is effectively non-existent. The primary industry dynamic is screen rationalization and operator exit, which serves as a competitive tailwind for surviving circuits.
Rivalry — moderate. Gamble noted on earnings calls that industry competition remains strong while arguing that upgraded theatrical amenities across all circuits elevate overall consumer sentiment.21 In practice, price competition is muted because local markets typically operate as duopolies or localized monopolies, and film distributors allocate licensing rights independently across competing locations.7
The Skeptical Stress Test
The attendance question is unresolved, and it is the whole thesis. Although Cinemark reported that its domestic box office recovered to 95% of 2019 levels compared to 83% for the broader industry, total theatrical attendance remains structurally below pre-pandemic baselines.4 Furthermore, Cinemark's market share gains partly reflect patron displacement from financially distressed competitors — a one-time structural reallocation rather than an ongoing growth driver. With recent revenue growth relying heavily on higher ticket and concession pricing while volume remains depressed, the central question is how long exhibitors can raise prices before consumer value perception breaks down.
Window compression remains a live threat despite the recent improvement. While studios largely observed a 45-day exclusive window in the second quarter of 2026, Gamble acknowledged to analysts that the long-term financial impact remains uncertain, as distributors adhere to window lengths voluntarily rather than through binding contracts.2 Studios honored these commitments in the second quarter of 2026 without a binding industry mechanism enforcing them.2 Gamble highlighted the key underlying structural ambiguity: a 45-day window preceding a transactional video-on-demand release at a premium price point presents a very different economic dynamic than a window leading directly to a subscription streaming service that consumers view as free.5 Mid-budget films — priced between $30 million and $80 million — remain most vulnerable to early home viewing, and attendance for mid-tier releases has yet to recover to historical norms.
Studio consolidation is the acute regulatory overhang. The pending Warner Bros. transaction represents a direct threat to theatrical volume. Cinemark has joined industry trade groups in engaging with regulatory bodies and transaction parties to seek formal commitments regarding annual release volume, exclusive theatrical windows, and studio marketing budgets.5 Addressing public statements from Paramount, Gamble noted that while executives are "saying all the right things," theater owners "would like to see those statements backed by firm commitments."21 He expressed similar skepticism regarding Netflix's recent conciliatory comments, observing that exhibitors remain "apprehensive about placing too much stock into those comments" given past rhetoric, emphasizing that "there's going to need to be more action versus comments."5 Any permanent reduction in theatrical releases resulting from studio consolidation poses a direct threat to Cinemark's cash flow that executive management cannot independently mitigate.
Refinancing risk is presently modest, which is a genuine strength. Following the settlement of its 4.50% convertible notes and the reduction of net leverage to 2.0 times, Cinemark faces no major debt maturities until its 5.25% senior notes come due in July 2028.74 Although the 7.00% interest rate on its 2032 notes represents a higher long-term cost of capital than pre-2022 levels, the company maintained a robust interest coverage ratio of 6.6 to 1 at the end of 2025, comfortably exceeding its debt covenant threshold of 2.0 to 1.7 Consequently, near-term balance sheet distress and debt refinancing represent resolved operational risks rather than active threats.
X. Bear vs. Bull Case & Key Metrics
The Bull Case
The share gain looks partly structural, backed by operational evidence. Cinemark's trailing-twelve-month North American market share reached 15.2% compared to 13.3% in fiscal 2019, while its Latin American market share rose to 25.0% from 22.9%.4 Capturing nearly two percentage points of domestic market share in a mature industry represents a meaningful expansion. Management's guidance remains deliberately conservative, projecting at least 100 basis points of sustainable market share gains. The second quarter of 2026 served as a practical test: Chief Executive Officer Sean Gamble had cautioned that a congested summer release schedule might introduce capacity bottlenecks and normalize market share, yet Cinemark expanded its domestic footprint during the highest-grossing box office quarter since the pandemic.25 Although Gamble acknowledged that specific film spacing contributed to the result,2 expanding market share while operating near physical capacity demonstrates stronger execution than doing so with idle screen inventory.
Operating leverage functions predictably across box office cycles. The same cost structure that generated an 18.6% margin on a soft 2025 slate delivered a 27.1% margin during the robust second quarter of 2026.52 Because roughly 40% of the company's cost base is fixed, incremental patron volume flows directly to operating profit.2 For investors, this reframes the core variable: rather than asking whether Cinemark can outperform its operating model, the primary question becomes the overall trajectory of North American box office revenue.
Free cash flow generation provides substantial liquidity. Cinemark generated nearly $300 million in free cash flow during the second quarter of 2026 while limiting capital expenditures to approximately $60 million, exiting the period with $504.3 million in cash.24 Relative to a market capitalization of roughly $4.2 billion in late August 2026, cash flow generation during high-volume periods represents a material portion of the company's equity valuation.25
Audience demographic trends show unexpected resilience. Attendance frequency among moviegoers under age 25 expanded roughly 20% year over year, while creator-led releases drew digital fanbases into auditoriums and alternative programming sustained over 10% of total box office revenue.25 Although management's assertion that theatres benefit as rare non-digital venues remains speculative, recent attendance frequency patterns align with that positioning.
Capital return programs reflect restored balance sheet flexibility. An annual dividend of $0.36 per share, combined with $199.7 million remaining under the share repurchase authorization as of June 30, 2026, provides executive leadership with capital allocation choices that were unavailable during the post-pandemic recovery.420
The Bear Case
Content dependency remains an unhedgeable operational risk. Cinemark creates no original intellectual property; revenue remains tied entirely to the output, timing, and audience reception of major studio releases. Chief Financial Officer Melissa Thomas acknowledged this dynamic directly, noting that the business remains more dependent on film slate strength than macro economic cycles.2 While framed as evidence of consumer resilience, the statement also highlights structural vulnerability to distributor schedules. The 2025 fiscal year demonstrated this exposure: despite a 2.1% top-line revenue increase, net income declined to $138.2 million from $309.7 million due to a softer film slate.7
Per-patron revenue growth relies heavily on price increases. Strategic pricing generated approximately three percentage points of the five-point increase in domestic per-patron concession spend in 2025, and accounted for most of the growth in the first quarter of 2026.521 Sustaining revenue growth through higher prices faces natural consumer friction, requiring future gains to come from higher purchasing incidence and broader menu mix. Management's cautious approach toward aggressive ticket price surcharges reflects an awareness of these pricing constraints.
Foreign currency fluctuations dilute international operating gains. In 2025, double-digit pricing growth in local currencies converted into low-to-mid single-digit gains when reported in U.S. dollars.7 Strong operational performance across key markets like Argentina and Brazil can be largely obscured by currency headwinds, representing a permanent structural friction inherent in international geographic diversification.
Operating cost pressures present ongoing margin headwinds. Elevated expenses stem from several structural factors: government-mandated wage increases outpacing inflation in Latin America, rising electricity costs driven by data center power demand in Texas, multi-year deferred maintenance programs, and tariff pressures on concession inventory highlighted in regulatory filings.27 Offsetting these inflationary pressures requires sustained top-line growth to maintain operating margins.
Executive compensation structures present potential governance concerns. Senior executives received maximum short-term incentive payouts in 2025 despite lower annual net income, enabled by plan adjustments that reduced performance baselines during broader industry softness; long-term equity incentives rely on internal EBITDA and cash flow targets without incorporating relative total shareholder return or explicit return-on-invested-capital metrics; and the CEO-to-median-worker pay ratio reached 923 to 1.23 Coupled with historical related-party arrangements revealed during past antitrust reviews, these incentive structures remain a focal point for governance scrutiny as annual capital expenditures rise toward $250 million and management pursues targeted acquisitions.52
Long-term theatrical attendance stability remains unproven. While Cinemark has demonstrated market share expansion and margin resilience, operational efficiency cannot offset a potential long-term secular decline in overall theatre attendance. The bullish investment thesis requires baseline industry box office volume to stabilize, whereas the bearish thesis depends merely on a continuation of pre-pandemic attendance headwinds.
The Three KPIs That Matter
1. Domestic concession revenue per patron. Disclosed quarterly, this metric provides the clearest measure of Cinemark's monetization efficiency per moviegoer, reaching $8.70 in the second quarter of 2026.20 Beyond the headline figure, revenue composition serves as the critical analytical indicator: growth driven by purchasing incidence and product mix reflects higher underlying quality than gains generated solely through price increases.
2. Trailing-twelve-month North American market share. Market share isolates Cinemark's operational performance from broader box office fluctuations, showing whether investments in loyalty programs, proprietary premium formats, and showtime optimization translate into competitive gains. With management projecting sustainable structural expansion at 100 basis points or more,5 the key test remains whether market share holds during crowded release periods when auditorium capacity constraints peak.
3. Net leverage ratio. Operating at 2.0 times net debt to adjusted EBITDA within a target range of 2.0 to 3.0 times,4 balance sheet leverage determines capital return capacity, acquisition flexibility, and downside protection. Because Cinemark's post-pandemic competitive advantage stems directly from conservative pre-crisis leverage, any upward movement toward the higher end of the target band warrants careful evaluation.
XI. Epilogue & Future Outlook
With the full context assembled, the drivers of the record results reported in July 2026 become clear.
The billion-dollar quarter was real, and it was earned. But it was not an industry resurrection, and reading it as one obscures the underlying mechanism. Cinemark paired a lower fixed-cost footprint, an owned proprietary premium format, a margin-protective subscription program, and conservative balance sheet leverage with the first robust film slate since 2019 — allowing operating leverage to handle the rest. Those strategic choices were built over decades; the single quarter merely revealed their compounding effect.
An evaluation of Cinemark as of August 2026 highlights three core conclusions.
First, the company's operational advantage is real but narrower than popular narrative suggests. Its consistent margin premium over AMC stems largely from suburban real estate occupancy costs and the absence of a heavy interest burden — durable advantages, but not ones that expand indefinitely. Market share gains are well-documented, yet management's explicit refusal to claim all of those gains as permanent reflects necessary analytical caution. Internal process power appears genuine, though it remains inherently difficult to verify from outside disclosures.
Second, the balance sheet represents the company's most defensible asset, built on decisions that once appeared conservative. Cinemark stands out as one of the few exhibitors capable of simultaneously investing in its circuit, paying a dividend, repurchasing shares, and evaluating acquisitions. That strategic optionality reflects the long-term payoff of avoiding over-leverage. The primary risk now inverts: an intact balance sheet introduces the temptation of aggressive capital deployment. With capital expenditures rising, M&A language expanding in earnings discussions, and development pipelines reactivating, management's capital discipline faces its first major test since 2013.
Third, the long-term terminal value question remains unresolved by operational efficiency alone. Theatrical exhibition requires studios to maintain robust theatrical release slates, theatrical exclusivity windows to hold, and consumers to seek out-of-home entertainment. Recent positive indicators — restored windows, expanding youth demographic attendance, digital creator content crossing into auditoriums, and alternative programming exceeding 10% of box office — sit alongside ongoing friction: studio consolidation overhangs, shortened exclusivity windows relative to historical baselines, and overall industry attendance still below pre-pandemic levels.
Key variables will dictate performance from this baseline. Near-term visibility for the 2027 film slate appears positive, with announced release volume expanding above recent norms.2 How effectively studios distribute releases across the calendar will shape Cinemark's box office conversion, as release concentration during peak weeks creates physical screen capacity bottlenecks that constrain share expansion. The resolution of proposed studio consolidation, and whether exhibitors secure binding contractual commitments on output and release windows, represents the primary regulatory binary. Additionally, Latin American attendance recovery and foreign currency volatility will determine whether international operations enhance or compress consolidated earnings. Finally, the velocity of capital deployment — across new theatre developments, screen upgrades, and potential acquisitions — will demonstrate whether management's historical discipline persists as cash balances build.
Over four decades, Cinemark developed an operating model designed to survive severe industry contraction. The remaining strategic question for investors is whether maintaining position as the premier operator in a mature, fixed-cost industry represents a durable foundation for long-term capital compounding or a superior market share position in a contracting total addressable market. The circuit has established its operational edge; validating its long-term growth trajectory remains the work ahead.
References
-
Cinemark Celebrates Record-Breaking Q2 2026 Results, Including First-Ever Quarter to Surpass $1 Billion in Worldwide Revenue — Cinemark Holdings, Inc., 2026-07-30 ↩↩↩↩
-
Earnings call transcript: Cinemark posts record Q2 2026 revenue and margin — Investing.com, 2026-07-30 ↩↩↩↩↩↩↩↩↩↩↩↩↩↩↩↩↩↩↩↩↩↩↩↩↩↩↩↩
-
AMC Entertainment Holdings, Inc. Reports Second Quarter 2026 Results — AMC Entertainment Holdings, Inc. / US Securities and Exchange Commission, 2026-07-20 ↩↩↩↩↩
-
Cinemark Q2 2026 slides: record revenue, EBITDA top $1B milestone — Investing.com, 2026-07-30 ↩↩↩↩↩↩↩↩
-
Cinemark (CNK) Q4 2025 Earnings Call Transcript — The Motley Fool, 2026-02-18 ↩↩↩↩↩↩↩↩↩↩↩↩↩↩↩↩↩↩↩↩↩↩↩↩↩↩
-
Cinemark Founder, Lee Roy Mitchell, Retiring from the Company's Board of Directors — Cinemark Holdings, Inc., 2023-02-15 ↩↩↩
-
Form 10-K Annual Report for Fiscal Year Ended December 31, 2025 — Cinemark Holdings, Inc. / US Securities and Exchange Commission, 2026-02-18 ↩↩↩↩↩↩↩↩↩↩↩↩↩↩↩↩↩↩↩↩↩↩↩↩↩↩↩↩↩↩↩↩↩↩
-
Cinemark USA, Inc. Acquires Century Theatres, Inc. (Form 8-K, Exhibit 99.1) — Cinemark USA, Inc. / US Securities and Exchange Commission, 2006-08-08 ↩↩↩↩
-
Form 424B1 Initial Public Offering Prospectus — Cinemark Holdings, Inc. / US Securities and Exchange Commission, 2007-04-24 ↩↩↩
-
Cinemark Holdings, Inc. Announces Pricing of Initial Public Offering — Cinemark Holdings, Inc., 2007-04-23 ↩↩
-
Cinemark to Acquire 32 Theatres from Rave Cinemas (Form 8-K, Exhibit 99.1) — Cinemark Holdings, Inc. / US Securities and Exchange Commission, 2012-11-16 ↩↩↩
-
Cinemark Closes $240M Acquisition of Rave Theatres (Form 8-K, Exhibit 99.1) — Cinemark Holdings, Inc. / US Securities and Exchange Commission, 2013-05-29 ↩↩↩↩
-
United States, et al. v. Cinemark Holdings, Inc., et al.; Proposed Final Judgment and Competitive Impact Statement — Federal Register / US Department of Justice, 2013-05-30 ↩↩↩
-
National CineMedia Successfully Completes Financial Restructuring and Announces New Board of Directors (Form 8-K) — National CineMedia, Inc. / US Securities and Exchange Commission, 2023-08-07 ↩
-
Cinemark Announces Movie Club, an $8.99 Monthly Movie Membership Program — Cinemark Holdings, Inc., 2017-12-05 ↩
-
Form 10-K Annual Report for Fiscal Year Ended December 31, 2020 — Cinemark Holdings, Inc. / US Securities and Exchange Commission, 2021-02-26 ↩↩↩
-
Form 10-K Annual Report for Fiscal Year Ended December 31, 2022 — Cinemark Holdings, Inc. / US Securities and Exchange Commission, 2023-02-24 ↩↩
-
Regal Owner Cineworld Begins Chapter 11 Bankruptcy Proceedings in U.S. — The Hollywood Reporter, 2022-09-07 ↩↩
-
Cinemark USA, Inc. Announces Pricing of $250 Million Senior Secured Notes Offering — Cinemark Holdings, Inc., 2020-04-13 ↩
-
Form 10-Q Quarterly Report for the Quarter Ended June 30, 2026 — Cinemark Holdings, Inc. / US Securities and Exchange Commission, 2026-07-30 ↩↩↩↩
-
Earnings call transcript: Cinemark Q1 2026 beats expectations, stock rises — Investing.com, 2026-05-01 ↩↩↩↩↩↩↩↩↩↩↩
-
Cinemark Appoints Sean Gamble as Chief Financial Officer — Cinemark Holdings, Inc., 2014-06-25 ↩
-
Notice of 2026 Annual Meeting and Proxy Statement (Form DEF 14A) — Cinemark Holdings, Inc. / US Securities and Exchange Commission, 2026-04-01 ↩↩↩↩↩↩↩↩↩
-
Cinemark Names Melissa Thomas Executive Vice President and Chief Financial Officer (Form 8-K, Exhibit 99.1) — Cinemark Holdings, Inc. / US Securities and Exchange Commission, 2021-10-25 ↩↩
-
Cinemark Holdings Inc Market Data & Quotes — The Wall Street Journal ↩
 LinkedIn
 WhatsApp
 Reddit
 Hacker News
 Email
Email Kindle
 RSS Feed
 Spotify
 Apple Podcasts
 Amazon Music
 Audible
 YouTube