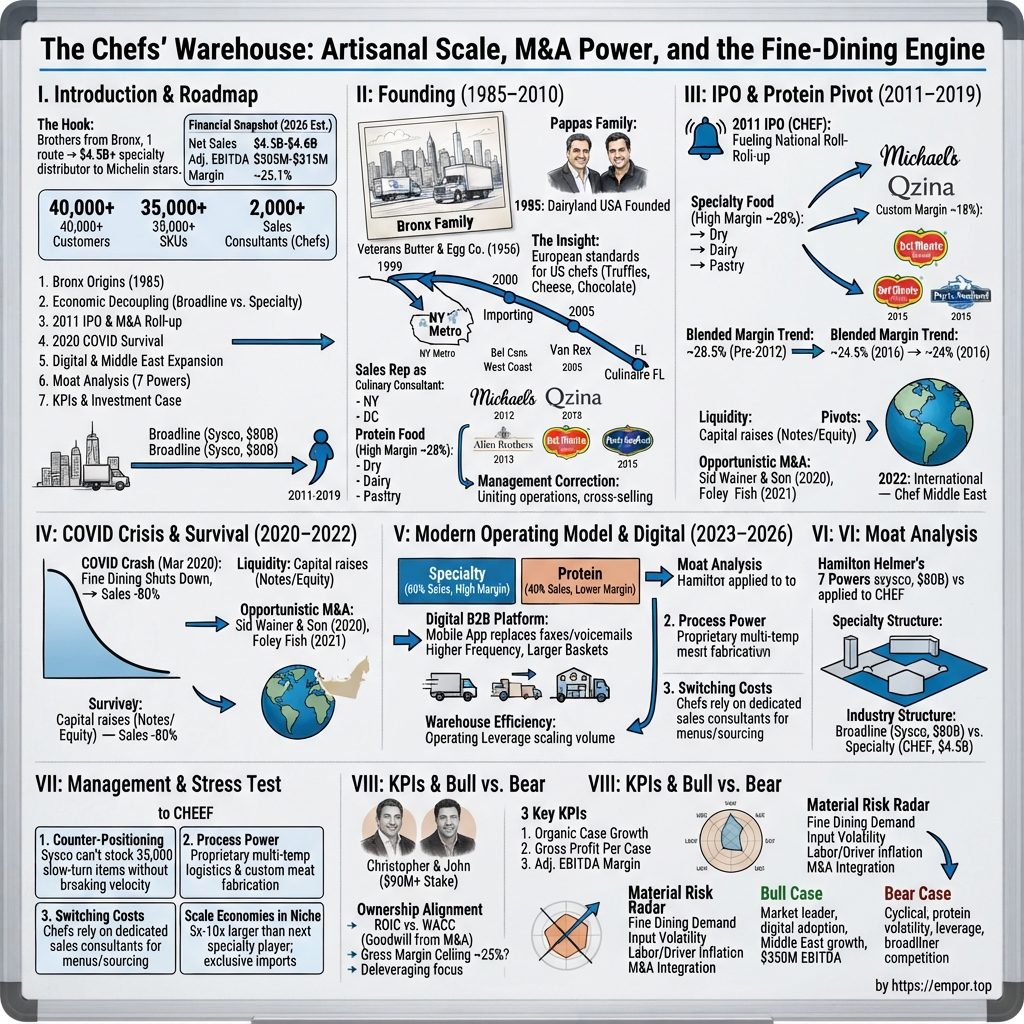
The Chefs' Warehouse: Artisanal Scale, M&A Power, and the Fine-Dining Engine
I. Introduction & Episode Roadmap
Four a.m. in Hunts Point.
At four in the morning in Hunts Point, in the South Bronx, the loading docks are the only part of New York that is fully awake. Refrigerated trucks idle in rows. Somewhere in the cold rooms behind them sit crates of Périgord truffles, wheels of raw-milk cheese, tins of Spanish anchovies, boxes of dry-aged short loin waiting to be broken down into portion cuts, and — improbably, alongside all of it — cases of ordinary butter and eggs, the core products the business was built on forty-one years ago.
By six a.m., those trucks are threaded into Manhattan traffic. By eight, they reach the back doors of restaurants whose chefs refuse substitutions. That scene captures the core operating thesis: a distributor deliberately tackling the most complex logistics in food delivery on the calculation that competitors will decline to match the operational burden.
The company, in numbers.
The company is The Chefs' Warehouse, Inc., trading on NASDAQ under the ticker CHEF. Founded in 1985 by brothers Christopher and John Pappas, Christopher Pappas has served as chief executive continuously since inception — a forty-one-year tenure rare in corporate leadership and nearly extinct in food distribution.1 For fiscal 2025, which ended December 26, 2025, the company reported net sales of $4.15 billion and gross profit of $1.00 billion, representing a gross margin of roughly 24.2%.2 Adjusted EBITDA reached approximately $258 million, or about 6.2% of sales, supported by organic revenue growth of 9.1% and a 29% year-over-year increase in adjusted earnings per share.34
That margin gap forms the central thesis of the business model. By comparison, Sysco, the largest broadline distributor in North America, reported net sales of $84.6 billion for its fiscal year ended June 27, 2026, with a gross margin near 18.5%.5 US Foods reported $39.4 billion for fiscal 2025 at roughly 17.4% gross margin.6 Performance Food Group reported $67.8 billion for fiscal 2026.7 While The Chefs' Warehouse remains small relative to broadline peers by total revenue, it retains roughly six to seven percentage points more gross profit per sales dollar.
That margin premium is neither a pricing gimmick nor a simple branding markup. Rather, it reflects compensation for managing higher operational complexity.
The underlying difference lies in business design. Broadline distribution relies on volume and inventory velocity: standardizing SKU catalogs, filling trucks, maximizing cases delivered per stop, and driving asset turnover. Specialty distribution prioritizes catalog depth: carrying low-velocity items that sell only a dozen times a year because stocking them secures the entire order from high-end chefs. As disclosed in its fiscal 2025 annual report, The Chefs' Warehouse operated 44 distribution centers, served over 55,000 core customer locations across 23 primary geographic markets in the United States, Canada, and the Middle East, and managed more than 90,000 SKUs sourced from over 4,000 suppliers, supported by approximately 1,100 sales and customer service professionals out of 5,156 full-time employees.28 Managing ninety thousand SKUs against approximately $4 billion in revenue results in an intentionally long, slow-turning inventory tail.
The question worth asking.
Whether this high-touch model constitutes a durable competitive moat or an expensive operational burden remains the central debate. For much of the company's public history, performance appeared mixed. From its 2011 initial public offering through 2019, revenue quadrupled while adjusted operating margins stagnated in the mid-single digits and gross margin contracted. Management repeatedly asserted that operating leverage would follow scale, though visible margin expansion remained elusive for a decade.
Recent financial results, however, demonstrate a notable shift in performance trajectory.
In the second quarter of fiscal 2026, ended July 29, 2026, net sales rose 12.9% year-over-year to $1.169 billion, driven by 12.2% organic growth. Gross margin expanded by 49 basis points to 25.1%, while adjusted EBITDA increased approximately 35% to $88.1 million.9 Following these results, management raised full-year 2026 guidance to $4.5–$4.6 billion in net sales and $305–$315 million in adjusted EBITDA. Concurrently, management retired its previous 2023 five-year targets ahead of schedule, introducing 2030 targets of $6.0–$6.5 billion in revenue and $450–$520 million in adjusted EBITDA, representing a target margin of 7.5%–8.0%.9 Equity markets responded: by late August 2026, shares traded near $110—within a 52-week range of roughly $53 to $117—yielding a market capitalization of approximately $4.5 billion.10
What this story is actually testing.
The key analytical question is identifying the primary driver of this recent inflection. Is the performance improvement the delayed realization of operating leverage after fifteen years of distribution infrastructure investment—as management contends—or does it reflect a cyclical peak in high-end restaurant spending vulnerable to economic mean-reversion? Both interpretations align with recent quarterly data, yet carry vastly different implications across economic cycles.
A third valuation dynamic also merits evaluation: whether durable operational improvements are already fully reflected in the equity price. With the stock up substantially from its 52-week lows, achieving management's medium-term targets requires expanding revenue by 50% and adjusted EBITDA by nearly 75% over four years. Consequently, the key investment risk centers on whether current operational targets represent a realistic baseline or an aggressive upside scenario.
The analysis unfolds across eight distinct areas: first, the company's Bronx origins and early strategy under founder Christopher Pappas; second, the structural factors enabling a specialty distributor to generate superior gross margins compared to broadline peers; third, the post-2011 public listing and protein acquisition campaign that expanded customer wallet share while altering margin profiles; fourth, the operational impact of early 2020 restaurant closures, when revenue declined sharply; fifth, the modern operational architecture, spanning facility consolidation, procurement technology, digital ordering platforms, and Middle Eastern expansion; sixth, a competitive evaluation using established strategic frameworks; seventh, an analysis of management's execution record relative to financial guidance; eighth, key operating metrics and valuation arguments; and finally, broader strategic takeaways for specialized distribution models.
 Subscribe on LinkedIn
II. Founding & Origin: The Bronx, Dairyland USA, and the Chef Mindset (1985–2010)
A basketball player's accidental market research.
Christopher Pappas graduated from Adelphi University in 1981 with a business administration degree and then did something seemingly unrelated to food distribution: he moved to Europe to play professional basketball for several years.1 While biographical profiles often mention that detail in passing, it formed the founding narrative for the company.
Living in European cities during the early 1980s, Pappas experienced a different food culture. Rather than dining exclusively at high-end restaurants, he ate on the weekday circuit of neighborhood markets and bistros where olive oil came from specific estates, cheeses had regional provenance, and merchants knew their sources intimately. In the United States at the time, restaurant supply was dominated by broadline distributor trucks delivering standardized inventory.
When Pappas returned to New York, the city was entering a fine-dining expansion. A generation of chefs, many trained in Europe, was opening independent restaurants in Manhattan and designing menus around specialty ingredients unavailable through domestic channels. While kitchens could source commodity items easily, securing specific artisanal products remained difficult.
That gap was driven by distribution economics rather than a lack of demand. A distributor's warehouse capacity is finite, and allocating slot space to estate olive oil that turns 40 times a year displaces fast-moving cooking oil that turns 4,000 times. Under operating models evaluated on inventory velocity and cases per labor hour, low-volume specialty items represent an operational inefficiency rather than a product opportunity. Distributors bypassed those products based on warehouse metrics.
That inefficiency created an opportunity for a distributor willing to operate under different metrics.
The Pappas family already maintained an initial foothold in logistics. Their father, Peter Pappas, operated a Manhattan butter-and-egg business supplying dairy products to local diners and coffee shops. That operation provided three critical assets: refrigerated delivery capabilities, established kitchen relationships, and a six-day morning delivery schedule. In 1985, Christopher and John Pappas restructured that dairy operation in Hunts Point as Dairyland USA, shifting its commercial focus to fine-dining establishments.1 That corporate structure endures today; Dairyland USA Corporation and its subsidiary Bel Canto Foods, LLC remain listed as key operating entities in SEC filings.11
The aggregation insight.
The strategic breakthrough was not merely importing premium food—a market already served by specialty importers. The key insight was solving the chef's operational challenge of aggregation. In 1990, a high-end kitchen might receive dairy from one vendor, dry goods from a second, imported cheese from a third, and specialty proteins from a fourth. Managing four separate deliveries, invoices, receiving interruptions, and vendor relationships imposed significant administrative friction. Consolidating those orders onto a single truck with a single invoice justified a price premium because a chef's binding operational constraints are kitchen labor, delivery consistency, and service execution.
Chefs selling to chefs.
That operational focus led to a distinct sales strategy. While broadline distributors deployed sales representatives primarily to record order volumes, Dairyland hired former line cooks and culinary school graduates. These specialists visited kitchens during afternoon prep hours with sample boxes, presenting product applications and producer backstories rather than simple price sheets. Chefs accepting those recommendations were not simply buying inventory; they were co-designing dishes around specialized supplier inputs.
This sales model established what management defines as unique item placements—the number of distinct SKUs sold to individual customer locations. Decades later, unique item placements remain a primary internal metric evaluating account depth and customer retention.
Understanding the business model requires recognizing why specialty distribution demands a higher gross margin structure. Delivering 400 distinct line items across 22 delivery stops costs substantially more per sales dollar than shipping 30 standardized SKUs across eight stops. The model incurs higher order-picking labor, multiple truck temperature zones, expanded invoice lines, elevated return rates, higher inventory carrying costs, and specialized sales personnel. Operating a specialty distributor at broadline gross margins would yield structural insolvency; the margin premium offsets higher operating complexity.
Scaling this model proved inherently slow. An expertise-driven sales organization cannot expand simply by adding fleet capacity; it requires developing specialized personnel over extended periods. CEO Christopher Pappas addressed this constraint during the second-quarter 2026 earnings call, noting that developing effective sales talent requires five to ten years.9 Reflecting on the company's 15-year public track record during the first-quarter 2026 call, Pappas acknowledged the timeline, stating he initially expected faster expansion before recognizing that building the platform "just doesn't get built overnight."12
The slow crawl, 1999–2010.
Between 1990 and 2010, expansion proceeded through targeted regional acquisitions rather than rapid national rollout. The company expanded from the New York metropolitan area into the Mid-Atlantic, the West Coast, and Florida by acquiring regional specialty distributors. The acquisition of Bel Canto Foods around 2000 added direct importing capabilities, enabling Dairyland to contract directly with European producers, capture importer margins, and secure exclusive distribution rights. Subsequent acquisitions, including Van Rex Foods on the West Coast, expanded geographic reach. By 2010, the company operated as a regional specialty distributor generating $330.1 million in net sales with gross margins near 26%, though it lacked the capital structure needed for rapid national expansion.13
That financial constraint defined its next strategic choice. Generating stable margins on $330 million in revenue allowed the founding brothers to maintain a profitable regional business. However, achieving national scale required acquiring dozens of independent regional distributors whose owners sought cash exits. Pursuing nationwide expansion demanded public equity currency and access to broader capital markets.
Choosing national scale over regional comfort led the Pappas brothers to pursue an initial public offering, accepting public market scrutiny and the ongoing task of articulating their high-margin, high-cost model to institutional investors.
III. The 2011 IPO & The Protein Pivot: M&A Acceleration & Margin Friction (2011–2019)
Sixty-three million dollars and a currency.
On July 28, 2011, The Chefs' Warehouse began trading on the NASDAQ Global Market. The offering priced at $15.00 per share and totaled 10.35 million shares — of which the company sold 4.67 million shares and existing shareholders sold the remainder — generating net proceeds to the company of approximately $63.1 million.1415 For a business generating roughly $400 million in annual revenue — fiscal 2011 net sales totaled $400.6 million — $63.1 million was not transformative growth capital on its own. Instead, it provided acquisition currency: a publicly traded stock that could be offered to family-owned distributors whose founders sought liquidity and succession planning.
Management deployed that currency quickly, targeting specialty protein.
The strategic logic addressed a fundamental kitchen vulnerability. Selling specialty dry goods, imported flour, chocolates, and olive oils captured only a fraction of a chef's purchasing budget. The single largest line item in most high-end food budgets is center-of-the-plate protein: prime beef, veal, lamb, specialty poultry, and seafood. If The Chefs' Warehouse did not supply protein, a competing distributor delivered to the kitchen daily, building relationships with the chef and threatening to displace specialty line items.
Securing protein distribution served a defensive purpose beyond market expansion. In high-end food distribution, competitive moats depend heavily on kitchen access and order frequency. Delivering daily center-of-the-plate proteins provides a reliable daily entry point into the kitchen. Ceding protein distribution to competitors risked allowing rivals to leverage daily delivery relationships to cross-sell specialty items, effectively turning the broadline strategy against specialty distributors.
To secure this market, the company executed a series of protein acquisitions. In August 2012, it acquired Michael's Finer Meats, a Columbus, Ohio-based distributor generating roughly $80 million in annual revenue, for approximately $54.3 million.16 In May 2013, it purchased Qzina Specialty Foods North America for approximately $32.7 million, expanding pastry product offerings and establishing a Canadian presence.17 In December 2013, the company acquired substantially all assets of Allen Brothers, a Chicago butcher supplying American steakhouses since 1893, for an expected purchase price near $33.4 million.1819 In April 2015, it completed its largest transaction, acquiring California-based Del Monte Capitol Meat Co. and its affiliates for an initial purchase price of $185.1 million, including working capital adjustments. Funding comprised $127.5 million in cash, 1.2 million shares valued at $22.00 per share, and $38.3 million in 2.5% convertible subordinated notes, with contingent earn-outs expected to add roughly $25.5 million.2021
Revenue expanded rapidly following the acquisitions. Net sales grew from $400.6 million in 2011 to $1.06 billion in 2015 and $1.19 billion in 2016, nearly tripling over five years.13 Wallet share per account increased as chefs added custom-cut protein orders to existing specialty purchases on the same delivery trucks.
However, expanding into protein altered the company's reported margin profile.
Myth versus reality: what the protein pivot actually did to margins.
A common market perception holds that protein acquisitions drove a steep, continuous drop in gross margin from 28% to 24% by 2016. SEC filings present a more nuanced picture. Gross margin stood at 26.4% in 2011 and 26.0% in 2012 before protein acquisitions scaled. It dipped to 24.6% in 2014 as Michael's, Qzina, and Allen Brothers were fully integrated, then recovered to 25.5% in 2015 and remained between 25.3% and 25.5% annually through 2019.13 The sharper gross margin compression occurred later, dropping to 23.7% in 2022 and 2023 as produce and lower-margin Texas operations entered the revenue mix.13
This distinction reframes the financial impact of the protein expansion. Rather than triggering a structural margin decline, the pivot produced a one-time margin reduction of roughly two percentage points in exchange for significantly higher revenue per customer. The strategic success of this trade depended on whether incremental revenue could cover the higher operational costs of distributing protein.
Why protein costs more to sell.
Protein distribution carries distinct operational complexities compared to shelf-stable specialty goods. Custom fabrication incurs yield loss, as trimmed primal cuts weigh less than raw inventory. The model requires skilled butcher labor, USDA-inspected processing facilities, strict cold-chain management, shorter shelf life, and exposure to wholesale commodity price volatility that cannot always be passed immediately to customers. These factors increased operating expenses, working capital requirements, and capital expenditures, requiring the company to achieve greater route density to preserve operating profitability.
The structure of the Del Monte acquisition illustrated management's approach to financing acquisitions while retaining key personnel. Roughly one-third of the consideration was funded through equity and seller notes, including 1.2 million shares and $38.3 million in convertible subordinated paper, alongside contingent earn-outs.20 Structuring consideration with equity and debt conserved cash while aligning former owners' financial interests with company share performance — a critical consideration in distributor acquisitions where customer relationships reside with legacy management. The company replicated this structure in subsequent acquisitions, issuing a $10 million unsecured note in the 2023 GreenLeaf transaction and an $11 million note in the 2025 Italco acquisition.
Integrating sales operations presented cultural and training hurdles. Realizing cross-selling synergies required specialty sales representatives to sell custom protein cuts without cannibalizing commission structures. Management implemented a team-selling model pairing category specialists with generalist account owners. Developing a cross-trained sales force proved to be a multi-year process, as CEO Christopher Pappas noted when describing sales force development as a long-term investment.129
Financial results through 2019 showed limited operating leverage. Net sales reached $1.59 billion in 2019, generating $406.4 million in gross profit and $24.2 million in net income — representing a net margin of 1.5%.13 Adjusted EBITDA margins remained in the mid-single digits, while return on invested capital was restrained by accumulated goodwill and intangible assets from serial acquisitions. By 2019, revenue had expanded substantially, but operating efficiency gains had not yet fully materialized.
Near the end of this period, management made a key financing decision. In November 2019, the company issued $130 million in 1.875% convertible senior notes due 2024, securing low-cost, long-term capital in favorable market conditions.22 That liquidity cushion would prove critical during the industry disruptions that followed months later.
IV. The COVID-19 Near-Death Crisis & Strategic Survival (2020–2022)
The switch.
The Chefs' Warehouse spent 35 years building an operational infrastructure designed exclusively to serve professional dining rooms. In March 2020, public health mandates halted indoor dining across virtually all its primary markets simultaneously.
The immediate financial impact was severe. On the first-quarter 2020 earnings call, held May 6, 2020, management disclosed that specialty case volume grew 10.8% organically across January and February before plunging 28.4% in March, while center-of-the-plate protein pounds fell 22.6% over the same month.23 Chief Financial Officer Jim Leddy detailed the rapid drop, noting that after March 16, volume declined between 60% and 70%.23 Chief Executive Officer Christopher Pappas summarized the shock to analysts: "It hit us like a nuclear bomb."23
The severe drop in demand forced immediate balance-sheet adjustments. In the first quarter alone, the company recognized a $15.8 million bad-debt reserve against receivables from struggling independent restaurants and a $3.3 million inventory obsolescence charge on perishable inventory.23 Quarterly adjusted EBITDA swung from a $13.2 million profit in the prior-year period to a $13.8 million loss.23 For full-year 2020, net sales fell from $1.59 billion to $1.11 billion, resulting in a net loss of $82.9 million.13
Management's operational response over the subsequent 90 days highlighted both the flexibility and fixed constraints of the specialty distribution model.
Four moves in ninety days.
Management prioritized immediate liquidity. On March 18, 2020—two days after volume plummeted—the company drew $100 million on its asset-based lending facility to secure cash reserves.23 By April 30, cash holdings reached approximately $200 million alongside $33 million in remaining borrowing capacity, providing liquidity equal to roughly 40% of 2019 annual revenue.23 To further fortify the balance sheet, the company completed equity offerings on May 14 and June 2, 2020, issuing 6,634,615 shares for net proceeds of approximately $85.9 million, and amended its credit agreement on June 8 to convert $207 million of term loans into a tranche maturing three years later.24 In March 2021, management expanded its capital reserves by issuing an additional $50 million of its 1.875% convertible senior notes due 2024.25
This capital raise diluted existing equity, increasing the weighted-average share count from roughly 29.5 million shares in 2019 to 36.7 million by 2021.13 However, issuing shares at depressed valuations preserved operating control and avoided distressed asset sales during an unprecedented credit contraction.
The capital strategy also underscored the benefit of pre-crisis balance sheet management. The original 2019 convertible note issuance provided low-cost liquidity before market stress emerged. Securing capital well ahead of operational need allowed the company to enter March 2020 with active credit facilities rather than immediate covenant default risks.
Concurrently, management restructured operating expenditures. Executive leadership accepted a temporary 50% salary reduction, furloughed employees while maintaining health coverage, and renegotiated or terminated warehouse leases.23 Leddy noted that the company's cost structure comprised roughly two-thirds variable costs and one-third fixed overhead; reducing variable expenses by 60% lowered total operating expenditures by approximately 40%.23 This cost flexibility enabled the business to survive a severe revenue contraction, though it demonstrated that fixed overhead represents a permanent baseline cost.
The improvisation, and its limits.
To protect inventory and maintain cash flow, the company adapted its operating model. Within a week of initial dining room shutdowns, it launched Shop Like a Chef, a direct-to-consumer e-commerce site selling restaurant-grade goods to households, committing a portion of proceeds to furloughed foodservice workers.26 The company also assisted restaurant clients in launching pop-up retail markets; Pappas noted one customer generated roughly $200,000 in retail revenue by selling 5,000 food boxes directly to local residents.23 By early May, daily order volume stabilized at approximately 50% of prior-year levels despite widespread dining room closures.23
While direct-to-consumer sales provided temporary inventory relief, management emphasized their limited long-term contribution. Leddy informed analysts that weekly volume stabilization was "materially driven by" restaurants pivoting to takeout and delivery services, clarifying that consumer retail sales were "not the preponderance of that growth."23 Direct consumer sales helped mitigate perishable inventory write-offs, but did not alter the fundamental economics of wholesale food distribution.
Buying while others could not.
While managing operational disruptions, the company maintained an aggressive acquisition strategy. Immediately prior to the shutdowns in January 2020, it had completed the purchases of New England specialty produce distributor Sid Wainer & Son and regional meat processor Cambridge Packing.27 As smaller regional competitors struggled during the pandemic, The Chefs' Warehouse continued expanding its distribution footprint through targeted M&A.
Its largest acquisition expanded operations beyond North America. On November 1, 2022, The Chefs' Warehouse acquired specialty distributor Chef Middle East LLC—operating in the United Arab Emirates, Qatar, and Oman—from Gulf Capital for $108.7 million in cash at closing, plus a potential $10 million two-year earn-out; the business was projected to add $160–$180 million in annual net sales and $11–$14 million in adjusted EBITDA.2829 The acquisition targeted rapid growth in luxury hospitality and dining across the Gulf region, where fine-dining venues faced supply chain fragmentation similar to North American markets in earlier decades.
The post-pandemic recovery unfolded gradually over multiple fiscal years. In 2021, net sales recovered to $1.75 billion—reflecting partial market recovery and initial acquisition contributions—yet the company posted a net loss of $4.9 million.13 Operating profitability fully normalized in 2022 as annual revenue reached $2.61 billion, surpassing pre-pandemic levels. The multi-year recovery reinforced management's operational framework: maintaining higher liquidity reserves and utilizing balance-sheet capacity to execute acquisitions during periods of industry disruption.
V. Modern Operating Model & Digital Transformation (2023–2026)
The building is the strategy.
Understanding the recent transformation at The Chefs' Warehouse begins not with software, but on a distribution loading dock in Dallas.
For much of the past decade, the company's expansion math created a persistent operational friction: entering a new market meant inheriting or opening a facility that was either too small to operate efficiently or too large to fill immediately. Chief Executive Officer Christopher Pappas explained the underlying mechanics to analysts in July 2026: "We're building new facilities every year, and when you add space, usually you're adding more space than you need, so you're carrying more overhead. As we fill them up, as we're starting to do right now, you start to see the real EBITDA of the company starting to show itself."9
That dynamic forms the central operating thesis of the current expansion phase. A specialty distributor's fixed overhead centers on warehouse facilities, cold-storage units, racking systems, and primary delivery routes. Its variable costs consist of warehouse labor, vehicle fuel, and driver miles. When case volume increases across existing facilities and established routes, incremental gross profit flows directly to the bottom line. Conversely, constructing capacity ahead of demand suppresses operating margins—the structural headwind that restrained profitability throughout most of the 2010s.
Produce, Texas, and the discipline of subtraction.
The company's 2023 expansion initially amplified this operational drag before delivering margin benefits. In March 2023, the business acquired substantially all assets of Hardie's Fresh Foods, a Texas specialty produce distributor, for approximately $48 million.30 In May 2023, it acquired Northern California produce and specialty distributor GreenLeaf for a final purchase price of $88.2 million, comprising $72.2 million in cash at closing, a $3.5 million working capital adjustment, a $10 million unsecured note, and 75,008 common shares.31 Produce offers high order frequency—chefs purchase fresh greens daily—yet carries lower gross margins. The Texas acquisitions also brought two unwanted business lines: a high-volume, low-margin commodity poultry program and a commercial produce processing operation.
Management chose to exit both legacy Texas programs in 2025—which together represented roughly 1% of full-year net sales—and published volume and inflation metrics both on a reported basis and excluding the exited operations, allowing investors to evaluate core business performance.4 Concurrently, the company recorded an $8.0 million non-cash impairment charge in the fourth quarter of 2025 to write down a non-core customer relationship intangible asset from a prior transaction.4 Voluntarily curtailing low-margin revenue to improve product mix and marking down underperforming acquired intangibles reflected a shift toward capital discipline over top-line growth.
External analysis often oversimplifies the business into two rigid segments: specialty products at roughly 60% of revenue and center-of-the-plate protein at 40%, each assigned fixed margin assumptions. While the company reports volume and inflation separately for both categories and details category sales in annual filings, management does not guide to a fixed segment split, as mix fluctuates with M&A and commodity price swings. Management disclosed that fresh produce accounts for approximately 14% of total net sales.9 Modeling the business around a fixed 60/40 revenue split assumes more segment rigidity than financial disclosures support.
What the last three quarters actually showed.
Financial performance across recent quarters reflected this operating shift. In the fourth quarter of fiscal 2025, net sales rose 10.5% year-over-year to $1.143 billion, supported by 9.7% organic growth.4 In the first quarter of fiscal 2026, net sales increased 11.4% to $1.059 billion on 10.4% organic growth, while gross margin expanded 53 basis points to 24.3% and adjusted EBITDA rose to $60.1 million from $47.5 million in the prior-year period.12
The second quarter of 2026 reinforced this trajectory, with growth driven primarily by physical volume rather than price realization. Of the 12.2% organic growth recorded in the quarter, unique item placements expanded 7.2%, specialty case volume grew 6.0%, protein volume rose 8.8% in pounds, and unique customer counts grew 3.6%—or 4.9% when excluding Middle Eastern supply disruptions—against net product inflation of 4.9%.9 With roughly half of organic growth generated by unit volume, recent gains reflect market share expansion rather than inflationary pricing.
The technology, described accurately.
The company's digital capabilities are best understood as operational enhancements rather than speculative technology bets. Rather than replacing core distribution logistics, the company deployed a centralized data and analytics layer across operating units to support four primary functions: dynamic pricing, procurement optimization, inventory management, and sales representative productivity.9 In practice, the platform provides buyers real-time visibility into landed container costs and competitor pricing, alerts warehouse managers to slow-moving inventory before spoilage occurs, and highlights uncaptured product categories for sales representatives. Chief Financial Officer Jim Leddy attributed recent gross margin expansion largely to this integration, noting enhanced coordination between pricing, procurement, and sales teams in "leveraging our scale."9
When asked to quantify the financial impact of technological investments, Pappas rejected dramatic profit projections, offering a practical analogy of a strong student receiving corrective eyewear: "They can digest the information quicker, make better decisions, and go faster."9 Addressing whether artificial intelligence would yield a structural margin breakthrough, Pappas stated: "I don't think we're moon shooting, expecting to get five, six points to the bottom line somehow, miraculously. I don't think that's the way our industry works."9 Management's conservative framing underscores a focus on incremental process efficiency over structural re-rating.
The digital ordering platform operates alongside these analytical tools. Transitioning manual kitchen orders—historically submitted via midnight voicemails, text messages, and faxes—to a digital interface reduces order-picking errors, increases basket size through catalog browsing, and redirects sales consultants from order entry to account management. However, management emphasized that digital tools enhance rather than replace direct sales relationships. On the second-quarter earnings call, Pappas noted that digital ordering makes it "easier for customers to do business with us and order more items," while maintaining that "we are in a relationship business."9 For a specialty distributor whose gross margin premium relies on culinary advice and specialized service, digital ordering serves as an operational complement rather than a standalone distribution channel.
Capacity, and what it costs.
Physical capacity expansion remains focused on high-growth regional markets, with New England, Texas, Las Vegas, the Midwest, and Colorado identified as primary investment targets. On October 1, 2025, the company acquired Denver-based Italco Food Products for $16.5 million in cash plus an $11.0 million unsecured note, providing an operational hub for an expanded Rocky Mountain distribution facility.32 Management projects ongoing capital expenditures at approximately 1% of annual net sales, targeting free cash flow conversion between 40% and 60% of adjusted EBITDA.9 This modest capital intensity reflects the underlying economics of specialty food distribution, where scale is built primarily through working capital investment and specialized sales personnel rather than heavy physical infrastructure.
These operational refinements raise the essential strategic question: whether recent performance demonstrates a durable structural moat, or a temporary operational crest during a favorable restaurant demand cycle.
VI. Industry Structure, Competitive Landscape & 7 Powers Analysis
Consider two trucks departing distribution centers in the same city on the same morning.
The first is a 53-foot trailer leaving a broadline warehouse carrying 1,200 cases across eight stops—a hotel banquet hall, three chain restaurant locations, a hospital, and a school commissary. Most items are governed by corporate national contracts, picked in automated facilities from catalog lists in the low tens of thousands, with the top thousand items driving the vast majority of volume.
The second is a straight truck leaving a specialty warehouse carrying 300 cases containing 400 distinct line items, some as small as a single tin of caviar. It completes 22 stops in five hours, primarily at independent restaurants requiring manual delivery down basement stairs. Half the products on board turn fewer than 15 times per year, including specialty imports flown in specifically for a chef's weekly menu.
While both operations represent food distribution, they function as distinct industries. The margin gap between a broadliner's 18.5% gross margin and a specialty distributor's 25.1% margin reflects this underlying difference in operational complexity.
Porter's five forces analysis.
Rivalry within the market is bifurcated. Direct competition from broadliners remains structurally constrained; while Sysco and US Foods operate specialty units, their primary operating models remain optimized for high-volume, standardized fulfillment. Conversely, competition among specialty distributors is intense but fragmented, featuring regional operators such as Baldor Specialty Foods in the Northeast, Gourmet Foods International in the Southeast, and hundreds of independent purveyors, cheese importers, and local butchers facing succession pressures. During the July 2026 earnings call, Chief Executive Officer Christopher Pappas offered a pragmatic view of market competition, noting, "There's plenty of competition. We fight every day."9
Buyer power remains structurally low among core customers. Unlike chain restaurant operators negotiating across hundreds of locations, independent kitchens with single units possess limited purchasing leverage. Furthermore, fine-dining chefs prioritize product consistency over minor price variances, as an unwanted ingredient substitution risks compromising menu quality. Pappas emphasized this dynamic on the July 2026 call, observing, "It's not like you're at a $20 average check average, and you could substitute, and no one's really going to complain."9 However, this pricing flexibility is balanced by customer fragility: independent restaurants experience ongoing business turnover, with management reporting annual customer attrition running in the high single digits that must be offset through new account acquisition.9
Supplier power presents a balanced dynamic. Sourcing across more than 4,000 suppliers prevents over-reliance on any individual vendor, while direct importing captures distributor margins. However, key specialty offerings depend on small European artisanal producers with finite production capacities. The scarcity of these high-end ingredients grants specialized producers relative pricing power, creating a balanced relationship despite the broad supplier base.
Threat of substitutes represents a subtle structural risk. The primary substitute is not an alternative distributor, but a shift in end-consumer dining habits. Any reallocation of consumer food expenditure away from fine dining toward fast-casual concepts, virtual kitchens, or home cooking reduces total addressable demand across the specialty distribution network.
Threat of new entry varies by scale. While local entry barriers are low—enabling small purveyors to launch operations with minimal delivery fleets—replicating a nationwide network of 44 distribution centers, 90,000 SKUs, and established international supplier relationships requires substantial capital and decades of operational development.
Strategic analysis using Helmer's 7 Powers.
Counter-positioning represents the primary structural defense, though it warrants critical evaluation. The central premise holds that broadline distributors cannot replicate a specialty model without undermining their core operations. Absorbing tens of thousands of slow-turning artisanal SKUs degrades broadline metrics such as warehouse automation, inventory turnover, spoilage rates, and cases delivered per stop. Similarly, servicing small multi-item orders across dense urban routes reduces overall fleet productivity. Consequently, broadline operators face disincentives to integrate specialty distribution directly into their primary networks.
However, counter-positioning provides only partial protection. Broadline distributors can establish standalone specialty divisions and acquisition-led subsidiaries operating under independent infrastructure and cost structures. While counter-positioning shields against direct entry from broadliners' primary distribution networks, it does not prevent competitors from constructing parallel specialty operations—a process that nevertheless requires significant capital and multi-year execution timelines.
Process power derives from complex operational routines developed over decades. Managing multi-temperature fulfillment—consolidating frozen proteins, refrigerated items, ambient dry goods, and fresh produce alongside USDA-inspected meat fabrication—requires specialized facility workflows and employee training. Reframing these operational requirements during the July 2026 call, Pappas emphasized that the distribution platform features "such a long tail" and remains "very hard to copy."9 These localized operational complexities also explain why expanding into new geographic markets requires multi-year gestation periods.
Switching costs operate primarily through cognitive and operational habits rather than long-term contracts. High-end menus are designed around consistent supplier specifications, while sales consultants develop deep familiarity with kitchen prep routines. Because delivery disruptions risk immediate menu issues, chefs exhibit vendor stickiness. Nevertheless, annual customer attrition in the high single digits indicates that switching costs create operational friction rather than permanent customer lock-in.
Scale economies in a niche provide a measurable competitive advantage. Generating over $4 billion in annual revenue—a scale unmatched by smaller regional specialty purveyors—enables the company to secure favorable freight rates, negotiate exclusive import arrangements, and amortize analytical technology and category-management overhead across a larger operating footprint. Chief Financial Officer Jim Leddy highlighted this advantage during the July 2026 earnings call, attributing recent gross margin expansion specifically to pricing and procurement teams "leveraging our scale."9
Two of Helmer's framework powers remain absent. The model generates negligible network effects, as acquiring a customer in one market does not directly enhance service quality for customers in another, apart from localized route density gains. Additionally, the business possesses no consumer brand power, as restaurant patrons rarely know or evaluate the underlying food distributor. Gross margin premiums stem entirely from kitchen convenience and service reliability rather than consumer brand pull.
Competitive position and long-term outlook.
The company's competitive advantage relies less on direct execution against broadline leaders than on its established position within a specialized market segment that broadline operators find structurally challenging to serve. Recent operational metrics suggest this market position has strengthened, evidenced by expanding gross margins, double-digit unit volume growth, expanding customer counts, and item placements outpacing case growth—indicating that existing accounts are purchasing broader product lines.9
However, a key analytical risk remains: the current operating model has not been tested against a sustained cyclical downturn in fine-dining expenditure since reaching national scale. While the 2020 pandemic forced emergency operational adjustments, it represented an artificial policy shutdown rather than a traditional demand recession, which carries distinct consumer spending dynamics.
VII. Management Assessment & Skeptical Investor Stress Test
A forty-one-year leadership tenure offers a rare opportunity to evaluate management across multiple market cycles rather than over a few quarters.
The record on promises.
At its 2023 investor day, management established five-year financial targets for fiscal 2028, projecting 4% to 7% annual organic growth, $300 million to $350 million in adjusted EBITDA, and an adjusted EBITDA margin of 6.5% to 7.0%.33 By July 2026—halfway through that timeframe—the company was guiding to $305 million to $315 million in adjusted EBITDA for fiscal 2026 alone. Reaching its earnings target two years early, management reset its 2030 targets to $6.0 billion to $6.5 billion in net sales on 7% to 10% annual growth, $450 million to $520 million in adjusted EBITDA, and an expanded target margin of 7.5% to 8.0%.9
Chief Financial Officer Jim Leddy explained the upward revision, noting: "We've been outperforming that by 200 or 300 basis points since then. We just think it made sense to kind of raise that algo to 7%–10%. It is risk-adjusted to what we're doing the last couple of quarters."9 Leddy also emphasized management's conservative approach to forecasting: "if you know us, we tend to be a little conservative in our forward guidance."9 Disclosed guidance updates support that assertion: the company left its full-year 2026 guidance unchanged in April despite a strong first quarter, citing regional uncertainty in the Middle East, before raising projections substantially in July after conditions stabilized.129 Deferring a guidance raise during periods of macro uncertainty demonstrates disciplined forecasting rather than promotional management.
Management's core narrative has remained consistent over time. Chief Executive Officer Christopher Pappas's July 2026 assertion—that operational scale would eventually transform the specialty model's cost structure into operating leverage—mirrors his pre-pandemic messaging: "You've heard me say for years, 'Listen, this is a big drag.' Once we get scale, the EBITDA margins will go up."9 Wall Street analysts have noted this long-term messaging; during the second-quarter 2026 call, Benchmark analyst Todd Brooks observed that management had "educated us over the years" that margin expansion in specialty distribution is "a yearly grind" of 20 to 30 basis points, questioning why the recent margin step-up should be viewed as sustainable.9
Where the record is less flattering.
However, the company's financial performance from 2011 through 2019 reflected persistent margin friction relative to acquisition spending. The business deployed approximately $300 million in purchase capital between 2012 and 2015 alone, yet generated net income of just $24.2 million on $1.59 billion in net sales by fiscal 2019.13 Despite the strategic logic of expanding wallet share, interim returns on invested capital remained modest for nearly a decade before distribution scale produced visible operating leverage.
Insider alignment, however, remains substantial. Chief Executive Officer Christopher Pappas is the largest individual shareholder, holding approximately 2.76 million shares—representing roughly 6.78% of total outstanding stock—according to the proxy statement filed March 25, 2026, while executive insiders collectively hold a mid-teens percentage.34 At late-August 2026 market prices near $110 per share, that founder equity stake is valued at approximately $300 million, aligning executive wealth directly with long-term equity performance. Co-founder John Pappas serves as vice chairman, having previously served as chief operating officer from founding through 2011.1
The activist case, made properly.
A critical investment evaluation highlights four potential vulnerabilities in the financial structure.
First, the capital structure's hidden dilution. Management's fiscal 2026 guidance assumes the 2.375% convertible notes due 2028 are fully dilutive, generating a projected diluted share count of 46.0 million to 46.7 million shares, compared to 38.7 million weighted-average basic shares in fiscal 2025.913 This nearly 20% expansion in share count stems from pandemic-era convertible financing. The impact is evident in fiscal 2025 results, where reported basic earnings per share reached $1.87 while diluted earnings per share stood at $1.68.13 Evaluating per-share earnings growth requires focusing on diluted figures rather than headline basic counts.
Second, the leverage definition. Management reported net debt of $529.5 million, representing leverage of approximately 2.1 times adjusted EBITDA at fiscal year-end 2025, which improved to $478.5 million and 1.6 times by the end of the second quarter of 2026.49 While this deleveraging trajectory fits within management's target range of 1.5 to 2.5 times EBITDA, the company also carried approximately $226 million in finance lease obligations alongside stockholders' equity of $604.3 million at year-end 2025.2 A comprehensive leverage assessment must account for these fixed lease obligations, particularly given the capital required to lease distribution infrastructure across 44 operating facilities.
Third, goodwill and the ROIC question. At the end of fiscal 2025, the balance sheet carried $362.7 million in goodwill and $137.3 million in identifiable intangibles. Combined, these intangible assets totaled $500.0 million—representing nearly a quarter of total assets of $2.03 billion and over 80% of book equity.2 This accumulated balance reflects purchase prices paid above the fair value of net acquired assets across fifteen years of acquisitions. These intangible assets explain why GAAP returns on invested capital appeared constrained even as operating cash flow expanded, and why the fourth-quarter 2025 impairment of an acquired customer relationship asset represents an important accounting write-down on legacy acquisition underwriting.
Fourth, the capital allocation pivot. Management has stated an intention to "increase share repurchases" while maintaining "dry powder to facilitate tuck-in M&A."9 However, historical buybacks have been modest, totaling $15.0 million in fiscal 2025 and $24.8 million in fiscal 2024, compared to capital expenditures of $41.4 million and $49.5 million over the same periods.35 Furthermore, Pappas characterized the M&A environment in July 2026 as "getting frothier and frothier,"9 emphasizing organic reinvestment over aggressive dealmaking: "Our organic growth is so strong. I would still rather keep investing in people and just keep adding talent and can grow at a much better ROI than a lot of the acquisitions that we're looking at, that we're passing on."9 The durability of this disciplined approach will be tested if organic growth slows.
How management handles bad news.
Management's operational transparency provides relevant evidence regarding execution discipline. When evaluating two unprofitable inherited programs in Texas, the company exited the operations and disclosed their impact on volume metrics for a full year to clarify core organic growth.4 When geopolitical conflict disrupted Middle Eastern operations mid-quarter, management detailed the regional revenue impact—disclosing run-rates at 75% of prior-year levels in April before recovering to roughly 94% in May and June—rather than consolidating the figures.129 Similarly, when an acquired customer relationship intangible underperformed, the company recorded an $8.0 million impairment charge and detailed the write-down on its earnings call.4 Finally, when reporting strong first-quarter 2026 results amid regional uncertainty, management held full-year guidance steady until operational visibility improved.12
While transparent disclosure does not guarantee future execution, it demonstrates a commitment to operational accountability across economic cycles.
VIII. Key Investment KPIs, Risk Radar & Bull vs. Bear Case
The three metrics that matter.
Commodity price fluctuations frequently obscure a food distributor's underlying operational reality: 12% revenue growth during 5% inflation represents a fundamentally different operational environment than 12% growth during 1% inflation. Consequently, evaluating core business performance requires tracking metrics that isolate physical volume from price inflation or measure how effectively operating activity converts into profit.
One: organic volume and placement growth, not revenue growth. The primary operational indicators to track are specialty case growth, center-of-the-plate protein pounds, unique item placements, and unique customer counts—all disclosed quarterly independent of pricing inflation.9 Among these, unique item placements serve as the most diagnostic metric because they measure whether existing accounts are purchasing across a broader portion of the catalog, which drives the business model's gross margin premium. Expanding placements faster than case volume signals growing share of wallet, whereas case volume outstripping placements indicates volume gains on existing items, representing a more commoditized and competitively vulnerable position.
Two: gross profit dollars per route. This key operating-leverage metric—published directly by the company—evaluates whether incremental case volume is being delivered on existing truck routes. At the end of fiscal 2025, management reported trailing-twelve-month gross profit per route up 6.2% compared to full-year 2024 and 7.4% relative to 2023, while adjusted EBITDA per employee grew 13% and 27% across the same comparisons.4 Continued compounding in this series would validate the facility consolidation and route density thesis, whereas a deceleration alongside revenue growth would indicate that revenue expansion is incurring elevated operating costs, putting 2030 margin targets at risk.
Three: adjusted EBITDA margin against net debt / adjusted EBITDA. These metrics must be evaluated together because the core investment thesis relies on achieving operating leverage without expanding debt leverage. Full-year 2026 guidance implies an adjusted EBITDA margin of approximately 6.8%—roughly 70 basis points above fiscal 2025—against a 2030 target of 7.5% to 8.0%.9 Meeting that long-term target requires an average annual margin expansion of roughly 20 basis points. Expanding margins alongside stable leverage within the target 1.5 to 2.5 times range confirms operational thesis execution, whereas expanding margins accompanied by rising leverage would indicate that growth was acquired through capital deployment rather than organic efficiency.
Risk radar: what could actually break this.
Fine-dining demand. The central un-diversifiable vulnerability stems from concentration in independent restaurants, luxury hotels, resorts, and country clubs serving affluent consumers. In April 2026, CEO Christopher Pappas argued that high-end diners remain resilient, observing that "the higher-end consumers are not going to not order a great steak because it's $5 more," adding that over a forty-one-year tenure, "I have not seen that trend change."12 While reflecting extensive industry experience, this assumption remains untested at the company's expanded operational scale; during the 2008–2009 luxury downturn, New York accounted for a significantly larger proportion of a much smaller distribution network.23 A broad pullback in high-end dining would simultaneously pressure volume, product mix, and trade receivables.
Geopolitical exposure in the Gulf. Geopolitical risk materialized in March 2026 when regional conflict impacted operations during the final month of the first quarter. Management disclosed that Middle Eastern operations—representing under 10% of total company revenue—ran at roughly 75% of prior-year levels in April due to reduced hotel and resort occupancy, before recovering to approximately 94% across May and June.129 Two operational details stand out: first, operations in Qatar and Oman demonstrated greater resilience than Dubai and Abu Dhabi due to lower reliance on international tourism. Second, supply chains maintained continuity as teams rerouted products via alternative ports, air freight, and overland routes at higher transit costs.9 Management subsequently incorporated conservative assumptions into second-half 2026 guidance to account for ongoing regional volatility.9
Input cost volatility in both directions. In the second quarter of 2026, center-of-the-plate inflation reached 6.4%, while specialty product inflation stood at 4.0%.9 While input price inflation generally inflates reported top-line revenue and gross profit dollars, price deflation presents a structural challenge, as dollar-denominated sales and gross profit contract on steady unit volume. Addressing this dynamic, Pappas noted that the business is managed toward total gross profit dollars rather than fixed margin percentages, explaining that "our basic overhead is kind of fixed. So it's really the gross profit dollars we take to the bank."12 Consequently, a sustained deflationary cycle in protein prices could compress absolute operating profits even if volume remains stable.
Fuel and labor. Second-half 2026 guidance assumes national average diesel prices remain above $5 per gallon without modeled cost relief.9 Concurrently, driver and warehouse labor markets remain constrained. Because specialty distribution involves smaller drop sizes per stop than broadline operations, the model requires more delivery drivers per revenue dollar. CFO Jim Leddy noted that "the power of our growth is overwhelming the fuel impact right now"—an observation that remains contingent on sustaining current volume growth rates.9
Integration and execution. The company is managing multiple simultaneous capital projects: facility consolidation in Portland, expansion of a processing center in Las Vegas, real estate realignments in Dallas and Houston, expansion in Denver, and cold-storage additions across several markets.49 While individual project delays are manageable, simultaneous execution missteps during a period of normalizing volume growth could leave the company carrying excess, underutilized warehouse capacity—the structural issue that restrained operating margins for a decade.
Technology disruption. The concern that artificial intelligence or e-commerce platforms might disintermediate food distributors appears overstated; digital algorithms cannot execute physical cold-chain logistics or deliver perishable goods to kitchen prep stations. A more plausible technological risk is competitive erosion: as digital ordering tools and analytics platforms become standardized across the industry, they may diminish the service differentiation supporting specialty price premiums, leaving physical route density and product depth as the primary competitive moats.
The bull case.
The bullish thesis posits that fiscal 2026 represents the initial realization of platform earnings power, as distribution capacity, sales capabilities, and procurement systems operate in alignment. The underlying mechanism relies on filling available warehouse capacity, optimizing route density, leveraging sales force maturity to drive unique placements, and utilizing scale in pricing and procurement to capture margin. Disclosed metrics provide supporting evidence: double-digit organic volume growth, gross margin expansion achieved without discounting, declining adjusted operating expenses as a percentage of sales, and debt leverage decreasing to 1.6 times.9 Additional growth drivers include a fragmented regional market where independent purveyors face succession decisions, under-penetrated markets where management estimates three-to-five-fold expansion potential—particularly in the Southeast and Carolinas—and potential recovery in Gulf operations as travel normalizes.129 Achieving the 2030 targets would yield approximately half a billion dollars in adjusted EBITDA alongside annual capital expenditures near 1% of sales.
The bear case.
The bearish thesis acknowledges recent operational gains but questions their durability and current valuation pricing. Recent quarterly performance was achieved during a period of resilient consumer spending, strong hospitality bookings, and supportive product inflation. Excluding inflation, volume growth ran in the mid-to-high single digits against annual customer attrition in the high single digits. With fixed costs representing roughly one-third of operating expenditures, operating leverage can reverse if volume growth decelerates. Historically, gross margins have fluctuated within a narrow band of 23.7% to 26.4%, suggesting that recent 25.1% margins may be near a cyclical peak rather than a baseline.13 Furthermore, potential share dilution from the 2028 convertible notes represents an approximate 20% increase in share count, while goodwill and intangible assets account for over 80% of book equity. With the equity price having roughly doubled from its 52-week low, current valuations increasingly discount full achievement of 2030 targets.10
Why it wins from here, and what falsifies that.
The company's competitive positioning rests on three pillars: catalog depth, local route density, and specialized category expertise in a market segment that broadline distributors find structurally difficult to serve directly. This market position is currently supported by concurrent gains in gross margins and unit volume—a combination rarely produced by promotional pricing.
Key operational metrics provide clear falsification tests for the investment thesis. Deceleration in unique item placement growth toward overall case growth would indicate stalling wallet-share expansion. Flat gross profit per route alongside revenue growth would challenge the density thesis. Gross margin contraction during a deflationary protein cycle would suggest that recent margin gains reflected price inflation rather than operational pricing power. Finally, a return to large-scale M&A in response to slowing organic growth would indicate a shift away from recent capital discipline toward historical serial acquisition strategies.
IX. Epilogue & Playbook Lessons
Certain businesses are easy to admire yet difficult to own. They compound slowly, invest for years in infrastructure whose benefits remain hidden, and feature leadership that repeatedly promises that operational leverage is just around the corner. Frequently, such promises go unfulfilled. Occasionally, however, operating arithmetic asserts itself, and years of unglamorous capital deployment produce results that appear, in hindsight, obvious.
The Chefs' Warehouse has entered a phase where its underlying model appears obvious. Evaluating its recent trajectory requires separating operational discipline from favorable market timing, as four decades of company history offer evidence for both interpretations, and coming quarters will provide further clarity.
Three broader strategic lessons emerge from this operating history.
One: niche scale beats broad participation. The company cannot out-distribute Sysco and has never attempted to do so. Instead, it targeted a market segment defined by operational friction that broadline operators avoid — small order drops, slow-turning specialty inventory, demanding culinary clients, and fragmented purchasing — turning those operational burdens into barriers to entry. As a result, a distributor roughly one-twentieth the size of the industry leader retains approximately one-third more gross profit per sales dollar. The broader lesson extends beyond simply identifying a niche: the most defensible market positions are defined by operational burdens a primary competitor would have to compromise its core business model to accept.
Two: a specialized sales organization acts as a moat only when treated as capital expenditure. The chefs-selling-to-chefs approach succeeds because consultative sellers influence product selection rather than merely processing orders. However, the model functions economically only if management views each hire as a multi-year investment that consumes cash long before generating profits. Chief Executive Officer Christopher Pappas's observation that developing new sales representatives requires extended investment — noting that "the first few years is just putting so much investment in these people" — reflects the underlying financial reality of the model.9 The operational implication is clear: a company pursuing this strategy will appear over-costed relative to peers until its sales force achieves mature productivity.
Three: expanding into lower-margin categories can be strategic, provided management tolerates interim margin compression. The center-of-the-plate protein expansion permanently reduced blended gross margin by roughly two percentage points while introducing yield loss, specialized butcher labor, and commodity price exposure. However, it also nearly doubled addressable spend per customer and protected delivery routes against competing protein purveyors who might otherwise have used meat sales as an entry point into kitchen accounts. While the strategic rationale was sound, reported margins appeared depressed for years, requiring patient capital. Executing this playbook requires clear advance communication regarding which financial metrics will contract and for how long, as public markets routinely price margin deterioration long before recognizing strategic gains.
A fourth takeaway relates to balance sheet management rather than strategy. Twice over fifteen years — during its 2011 initial public offering and its 2019 convertible note issuance — the company raised capital ahead of immediate operational needs. In both instances, that pre-emptive liquidity proved decisive when industry conditions shifted: the IPO funded a decade of regional consolidation, while the 2019 convertible provided critical reserves during 2020 restaurant closures. Neither capital raise seemed urgent when executed. For an operator in a cyclical, working-capital-intensive sector, the option value of opportunistic liquidity remains underappreciated, whereas discovering a capital shortfall during an industry crisis often threatens corporate survival.
The one risk that has no hedge.
The final observation centers on leadership longevity. The company's most distinctive element is neither a distribution facility nor a digital system, but a founder who has served as chief executive for forty-one years while maintaining a consistent thesis on operating leverage. Such strategic continuity across market cycles is rare and valuable, yet it also creates a key-person risk that formal succession planning cannot fully eliminate. The business emerging from the current expansion phase will ultimately test whether the culture Pappas describes as "curated over 40 years" is deeply embedded across 5,156 employees and 44 distribution facilities, or resides primarily within executive headquarters in Ridgefield, Connecticut.29
That question will not be resolved by single quarterly financial results. It will be answered when the high-end dining sector faces its next sustained cyclical contraction.
References
-
Christopher Pappas — Board of Directors and Management, The Chefs' Warehouse, Inc. ↩↩↩↩
-
Form 10-K Annual Report for Fiscal Year Ended December 26, 2025 — The Chefs' Warehouse, Inc. / SEC EDGAR, 2026-02-24 ↩↩↩↩↩
-
Chefs' Warehouse 2025 Annual Report Summary: $4.15B revenue, Adjusted EBITDA $258M — StockTitan ↩
-
The Chefs' Warehouse (CHEF) Q4 2025 Earnings Call Transcript — The Motley Fool, 2026-02-11 ↩↩↩↩↩↩↩↩↩
-
Performance Food Group Company Reports Fourth-Quarter and Full-Year Fiscal 2026 Results — Performance Food Group, 2026-08-12 ↩
-
Chefs' Warehouse details $4.1B specialty food business — Form 10-K filing summary, StockTitan ↩
-
The Chefs' Warehouse (CHEF) Q2 2026 Earnings Call Transcript — The Globe and Mail / The Motley Fool, 2026-07-29 ↩↩↩↩↩↩↩↩↩↩↩↩↩↩↩↩↩↩↩↩↩↩↩↩↩↩↩↩↩↩↩↩↩↩↩↩↩↩↩↩↩↩↩↩
-
Exhibit 21 — Subsidiaries of the Company, The Chefs' Warehouse, Inc. / SEC EDGAR ↩
-
CHEF Q1 2026 Earnings Call Transcript — The Motley Fool, 2026-04-30 ↩↩↩↩↩↩↩↩↩↩
-
The Chefs' Warehouse, Inc. — SEC EDGAR Filings and Historical Annual Reports (CIK 0001520697) ↩↩↩↩↩↩↩↩↩↩↩↩
-
The Chefs' Warehouse, Inc. Announces Pricing of Its Initial Public Offering — The Chefs' Warehouse IR, 2011-07-27 ↩
-
Form 8-K Exhibit 99.1 — Completion of Initial Public Offering, The Chefs' Warehouse / SEC EDGAR, 2011 ↩
-
Form 8-K Exhibit 99.1 — The Chefs' Warehouse, Inc. Acquires Michael's Finer Meats, LLC / SEC EDGAR, 2012-08-13 ↩
-
The Chefs' Warehouse Acquires Qzina Specialty Foods — The Chefs' Warehouse IR, 2013-05-01 ↩
-
The Chefs' Warehouse Acquires Allen Brothers — The Chefs' Warehouse IR, 2013-12-11 ↩
-
Form 10-K Annual Report for Fiscal Year 2013 — The Chefs' Warehouse / SEC EDGAR ↩
-
The Chefs' Warehouse to Acquire Del Monte Meat Company — The Chefs' Warehouse IR, 2015-01-12 ↩↩
-
Form 8-K — Completion of Del Monte Capitol Meat Co. Acquisition, The Chefs' Warehouse / SEC EDGAR, 2015-04-06 ↩
-
The Chefs' Warehouse Announces Pricing of $130 Million of 1.875% Convertible Senior Notes Due 2024 — The Chefs' Warehouse IR, 2019-11 ↩
-
The Chefs' Warehouse (CHEF) Q1 2020 Earnings Call Transcript — The Motley Fool, 2020-05-07 ↩↩↩↩↩↩↩↩↩↩↩↩↩
-
Form 10-K Annual Report for Fiscal Year 2020 — The Chefs' Warehouse Investor Relations ↩
-
The Chefs' Warehouse Announces Pricing of $50 Million of 1.875% Convertible Senior Notes Due 2024 — The Chefs' Warehouse IR, 2021-03 ↩
-
The Chefs' Warehouse Offers Food for Sale to the Public, Creating Contributions to Front-line Industry Employees Impacted by the COVID-19 Pandemic — GlobeNewswire, 2020-03-25 ↩
-
The Chefs' Warehouse, Inc. Acquires Sid Wainer & Son — The Chefs' Warehouse IR, 2020-01-21 ↩
-
Form 8-K Exhibit 99.1 — The Chefs' Warehouse Announces the Acquisition of Chef Middle East / SEC EDGAR, 2022-11-01 ↩
-
Form ARS — 2022 Annual Report, The Chefs' Warehouse, Inc. / SEC EDGAR ↩
-
The Chefs' Warehouse Announces Category and Regional Expansion with the Acquisition of Hardie's Fresh Foods and GreenLeaf Produce & Specialty Foods — The Chefs' Warehouse IR, 2023-05-01 ↩
-
Form ARS — 2023 Annual Report, The Chefs' Warehouse, Inc. / SEC EDGAR ↩
-
Chefs' Warehouse Sees Sales Climbing in 2026 on Strong Demand and Market Share Gains — Distribution Strategy Group, 2026-01 ↩
-
The Chefs' Warehouse Events and Presentations Hub — The Chefs' Warehouse IR ↩
-
Definitive Proxy Statement (DEF 14A) — The Chefs' Warehouse, Inc. / SEC EDGAR, 2026-03-25 ↩
-
The Chefs' Warehouse Investor Relations Portal — The Chefs' Warehouse, Inc. ↩
 LinkedIn
 WhatsApp
 Reddit
 Hacker News
 Email
Email Kindle
 RSS Feed
 Spotify
 Apple Podcasts
 Amazon Music
 Audible
 YouTube