Burlington Stores: The Off-Price Empire Built on Coats
I. Introduction & Episode Roadmap
On August 27, 2026, Chief Executive Officer Michael O'Sullivan opened Burlington's second-quarter earnings call with an unusual disclosure: the company had received an unexpected $55 million tariff refund and planned to return the full amount to customers. While peers quietly recognized similar windfalls as earnings, Burlington announced it would reinvest every dollar into price reductions during the second half of the fiscal year, leaving the full-year profit impact at exactly zero.1
Excluding the refund, the underlying quarterly results reflected strong operating metrics. Total sales grew 11% year-over-year, building on a 10% gain from the prior-year period. Operating margin expanded by 100 basis points, exceeding guidance of 30 to 60 basis points. Adjusted earnings per share rose 38% after a 39% gain the previous year, marking the fifteenth consecutive quarter of double-digit EPS growth.1 However, comparable store sales—the key metric tracking performance at existing locations—grew by just 2%. When asked whether he had grown more cautious about consumer demand than three months prior, O'Sullivan answered succinctly: yes. "Candidly," he added, "I was hoping for more than a 2% comp in the second quarter."2
That tension—rapid earnings growth occurring alongside modest comparable sales growth—captures the core operational paradox facing Burlington Stores today and explains why the retailer warrants thorough analysis.
Burlington Stores ranks as the third-largest off-price retailer in the United States, trailing its principal competitors by a wide margin. In the fiscal year ended January 31, 2026, the company generated $11.57 billion in revenue across 1,212 stores in 46 states, Washington, D.C., and Puerto Rico, employing 83,309 associates with an adjusted operating margin of 8.0%.34 By comparison, market leader TJX Companies—parent of TJ Maxx and Marshalls—generated $60.4 billion in sales across 5,214 stores during the same period.5 Second-place Ross Stores generated $22.8 billion from 2,267 locations and earned $2.1 billion in net income, roughly three and a half times Burlington's $610 million.63 Burlington's market capitalization stands at approximately $16 billion, down significantly from its prior-year high.7
Why third place is the interesting seat.
Occupying third position in a concentrated industry presents distinct strategic implications. On one hand, it can signal a challenger with substantial expansion runway; Burlington operates fewer than a quarter of TJX's store count while targeting overlapping customer demographics. On the other hand, it can reflect a structurally weaker operator that inherits inventory passed over by competitors and real estate they declined. Evaluating which narrative better describes Burlington is central to assessing the company's strategy, and current operational evidence offers support for both views.
A third explanation also merits consideration and reflects current equity market pricing. Burlington may be an improved operator that has already captured the initial phase of its turnaround—the immediate cost efficiencies, store footprint downsizing, and initial supply chain modernizations—and now enters a more challenging phase where ongoing growth depends on expanding customer volume rather than trimming expenses. Fifteen consecutive quarters of double-digit earnings growth remain consistent with all three scenarios; the determining factor going forward will be top-line sales performance rather than margin expansion alone.
A foundational principle governs off-price retail economics: the model relies not on predicting fashion trends, but on capitalizing on the apparel industry's systemic inability to forecast demand accurately. Profitability depends on the operational execution required to convert excess vendor inventory into profitable retail selection. In effect, industry overproduction provides the raw material, while the off-price supply chain functions as the processing engine. Burlington's commercial history reflects a firm that enjoyed direct access to excess inventory from its inception, spending five decades refining its operational model to process it effectively.
The roadmap.
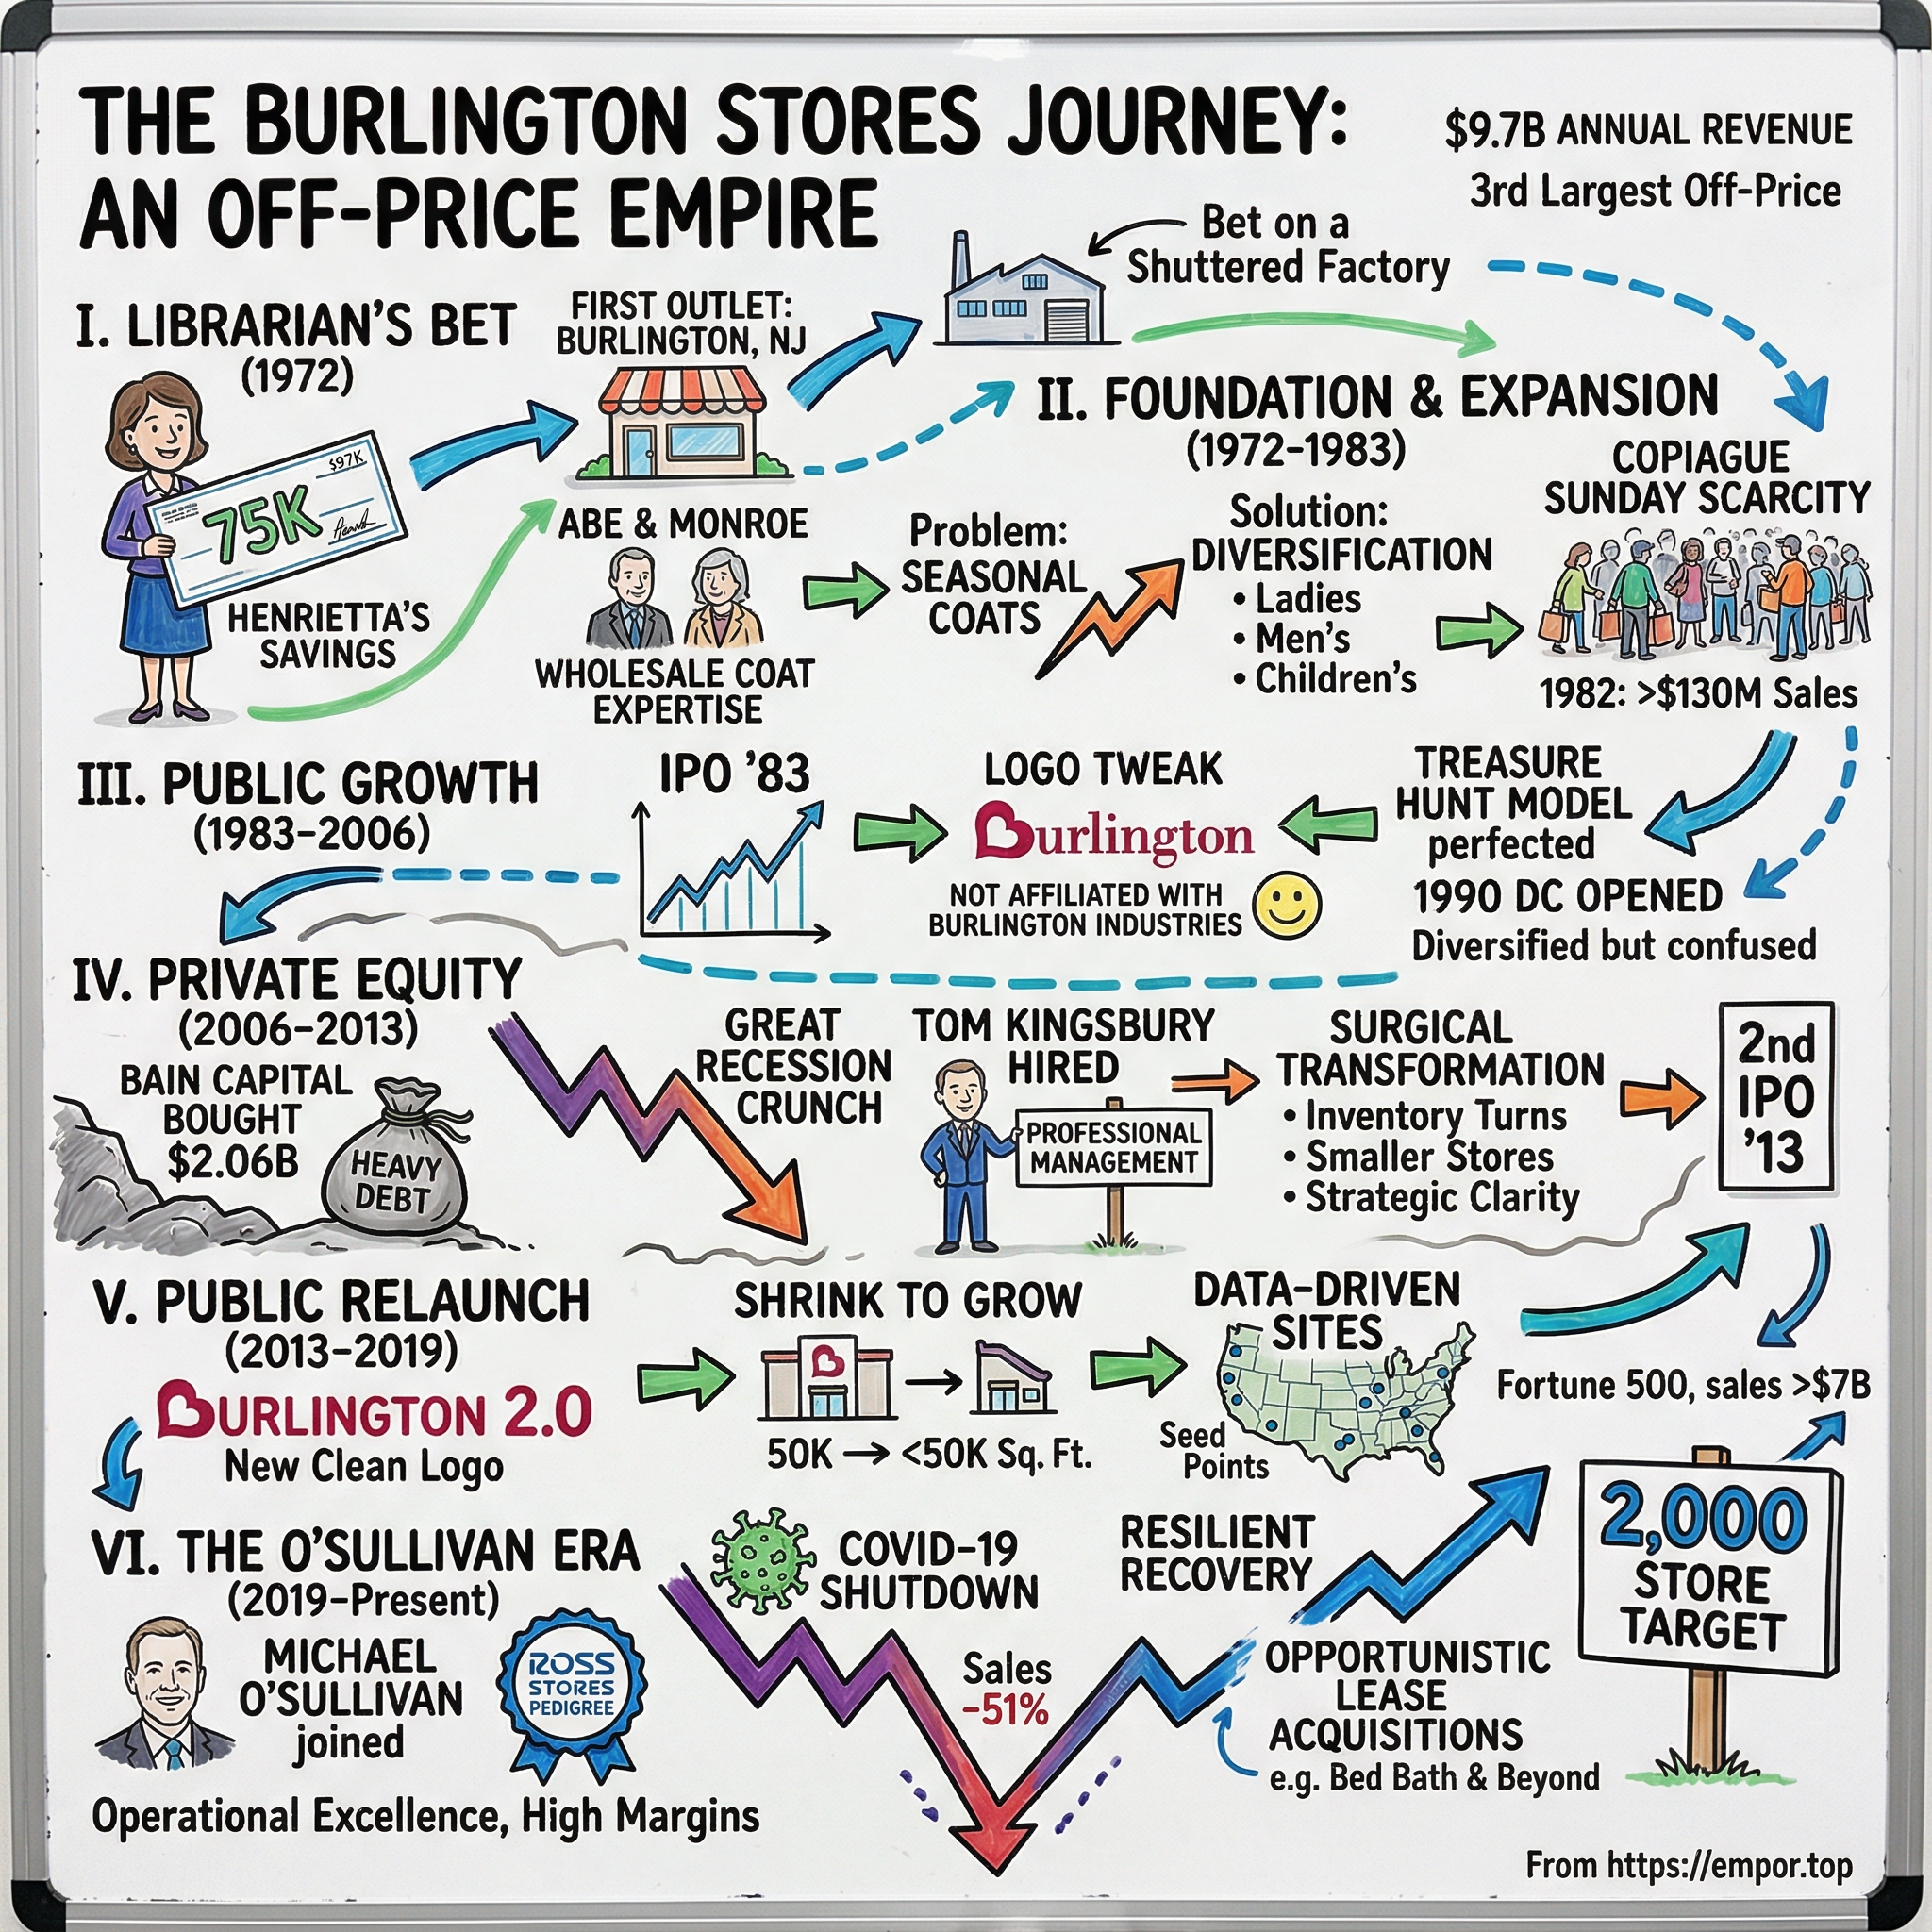
The business evolution spans several distinct eras. A wholesale coat business founded in New Jersey in 1924 by a Russian immigrant transitioned to retail in 1972 using a down payment backed by a schoolteacher's savings. Over the next three decades, the company expanded into a regional chain of large-format stores selling outerwear at deep discounts—a seasonal model highly profitable during winter months but challenged during the remainder of the year. In 2006, Bain Capital acquired Burlington in a $2.1 billion leveraged buyout, adding substantial debt, recapitalizing capital via dividends, and bringing in executive management. The company re-entered public markets in 2013. In 2019, the board appointed a long-time Ross Stores executive who began restructuring Burlington's operations around smaller store footprints, faster inventory turns, the elimination of e-commerce, and strict expense management.
These operational changes drove significant earnings growth over the subsequent four years. For long-term investors, the central inquiry is whether this trajectory stems from a durable structural advantage, a one-time operational catch-up to mature peers, or executive skill in optimizing bottom-line profits from modest revenue gains. Each explanation carries distinct implications for future enterprise value.
The analysis that follows examines Burlington's trajectory across key operational milestones: its origins as a family wholesaler; the structural limitations of its early big-box outerwear model; private equity ownership under Bain Capital; its return to public markets and initial footprint reductions; the operational turnaround under O'Sullivan; the comparative economics of off-price retail; capital allocation and management incentives; an evaluation of core corporate claims against historical data; a strategic positioning analysis; bull and bear investment theses with key performance indicators; and an assessment of recent executive earnings commentary.
 Subscribe on LinkedIn
II. The Wholesaler's Library: Milstein Family Origins (1924–1972)
Monroe Milstein died on May 9, 2025, at the age of 98, in Bal Harbour, Florida.8 By then, the company he founded was opening more stores in a single quarter than it had operated during its first decade, executing an operational playbook he would have found unrecognizable. He lived long enough to watch his creation evolve far beyond its origins in outerwear.
A wholesaler's education.
The business originated with his father, Abe Milstein, a Russian immigrant who opened a wholesale outerwear company in 1924 called Amherst Fashions, selling coats and suits to specialty and department stores across New England and the Midwest.98 It was the unglamorous middle of the garment trade: buy from manufacturers, sell to retailers, profit on the spread, and absorb the inventory risk when a season faltered. Monroe joined the firm after World War II and eventually initiated a practice that unnerved his wholesale customers—selling merchandise directly to consumers at discounted prices out of a garment-center outlet.9
The move was unusual not because outlet stores were new, but because of who was running them. A wholesaler selling direct to consumers competed directly with its own retail clients—a hostile act in the mid-twentieth-century garment trade. That tension foreshadowed the core dynamics of off-price retail: excess inventory must be liquidated, and the primary question is whether it moves through a channel that protects or damages brand equity.
Sitting at the intersection where supply chain miscalculations became visible, a wholesaler had an immediate view of canceled department store orders, manufacturer over-cuts, and seasonal inventory risks. Operating simultaneously as a retailer created an information advantage over pure merchants. Monroe Milstein recognized that dynamic decades before the term "off-price" entered the retail lexicon.
The down payment.
The strategic transition occurred in 1972, financed by family savings. Henrietta Milstein, who had fled the Holocaust as a child before working as an elementary school teacher and librarian in New Jersey, had saved most of her income.89 Those savings funded the bulk of a $75,000 down payment on a $675,050 purchase of a defunct coat factory and outlet facility in Burlington, New Jersey.98 The couple pledged their personal finances to secure a single leased-and-mortgaged site in a location unfamiliar to most consumers.
The risk profile of that decision was substantial. A middle-aged couple committed a schoolteacher's savings to a single property in an industry where they lacked direct retail operational experience, at a time when American department stores dominated apparel distribution. Without institutional venture capital or franchise support, the decision rested on a conviction that systemic inefficiencies across the wholesale garment trade were large enough to sustain an off-price business model.
The nature of the acquisition set a pattern for future expansion. Rather than constructing new retail space, the family acquired a vacant industrial building and retrofitted it for retail inventory. Acquiring second-generation real estate at prices reflecting prior tenant failure became a permanent site-selection strategy—a pattern Burlington repeated in 2023 when it acquired 50 leases from the bankrupt estate of Bed Bath & Beyond.
Why the pivot worked.
In its first year of operation, the Burlington facility generated approximately $1.5 million in sales.10 Henrietta Milstein subsequently established the children's department, broadening the store's customer appeal beyond outerwear toward a department store format.9 The transition from wholesale to retail functioned as an operational arbitrage: coats sold at discounts of 20% to 60% below department store list prices still generated attractive unit margins because outerwear carries high absolute dollar values per item.
High dollar margins per unit on coats generated strong initial cash flow, establishing business habits and store formats that sustained the company for the next three decades.
III. The Big-Box Outerwear Monopoly: Burlington Coat Factory (1972–2006)
A Sabbath, a blue law, and a queue around the block.
Three years after opening their first retail location, the Milsteins expanded to Copiague, Long Island. The store was managed by Monroe's eldest son, Lazar, an Orthodox Jew who observed the Sabbath by closing on Saturdays. Under Long Island's blue laws at the time, Sunday commercial trading was permitted only for businesses closed on Saturdays. As a result, a religious obligation that might have cost the store a peak shopping day instead granted it exclusive access to Sunday retail traffic across the region. On opening day, 300 customers queued around the block.9
The scaling decade.
That opportunistic, family-managed expansion characterized Burlington's early scaling decade. The company gradually phased out its legacy wholesale operations, closing them entirely by 1983—the same year Burlington completed its initial public offering with just over 30 stores generating nearly $300 million in annual sales.9811 Revenue reached $480 million by 1987, approached $1 billion by 1992, and expanded to $1.2 billion in 1993 across 185 locations.10
By 1993, the chain spanned 39 states. A typical store carried between 10,000 and 20,000 garments sourced from as many as 300 manufacturers, offering discounts of 35% to 40% off conventional department store prices.11 This broad vendor network and deep inventory selection established the foundation for off-price retail's characteristic treasure-hunt experience, demonstrating an increasingly sophisticated merchandising operation despite undeveloped corporate systems. Growth continued over the following decade, bringing the footprint to 335 stores and annual revenue to $2.69 billion by 2003.11
The flaw in the format.
Yet beneath that top-line expansion lay a structural flaw in store architecture. In 1993, Burlington's store sizes ranged wildly from 16,000 to 133,000 square feet—reflecting a collection of disparate real estate rather than a standardized retail format.10
That footprint variance stemmed directly from the company's acquisition strategy of taking second-generation, distressed retail space at steep discounts regardless of layout. The approach absorbed former supermarkets, vacant discount centers, and abandoned department store anchors. High-ticket, bulky outerwear initially masked the structural inefficiency; strong gross margins on winter coats during November and December generated sufficient cash flow to cover excess square footage during slow summer months.
Filling the box.
To address seasonal imbalance, management added new product categories, expanding into menswear, family footwear, home decor, and Baby Depot—a specialized baby furniture and accessories store-within-a-store.11 While logically sound, this strategy introduced operational complexity. Expanding product assortments to fill large 60,000-square-foot footprints resulted in thinly merchandised floors, driving low sales productivity per square foot, sluggish inventory turnover, and heavy end-of-season markdowns.
Corporate diversification further strained execution. Alongside Baby Depot, Burlington operated separate store banners including Cohoes Fashions, an upscale retailer, and MJM Designer Shoes.11 Managing multiple retail concepts required separate buying teams, distinct real estate criteria, and dedicated logistics infrastructure before the core business had established standardized systems. By contrast, modern Burlington derives over 99% of its revenue from its primary banner.4
Branding posed an additional structural obstacle. Although category diversification successfully reduced coats to roughly 20% of sales by 1998, consumer perception remained tied to the company's legacy name.11 The "Coat Factory" title permanently fixed the brand in the public mind as a seasonal outerwear destination. Decades later, O'Sullivan noted that Burlington still trailed peers in brand awareness, observing in August 2026 that "when shoppers have heard of us, more often than not, they think of the Coat Factory."2
What Bain actually bought.
By the time Bain Capital acquired the company in 2006, Burlington operated 367 stores across 42 states.12 While revenue had expanded steadily for three decades, the core operational model suffered from structural disadvantages compared to mature off-price competitors TJX and Ross Stores. Burlington continued to purchase inventory seasonally rather than opportunistically, held stock in store backrooms for extended periods, and operated footprints far larger than its merchandise density justified.
Bain Capital acquired a retailer whose operational inefficiencies were offset by valuable real estate assets, setting the stage for a private equity restructuring focused initially on financial engineering rather than store-level operational reform.
IV. The Bain Capital LBO & PE Crucible (2006–2013)
Bain Capital announced its acquisition of Burlington on January 18, 2006, completing the transaction on April 13 at $45.50 per share in cash, representing a total enterprise value of $2.1 billion.12 The founding Milstein family, holding roughly 62% of the company's stock, received about $1.3 billion in the deal,9 which passed with 86.3% approval among voting shares.12 Bain's announcement highlighted its retail portfolio at the time—including Toys "R" Us, Staples, Sports Authority, and Domino's Pizza—a list that hindsight reveals as a representative cross-section of mid-2000s leveraged buyout history in specialty retail.12
The financial engineering.
What followed at Burlington serves as a case study in private equity ownership, supporting both critical and favorable interpretations depending on which side of the ledger one examines.
On the financial side, Bain structured the purchase with substantial leverage and twice refinanced that debt to fund capital distributions before completing operational repairs. In February 2011, Burlington refinanced its existing credit facilities with a new $1.0 billion term loan and $450 million in 10% senior notes due 2019, distributing $297.9 million in dividends as part of the transaction.13 Two years later, in February 2013, a holding entity above the operating company issued $350 million in senior notes due 2018—bearing a 9.00% cash interest rate or 9.75% if paid in kind—to fund another special dividend of approximately $336 million to shareholders, alongside a $3.5 million advisory fee to Bain Capital.13
In total, Bain extracted roughly $634 million in dividend distributions funded entirely by fresh debt during the two years preceding Burlington's initial public offering. This mechanism effectively de-risked Bain's initial equity investment using the target company's borrowing capacity rather than its operational earnings.
The structural details of the 2013 refinancing illustrate the mechanics of dividend recapitalizations. The debt was issued not by the operating company itself, but by a holding company positioned above it—meaning the debt did not appear on the operating entity's financial statements and was not guaranteed by its operating subsidiaries.13 Servicing that debt required the operating business to send cash upward to the parent entity. While fully legal and disclosed, this arrangement allowed cash extraction while keeping direct debt off the operating balance sheet that public investors would later evaluate.
The operational repair.
Conversely, Bain initiated an essential strategic repositioning that family leadership had long deferred. In 2008, the board recruited Thomas Kingsbury, a veteran executive from May Department Stores, as chief executive. Kingsbury began converting the seasonal coat merchant into a true off-price operator: transitioning procurement from long-lead seasonal commitments to opportunistic in-season buying, accelerating inventory turns, and re-evaluating store size requirements.
Operational overhaul proved far more demanding than financial engineering. Rebuilding a buying organization required shifting merchant incentives from gross margin percentage to inventory velocity, preserving open-to-buy capital late into seasons, and adapting to unpredictable merchandise flows. That multi-year operational rebuilding laid the structural groundwork that Michael O'Sullivan would later build upon.
The financial burden of this high leverage constrained performance during a pivotal economic period. In the fiscal year ended February 2, 2013, Burlington generated $4.17 billion in revenue and roughly $143 million in operating profit—a 3.4% operating margin—while carrying $114 million in annual interest expense.13 Consequently, debt service absorbed nearly 80% of operating profits. While unlevered competitors TJX and Ross captured market share as price-conscious consumers traded down during the Great Recession, Burlington's debt load and legacy store formats limited its ability to capitalize on that industry tailwind.
The verdict on the buyout.
The private equity era yielded a dual legacy. Bain provided institutional governance, professionalized management, and broke from family legacy practices. However, servicing roughly $1.4 billion in debt through an economic downturn extracted a heavy toll in interest costs, dividend payouts, and capital constraints. As a result, Burlington re-entered the public market with a modernized merchandising framework, but with a significantly more leveraged balance sheet than its principal peers.
Deleveraging that balance sheet would require nearly a decade, while right-sizing its store fleet presented an even longer operational task.
V. Return to Wall Street & The Small-Footprint Pivot (2013–2019)
Burlington's initial public offering priced on October 1, 2013, at $17 per share—above its marketed range of $14 to $16—selling 13.3 million shares to generate gross proceeds of approximately $226 million.1415 On its first day of trading on the New York Stock Exchange, the stock closed at $25.01, representing a 47% gain.15 The company stated that it would use the net proceeds to pay down debt.15
A 47% first-day gain is typically interpreted as evidence that underwriters underpriced the offering. In this instance, it also reflected public market enthusiasm for a specific investment narrative: not a seasonal coat merchant, but a turnaround candidate modeled after Ross Stores, possessing expansion runway and a management team actively restructuring operations. Formally dropping "Coat Factory" from the corporate name signaled that strategic intent.
What the market thought it was buying.
Strategic intent, however, initially outpaced operational reality. The newly public retailer inherited a fleet of oversized boxes accumulated through four decades of opportunistic real estate acquisitions, a distribution system designed for seasonal coat shipments rather than continuous opportunistic inventory receipts, and an operating margin constrained between 7% and 8% while market leaders TJX and Ross operated in the low double digits.
The shrink begins.
Kingsbury's executive team spent the mid-2010s directly addressing store architecture, reducing the prototype footprint for new store openings while relocating older locations into smaller, higher-traffic strip centers. Although operationally complex, the strategy delivered attractive financial returns. A smaller location in a busier center produces lower absolute sales volume but generates substantially higher revenue per square foot, carries lower occupancy costs, and requires reduced inventory and store-level payroll. Consequently, store-level return on invested capital improves even when unit sales decline.
A second, structural advantage reinforces the smaller footprint strategy in off-price retail. Company regulatory filings emphasize that the ability to chase sales trends—purchasing less inventory pre-season and allocating capital opportunistically in-season—serves as the core of the business model, requiring operational flexibility to shift procurement across suppliers and product categories in real time.4 A smaller store layout enhances this agility. When floor space is constrained, every square foot must justify its allocation, compelling merchants to accelerate inventory velocity and maintain selection freshness. Conversely, expansive store footprints create adverse operational incentives: excess square footage demands inventory filling, leading buyers to commit to secondary merchandise and risking the conversion of a treasure-hunt format into a warehouse setting.
Fleet right-sizing progresses slowly due to long-term commercial lease commitments. Retailers cannot instantly reduce physical footprints; they must await lease expirations, negotiate landlord exits, secure replacement locations, and absorb lease overlap costs. The enduring scale of this historical footprint remains evident in company disclosures. At the end of fiscal 2025, Burlington's 1,212 stores occupied 52.8 million gross square feet—an average of roughly 43,600 square feet per store—whereas new store openings that year averaged approximately 28,000 square feet, against a target prototype of 25,000 square feet.4 After more than a decade of footprint reduction, the average existing store remains 74% larger than management's target model, representing a lasting structural legacy of the Coat Factory era and a primary factor shaping Burlington's cost structure.
The ceiling.
Evaluating management's current strategic claims requires a precise assessment of what the post-IPO restructuring accomplished and what remained unaddressed. The company successfully overhauled its purchasing strategy, transitioning into an opportunistic, in-season buyer rather than a seasonal commit merchant, while steadily reducing new store square footage. However, critical downstream operational capabilities remained unfulfilled: distribution center capacity, advanced planning and allocation systems, reserve inventory storage infrastructure, and systematic site selection discipline. Implementing these capital-intensive capabilities proved difficult while management prioritized deleveraging buyout-era debt alongside new store expansion.
By 2019, the structural limits of this initial turnaround phase became evident. Although Burlington continued to expand its store fleet and increase revenue, the operating margin gap relative to TJX and Ross remained largely unclosed. Supply chain infrastructure faced capacity constraints, holding back the ability to store opportunistic inventory buys for later release. Site selection procedures, while improved, lacked algorithmic standardization, and merchandising teams lacked the store-level allocation systems utilized by mature peers to customize inventory assortments by location.
In September 2019, after more than eleven years as chief executive, Kingsbury stepped down. The board's selection of a successor clearly indicated its diagnosis of the company's next operational phase.
VI. The O'Sullivan Revolution & "Burlington 2.0" (2019–Present)
The consultant from Ross.
Michael O'Sullivan became Burlington's chief executive effective September 16, 2019.16 He had spent sixteen years at Ross Stores, rising to president and chief operating officer in 2009, and before that nearly twelve years as a partner at Bain & Company.16 He is, in other words, a management consultant who spent a decade and a half inside the most operationally disciplined off-price retailer in America, hired by a board that wanted Burlington to become that.
The board paid accordingly. O'Sullivan's fiscal 2019 compensation totalled $31.06 million for roughly four and a half months in the job, of which $16.48 million was stock awards and $13.81 million option awards — an inducement package built almost entirely from equity that would be worth something only if the stock re-rated.17 Whatever else one thinks of Burlington's pay practices, the initial contract was structured as a bet, not a salary.
His first major decision arrived within six months and was, by the standards of 2020 retail orthodoxy, close to heresy.
Switching off the website. On March 5, 2020, O'Sullivan told analysts that Burlington would shut down its e-commerce site entirely. The site represented about 0.5% of sales. His reasoning was arithmetic, not ideology: "E-commerce, when you fully account for the cost of merchandising, processing, shipping, accepting returns, it's very difficult, impossible to make at those price points in the businesses that we compete in."18 The underlying mechanic is simple enough to state in a sentence. If your average item sells for around twelve dollars and it costs several dollars to pick, pack, ship and process the return of that item, there is no version of the transaction that makes money — and off-price returns run high because customers cannot try things on.
It is a defensible decision on unit economics. It is also, as the next paragraph makes plain, a decision that removed the company's only non-physical revenue channel two weeks before every physical store in America closed.
The COVID hole. All Burlington stores were shut by March 22, 2020. In the quarter ended May 2, total sales fell 51% to $798 million; the company took a $272 million charge against aged inventory, which drove the gross margin rate down to 2.0% from 41.0% a year earlier; and it reported a net loss of $334 million.19 On April 16, 2020 it closed $1.1 billion of emergency financing — $300 million of high-yield secured notes and $805 million of convertible senior unsecured notes, both maturing in April 2025.19 The convertible notes were the expensive part, and the bill came due slowly: as late as the first quarter of fiscal 2026, Burlington was still buying back convertible principal, settling $111 million of notes for $129 million of cash plus 150,831 newly issued shares.20
Investors should hold both facts at once. The e-commerce exit was probably correct on a normalised basis and demonstrably did not prevent Burlington from growing sales 100% over the following six years. It also meant that when physical retail stopped, Burlington's revenue went to approximately zero, and the company financed the gap with instruments that transferred equity value to convertible holders at the bottom of the cycle. A strategy can be economically right and still leave you with no shock absorber.
The rebuild.
What O'Sullivan built after 2020 is a set of interlocking operating programmes that management labels with version numbers, and it is worth understanding them as a system rather than a list.
Merchandising 2.0 is the planning and allocation foundation — the systems that tell buyers and planners what to buy, how much, and where to send it. Its most important payoff is localization, which O'Sullivan has repeatedly described as the company's largest remaining unclaimed opportunity and, unusually for a CEO, as an area where Burlington is far behind. On the March 2026 call he said that walking a Burlington store in a beach community in summer, "it looks like Burlington Coat Factory has come to town," and that localization is "a capability that our off-price peers have had and have invested in for many, many years" and "an area where we frankly are a long, long way behind."21 That is a rare piece of candour, and it cuts both ways: it is credible evidence of a real remaining margin opportunity, and it is an admission that a decade after the re-IPO the company still lacks a basic capability its competitors have had for a generation.
Store Experience 2.0 is the physical remodel programme — new layouts, signage and fixtures — being rolled out across the chain.4
The real estate machine is the most visible piece. Burlington's stated plan is roughly 100 new stores per year on average, prioritising 25,000-square-foot stores in busy strip malls, toward a long-term target of 2,000 stores; alongside it runs a relocation programme moving older oversized stores into smaller nearby space, and a newer downsizing programme in which the company physically shrinks an existing store and either returns the excess footage to the landlord or sublets it.4 In fiscal 2025 the company opened 113 stores, relocated 18 and closed nine.4 By the second quarter of fiscal 2026 it had opened 178 gross new stores over the trailing twelve months — the fastest twelve-month pace in company history — ending the quarter with 1,287 stores.2
The supply chain is the least discussed and arguably the most consequential. Burlington operates six distribution centres totalling 5.1 million square feet plus five supporting warehouses of 2.4 million square feet. A seventh, in Ellabell, Georgia, near Savannah, spans approximately 2.06 million square feet — more than twice the size of the largest existing facility — and came online during fiscal 2026. Land has been purchased in Buckeye, Arizona for an eighth, targeted for fiscal 2028.4 These buildings are what make reserve inventory possible: buying merchandise opportunistically out of season, storing it, and releasing it when demand peaks. Reserve stock stood at 43% of total inventory at the end of the second quarter of fiscal 2026.2
The bankruptcy real estate trade. In June 2023, Burlington was the dominant bidder at the Bed Bath & Beyond lease auction in the U.S. Bankruptcy Court in Newark, taking 44 leases for $12 million on June 26 and six more outside the auction for about $1.53 million — 50 locations for roughly $13.5 million, when the entire auction of 109 successfully bid leases raised $24.41 million.22 Burlington took nearly half the value of a national retail liquidation.
The headline reads like free real estate. The accounting says otherwise. Since fiscal 2023 the company has excluded "expenses associated with bankruptcy acquired leases" from its adjusted results — $18 million in fiscal 2023, $16 million in fiscal 2024, $35 million in fiscal 2025, and an expected $16 million in fiscal 2026.31 That is roughly $85 million of real cash cost, largely dead rent and carrying expense on sites acquired before they could be opened, systematically presented outside the earnings that drive incentive compensation. The leases were cheap. Getting them into trading condition was not.
The 2025 tariff pivot, and what it revealed. When tariffs were introduced in April 2025, Burlington did something structurally revealing: rather than absorb the margin hit, it withdrew from the categories most exposed — principally home goods — cut receipt plans, ran leaner inventory to force faster turns, raised prices selectively where the customer would tolerate it, and attacked expenses across the P&L.21 The result was 80 basis points of operating margin expansion and 22% adjusted EPS growth for the year, well ahead of the guidance issued twelve months earlier.3
It also cost sales. O'Sullivan said so explicitly on the March 2026 call: the company had planned mid-single-digit comp growth and delivered 2%, and "we did not because the actions we took in response to tariffs were a drag on sales." In the fourth quarter, "I am convinced that we could have done even more sales."21
This is the most important behavioural data point in the whole story. Faced with a choice between sales and margin, this management team chooses margin, deliberately and repeatedly. That is a genuine skill and it has produced extraordinary earnings growth. It is also a choice with a cost that compounds: a retailer that repeatedly declines available volume is not testing the ceiling of its own demand.
Which brings us to the industry structure that determines whether that ceiling exists.
VII. Deep Dive: The Off-Price Triopoly & Unit Economics
Three stores, one parking lot.
A shopper stepping into a Burlington, a Marshalls, and a Ross Dress for Less in the same suburban strip center—an increasingly common arrangement as all three compete for similar real estate—encounters merchandise that appears broadly interchangeable. The operational distinctions that determine performance remain invisible on the sales floor. They reside instead in buying calendars, store square footage, the unit cost of moving inventory from containers to racks, and average transaction values.
The shape of the industry.
Off-price retail functions less as a conventional discount format and more as a liquidity service for apparel manufacturers and full-price merchants. Each year, brands overproduce, miscalculate demand, or face canceled orders, leaving excess inventory that cannot be sold through primary channels without damaging brand equity or price integrity. Off-price chains absorb this excess quietly, receiving steep wholesale buying discounts in exchange for rapid, discreet liquidation.
Providing this liquidation service requires substantial operational scale, creating high barriers to entry. Absorbing a manufacturer's 200,000 surplus units requires a store network broad enough to distribute merchandise without diluting localized pricing, logistics capacity to process unpredictable shipments, and merchant relationships that make a retailer the first call rather than a final resort. Consequently, American off-price retail has consolidated into a tight triopoly with pronounced scale disparities: industry leader TJX generated $60.4 billion in annual sales across 5,214 stores, Ross Stores generated $22.8 billion across 2,267 locations, and third-place Burlington generated $11.57 billion across 1,212 stores.5634
What Burlington actually sells.
Burlington's corporate name no longer reflects its underlying sales composition. In fiscal 2025, accessories and shoes represented the largest category at 28% of sales, followed by ladies' apparel at 20%, home goods at 20%, menswear at 17%, and children's apparel and baby products at 12%. Outerwear—the founding category—accounted for just 3% of sales.4 A business that derived over 20% of revenue from coats in the late 1990s now generates roughly one out of every thirty dollars from outerwear. This category diversification has reduced the retailer's historic vulnerability to unseasonably warm winter weather, even if seasonal trends still influence quarterly results.
On the procurement side, inventory sourcing remains deliberately fragmented. No single vendor accounted for more than 5% of Burlington's net purchases in any of the past three fiscal years, and the company maintains no long-term purchase commitments with suppliers.4 This structure eliminates inventory concentration risk and protects merchant leverage; buyers unencumbered by volume commitments retain the flexibility to reject unfavorable pricing, preserving the core discount mechanism.
The unit economics, explained simply.
Off-price unit economics depend on three primary operational levers: wholesale acquisition cost, logistics expense per unit, and inventory velocity.
Acquisition costs determine gross margin. Burlington generated a 43.9% gross margin rate in fiscal 2025, and 44.3% in the second quarter of fiscal 2026 excluding the tariff refund—metrics largely aligned with industry peers.31
Logistics expenses highlight a structural operational difference between Burlington and its larger competitors. Burlington records freight within cost of goods sold and product sourcing costs—covering procurement and distribution center operations—within selling, general, and administrative expenses, which totaled $226 million in the second quarter of fiscal 2026 alone.1 Crucially, freight and handling function primarily as fixed costs per unit rather than costs per dollar of sales; transporting a container or handling racks incurs roughly the same expense regardless of item price.
Consequently, handling expenses as a percentage of revenue rise when average unit retail prices are lower. Burlington operates at lower average price points than TJX or Ross, positioning itself as a moderate off-price retailer where low unit prices constrained e-commerce viability.18 The same low average unit retail that made e-commerce unprofitable makes physical processing costs proportionally higher relative to revenue. As a result, recent operating margin expansion has depended heavily on logistics productivity rather than higher merchandise markups.
Management's response has focused on distribution automation and scale. The Ellabell, Georgia facility that opened in fiscal 2026 spans more than twice the square footage of any previous Burlington building and incorporates advanced automation designed to reduce manual touches per garment.21 Empirical results show operational leverage: supply chain expenses leveraged by 50 basis points in fiscal 2024, 20 basis points in fiscal 2025, and an additional 20 basis points in the second quarter of fiscal 2026 while absorbing initial facility startup costs.212 Management expects new distribution centers to require approximately two years to reach full operational efficiency.21
The third operational lever, inventory velocity, is tracked through reserve inventory—opportunistic out-of-season merchandise held in warehouses for release during peak demand periods. Reserve inventory represented 43% of total inventory at the end of the second quarter of fiscal 2026, down from 50% a year earlier.1 Analysts track reserve levels as an indicator of opportunistic buying capacity and future gross margin potential, as low-cost acquisitions released during high-demand windows support higher realized markups.
The store math.
Store economics provide key evidence supporting Burlington's strategic turnaround. Newly opened stores average 27,000 to 28,000 square feet, are projected to generate over $7 million in first-year sales, and carry an estimated payback period of under two years.24 Across the broader fleet, 1,212 stores occupying 52.8 million gross square feet generated $11.57 billion in fiscal 2025 revenue—translating to roughly $219 per gross square foot, or $341 per square foot of selling space.43 By comparison, a new store producing $7 million across 27,000 square feet yields approximately $260 per gross square foot.
Consequently, new store prototypes achieve higher sales productivity per square foot on nearly half the footprint of legacy locations while reducing occupancy overhead. Rather than expanding through identical unit additions, Burlington is upgrading store quality by introducing smaller prototypes while phasing out oversized, legacy boxes through relocations and store downsizing.
This store strategy introduces a temporary headwind to store-level metrics. Opening $7 million prototype locations alongside a legacy fleet averaging nearly $9.5 million per store lowers average revenue per unit. Furthermore, opening new stores in existing markets cannibalizes sales from nearby locations. Management estimates this cannibalization reduces comparable store sales by roughly one percentage point in a typical year, rising to 1.5 percentage points in the second quarter of fiscal 2026 due to front-loaded store openings.2 Evaluating comparable sales without accounting for cannibalization risks understating underlying performance, particularly as opening cadences normalize.
The key analytical question moving forward is whether management's capital allocation matches the operational execution demonstrated across its store fleet.
VIII. Management, Governance, & Capital Allocation
An imported management team.
The Burlington leadership team has an unusual property for an American retailer: almost none of its senior operating experience was gained at Burlington.
O'Sullivan spent 2003 to 2019 at Ross Stores, the last decade of it as president and chief operating officer, and also sat on the Ross board from 2014 to 2019 before crossing over.16 Jennifer Vecchio, group president and chief merchandising officer, is the exception and the institutional memory — she has been in Burlington's merchandising leadership since at least 2015, well before O'Sullivan arrived, and earned $9.39 million in fiscal 2025.1716 Kristin Wolfe became chief financial officer in 2022 and earned $5.57 million in fiscal 2025; Travis Marquette serves as president and chief operating officer at $6.80 million.16
O'Sullivan himself received $17.15 million in fiscal 2025 — $1.52 million of salary, $10.84 million of stock awards, and $4.77 million of annual incentive.16 Notably, there were no option grants: the compensation committee eliminated stock options from the long-term incentive mix entirely beginning with the May 1, 2025 grants, moving to 65% performance stock units and 35% restricted stock units, up from a 50/50 performance split previously.16 Roughly 90% of his target annual compensation was classified as at-risk.16
What the incentives actually reward — and what they ignore. This is where a sceptical investor should slow down.
For fiscal 2025, the compensation committee used adjusted EBIT as the sole metric for the annual incentive plan. Actual adjusted EBIT of $923 million against a target of $850 million produced a payout of 157% of target for every named executive.16 The long-term plan is keyed to adjusted EPS growth: the fiscal 2023 performance stock units, measured over fiscal 2023 to 2025, targeted 13.3% average annual growth and delivered 33%, paying out at the 200% maximum.16
Two observations follow. First, both metrics are profit metrics, and both are adjusted — which is to say, both exclude the bankruptcy-acquired-lease costs discussed earlier, an exclusion that has grown rather than shrunk over time. Second, and more significantly, there is no return-on-capital metric and no comparable-sales metric anywhere in the incentive structure. A management team compensated on adjusted EBIT and adjusted EPS growth, running a business that is deploying roughly $875 million a year of capital expenditure and buying back stock, has every incentive to grow absolute profit and per-share profit — and no direct incentive to be efficient about the capital that produces it.316 That is not an accusation of misbehaviour; the store returns disclosed so far look strong. It is an observation about where the guardrails are, and are not.
Governance. The picture here has improved materially and mostly through stockholder pressure. The board is being fully declassified by the 2027 annual meeting following a charter amendment adopted in 2024; 11 of 12 directors are independent; the chair is independent — John J. Mahoney, retired vice chairman of Staples; there is no poison pill and no unequal voting rights; and Deloitte & Touche serves as auditor.16 The board carries genuine off-price and value-retail expertise, including Ted English, a former TJX chief executive, and Laura J. Sen, formerly of BJ's Wholesale. It also still includes Jordan Hitch, a Bain Capital alumnus — a residue of the buyout era.16 Stockholders supported the 2025 say-on-pay vote with approximately 89% of votes cast in favour: solid, but with a dissent level that is not trivial for a company posting these results.16
Ownership is heavily institutional and concentrated in a small number of large holders — Capital International Investors at 13.9%, JPMorgan at 10.8%, BlackRock at 10.3%, and a Vanguard position of 10.2% that was subsequently disaggregated following an internal reorganisation at that firm.16 Insider ownership is modest: O'Sullivan beneficially held 466,285 shares as of March 25, 2026, of which 322,218 were exercisable options, and all directors and executive officers together held 1.3% of shares outstanding.16 This is a professionally managed company, not a founder-aligned one, and investors should price the incentives accordingly.
Where the cash actually goes. Now the uncomfortable part, and it is the single most important thing in this section.
In fiscal 2025 Burlington generated $1.23 billion of cash from operations and spent $1.06 billion on property and equipment, leaving about $172 million of free cash flow. In fiscal 2024 it generated $863 million and spent $892 million, producing free cash flow of roughly negative $29 million.4 Over those same two years it repurchased approximately $278 million and $256 million of its own stock respectively — and increased net borrowings by roughly $323 million and $303 million.4
The conclusion is straightforward and should be stated plainly: Burlington's share repurchases over the past two years have not been funded by free cash flow, because there has not been meaningful free cash flow. They have been funded by the balance sheet, while essentially all operating cash flow went into the store and distribution-centre build-out. Management has been transparent about the capital programme — fiscal 2026 capital expenditure guidance is approximately $875 million net of landlord allowances, against depreciation of roughly $465 million, which tells you plainly that this is a growth investment, not maintenance.3
Whether that is good or bad depends entirely on whether the growth capital earns its cost, which brings the conversation back to new-store payback. If new stores really do return their investment in under two years, spending every dollar of operating cash flow on them is close to the highest-return use of capital available, and modest borrowing to smooth the buyback is defensible. If they do not, the company is levering up to retire shares while consuming cash. This is precisely the question an activist would press, and it is the reason the absence of a return-on-capital metric in the incentive plan matters.
The balance sheet itself is not the constraint. Burlington ended fiscal 2025 with $2.08 billion of funded debt — a $1.72 billion term loan and $297 million of convertible notes, with nothing drawn on its asset-based facility — against $1.23 billion of cash and total liquidity of $2.16 billion.3 Net funded debt of roughly $850 million against EBITDA above $1.3 billion is well under one turn, before the very large operating lease obligations that any store retailer carries. During fiscal 2025 the company retired its maturing 2025 convertible notes, upsized the term loan to $1.744 billion in June, and extended and upsized its revolving facility to $1.0 billion in July.16 It pays no dividend. By the end of the second quarter of fiscal 2026 it had repurchased $167 million of stock year-to-date with $218 million remaining on an authorisation that expires in May 2027.1
A company with this much financial flexibility and this little insider ownership will be judged on execution alone. So it is worth putting the execution claims on trial.
IX. The Historical Falsification Layer: Testing Burlington's Core Claims
Three propositions, one record.
Burlington's investment case rests on three load-bearing propositions. Each has been tested by the company's recent operational performance, and the historical record provides mixed support across all three.
Claim 1: Burlington 2.0 can structurally lift operating margin from 8% toward the 10% to 12% range where Ross and TJX operate.
The supporting evidence is recent and tangible. Adjusted operating margin expanded 100 basis points in fiscal 2024 and 80 basis points in fiscal 2025 to 8.0%, followed by another 100-basis-point expansion in the second quarter of fiscal 2026—achieved despite modest comparable store sales growth of just 2%, a point management highlighted to demonstrate operational leverage.31 The underlying drivers are verifiable: supply chain productivity gains, selling, general, and administrative expense leverage across store payroll and occupancy, and disciplined merchandise pricing.
Countering that progress is historical evidence from the same executive team executing the same strategy.
In fiscal 2022, total sales fell 7%, comparable store sales dropped 13%, and adjusted operating income dropped 46% to $430 million—contracting adjusted operating margin by 370 basis points to roughly 4.9% in a single year.23 The margin compression was widespread: merchandise margin declined by 110 basis points, product sourcing costs deleveraged by 120 basis points, and adjusted selling, general, and administrative expenses deleveraged by 110 basis points.24 On the corresponding earnings call, Chief Financial Officer Kristin Wolfe noted that fourth-quarter operating margin stood 340 basis points below equivalent 2019 levels, attributing the decline entirely to supply chain and freight cost pressures.24
That downturn reflected both macroeconomic headwinds and internal operational missteps. While rising freight rates and inflation constrained lower-income consumers across retail, Chief Executive Officer Michael O'Sullivan acknowledged execution errors, stating that poor execution in 2022 hurt performance and produced comparable sales growth that was significantly inferior to off-price peers.24 Though industry competitors faced identical cost pressures, Burlington suffered disproportionate margin compression.
Verdict: narrowed, not rejected. Three consecutive years of margin expansion confirm that operational efficiencies are real and quantifiable. However, the record demonstrates that Burlington's operating margin remains more sensitive to unit-cost inflation than peer margins, largely due to its lower average price points. Furthermore, the retailer has never sustained a full-year operating margin above 9% in its modern history. Consequently, the realistic outlook is that Burlington can expand margins into the high single digits—and potentially touch 10% during periods of low cost inflation—rather than fully converging with TJX. The critical test moving forward is whether operating margins can expand during periods of rising freight and fuel costs. With freight deleveraging 10 basis points in the second quarter of fiscal 2026 due to higher fuel costs and guidance reflecting continued freight pressure in the second half of the year, that test is already underway.12
Claim 2: exiting e-commerce was a masterstroke of counter-positioning.
The strategic rationale remains sound. Low average unit retail prices make e-commerce economics challenging, competitors have not gained measurable market share from Burlington's departure, and annual sales have roughly doubled in the six years following the site closure.
The immediate consequence, however, highlighted significant risk management vulnerabilities. When physical stores closed during early 2020 lockdowns, the absence of a digital channel left revenue at zero, forcing severe inventory markdowns and driving substantial net losses.19 To maintain liquidity, the company completed a $1.1 billion emergency financing in April 2020, issuing $805 million in convertible senior notes—an expensive capital structure that diluted equity value during a market downturn.19 The financial tail of that transaction extended into fiscal 2026, when Burlington settled $111 million of convertible principal for $129 million in cash plus 150,831 newly issued shares.20
Verdict: intact on economics, rejected as risk management. Shifting entirely to physical stores made strategic sense, but the company's 2020 balance sheet lacked sufficient cushion, resulting in permanent shareholder dilution from a temporary crisis. Management appears to have addressed this vulnerability by maintaining over $1.6 billion in liquidity and an undrawn credit facility alongside expansion investments.1 The ongoing test for the store-only strategy is whether sales productivity per square foot continues to rise as smaller prototype stores replace legacy locations, proving that physical retail alone can sustain long-term growth.
Claim 3: buying leases out of bankruptcy delivers cheap, frictionless expansion.
The execution record offers clear benefits. Burlington acquired nearly half the available leases at the Bed Bath & Beyond auction and opened 178 gross new stores in the twelve months preceding the second quarter of fiscal 2026—the fastest annualized opening pace in company history—while maintaining target opening schedules, staffing experienced store teams, and meeting initial sales projections.2
Financial disclosures, however, reveal meaningful hidden costs. Burlington has excluded bankruptcy-acquired lease expenses from adjusted results each year since fiscal 2023, with costs reaching $35 million in fiscal 2025 before moderating to a projected $16 million in fiscal 2026.31 Cumulatively, these adjustments represent approximately $85 million in cash outlays for carrying costs on unoccupied properties prior to store openings. Furthermore, structural challenges persist across the broader store fleet: despite a decade of footprint downsizing, the average store size remains well above management's prototype target, while store relocations and downsizes advance gradually at roughly 18 relocations and 20 downsizes per year.21 Second-generation retail space yields cost savings only when locations match prototype size and market requirements; historical performance shows the operational drag when they do not.
Verdict: intact but conditional, and the condition is disclosure. Recent lease acquisitions align closely with target store sizes and perform well. However, investors should monitor the bankruptcy lease adjustment line as an ongoing operational cost: if these expenses remain elevated as openings proceed, real estate friction represents a structural cost rather than a temporary transition.
A fourth claim also merits examination because management highlights it frequently: Burlington can convert modest comparable store sales growth into outsized earnings growth indefinitely. Expanding adjusted earnings per share at double-digit rates for fifteen consecutive quarters represents a strong operational record.1 Yet the composition of sales growth warrants attention. In the second quarter of fiscal 2026, comparable store sales growth was driven primarily by larger average customer spending per transaction, while total customer transactions were roughly flat against the prior year.2 Raising transaction values improves unit profitability, but it differs fundamentally from expanding customer traffic. Relying on higher basket sizes without expanding customer volume presents a key long-term constraint on growth.
X. Playbook: Business & Strategic Powers
The seven powers, honestly counted.
Stripping away the narrative raises the fundamental strategic question: what prevents a competitor from replicating this business model? Hamilton Helmer’s competitive strategy framework is illuminating here primarily because of how many of its seven structural powers Burlington lacks.
Counter-positioning — real, but not against direct peers. The classic counter-positioning thesis holds that full-price department stores cannot match off-price pricing without undermining their existing business models. That dynamic remains durable: traditional department stores like Macy's and Kohl's cannot permanently cut prices 20% to 60% below list price without vaporizing the reference prices that support their margin structures, vendor agreements, and promotional calendars. Similar economics constrain online marketplaces at Burlington's price point; fulfillment and return costs undermine profitability on a twelve-dollar item, explaining why management shuttered its e-commerce platform rather than subsidize loss-making transactions.
However, counter-positioning provides protection only against incumbents incapable of responding. Burlington’s principal competitors share an identical off-price model, greater scale, and longer track records of systems optimization. Against TJX and Ross Stores, Burlington possesses no counter-positioning advantage; it operates as a smaller competitor utilizing the same business model.
Scale economies — genuine, but asymmetric. The vendor networks, distribution capacity, and inventory absorption capacity required to serve as a primary buyer for overstock apparel create substantial entry barriers, insulating off-price retailers from regional discounters. Yet scale remains a relative advantage: Burlington’s annual revenue represents roughly one-fifth of TJX’s and half of Ross Stores’. While Burlington benefits from the industry's collective scale barrier, larger peers capture the primary structural advantages.
Process power — plausible, but unproven. Opportunistic buying discipline, reserve-inventory management, and upgraded merchandise planning systems reflect complex organizational capabilities that take time to build. Off-price merchandising functions as a specialized discipline requiring buyers to balance cash reserves, evaluate non-standard size lots, and construct cohesive store assortments from irregular inventory receipts. Burlington has sought to build this capability in part by recruiting executive and buying talent from Ross Stores and TJX.
Demonstrated process power typically manifests as sustained operational superiority, whereas Burlington remains in a catch-up phase relative to industry leaders. Chief Executive Officer Michael O'Sullivan acknowledged this gap when describing store-level localization, noting it as a capability long established at mature peers where Burlington remains "a long, long way behind."21 Investors interpret this gap in two ways: optimists view uncaptured efficiencies as operational upside, while skeptics view the disparity as evidence that process advantages remain anchored at larger competitors.
Absent powers. Burlington possesses no customer switching costs; consumers transition between off-price stores without friction. The business generates no network effects and holds no cornered resources, lacking exclusive supply agreements or proprietary brand equity. Furthermore, while brand awareness serves as an asset for TJX, Burlington’s legacy name historically tied consumer perception to outerwear—a category accounting for just 3% of current sales.
Porter's five forces, applied honestly.
Threat of new entrants: low. Scale requirements, logistics infrastructure, and established vendor relationships create steep barriers to entry, preventing subscale challengers from establishing a national presence.
Supplier power: low to moderate. Apparel manufacturers rely on off-price channels to clear surplus inventory discreetly, and Burlington mitigates concentration risk by ensuring no single vendor accounts for more than 5% of total purchases.4 However, supplier power fluctuates cyclically: during periods of tight inventory control, reduced manufacturing overruns decrease available merchandise. Although management described the buying environment as favorable with abundant merchandise across most categories, that availability reflects cyclical market conditions rather than a permanent structural advantage.21
Buyer power: high. Target consumers face no switching costs and exhibit high price sensitivity, constraining retail pricing flexibility. This customer demographic explains management’s strategic decision to pass the $55 million tariff refund entirely to consumers via price reductions rather than retaining the windfall as net profit.
Threat of substitutes: moderate and evolving. Ultra-low-cost digital platforms target value-conscious consumers with unbranded merchandise delivered directly, contrasting with off-price retail's offer of branded merchandise available immediately in physical stores. Off-price retailers rely on brand recognition to differentiate their inventory from generic merchandise, though changing consumer preferences toward unbranded apparel could weaken that defense.
Competitive rivalry: high, and intensifying in a specific place. Competition among off-price retailers focuses on store site selection and inventory access rather than direct price wars, as opportunistic sourcing maintains similar cost structures across chains. However, as Burlington, TJX, and Ross Stores increasingly target identical 25,000-square-foot strip-center locations, competition for prime real estate and premium vendor inventory continues to intensify.
The verdict on the moat.
Burlington operates within a structurally attractive, consolidated industry without holding a dominant competitive moat of its own. Enterprise returns depend on operational execution within a protected retail sector rather than self-sustaining structural advantages. While execution-led growth can generate attractive financial returns—mirroring Ross Stores’ trajectory during the 1990s—it leaves the investment case dependent on sustained management execution rather than an enduring competitive barrier.
XI. The Investment Spine: Bull vs. Bear Case & Key KPIs
Why Burlington wins from here.
The bull case rests on three core pillars, beginning with the company's physical expansion footprint. Burlington operated 1,287 stores at the end of the second quarter of fiscal 2026 against a stated long-term target of 2,000, with management expressing confidence in opening at least 110 net new stores annually and reaching or exceeding 1,500 stores by the end of 2028.24 Unlike speculative retail projections that rely on shifting consumer behavior, this expansion reflects an established real estate pipeline that management describes as already built for 2027 and maturing nicely for 2028.2 Assuming new stores maintain first-year sales above $7 million with sub-two-year payback periods, adding 110 locations per year to a 1,287-store fleet generates roughly 8% to 9% annual top-line sales growth before accounting for single-store sales gains.
The second pillar centers on internal margin expansion. A multi-hundred-basis-point operating margin gap separates Burlington from Ross Stores, and Burlington's margin gains to date have stemmed entirely from operational self-help: distribution productivity, occupancy leverage from smaller store footprints, inventory shrink control, and ongoing merchandising system upgrades. Store-level localization has yet to contribute meaningfully to earnings, despite driving sales productivity at mature peers. Chief Financial Officer Kristin Wolfe outlined a baseline operational rule of thumb: achieving roughly 20 basis points of selling, general, and administrative expense leverage at a 3% comparable store sales increase, with an additional 10 to 15 basis points of leverage for every percentage point of comparable sales growth above that threshold.21 Empirical performance over the past three years supports that formula.
The third pillar involves customer demographic resilience. Through fiscal 2025 and into fiscal 2026, Burlington locations in lower-income trade areas consistently generated comparable store sales growth above the chain average—a trend management emphasized across consecutive earnings calls.221 Rather than confirming bear-case assumptions of severe lower-income consumer weakness, operational data demonstrates sustained spending across core value-oriented customer cohorts.
What breaks the case.
Conversely, several operational headwinds complicate the outlook, starting with slowing comparable store sales. Comparable sales growth decelerated from 6% in the first quarter of fiscal 2026 to 2% in the second quarter—a sharp drop where store cannibalization from rapid new openings accounted for roughly half a percentage point of the slowdown and softening demand explained the remainder.201 Within that 2% figure, total customer transaction counts remained essentially flat.2 Relying primarily on higher average transaction values to drive revenue in a value-focused retail model introduces clear volume constraints over time.
Second, executive commentary turned distinctly more cautious over the course of fiscal 2026. In March 2026, O'Sullivan described himself as "bullish," noting the word fell outside his typical vocabulary; by August, he characterized sector-wide second-quarter comparable sales as "underwhelming even at large value-oriented retailers," pointing to persistent fuel price pressures following a spring spike and declining to raise second-half sales targets despite reinvesting $55 million from tariff refunds into lower consumer prices.212 While conservative guidance protects management credibility, a policy of maintaining low targets to capture potential upside makes distinguishing prudent planning from underlying operational deceleration difficult for outside investors.
Third, seasonal revenue exposure remains an ongoing vulnerability. Addressing forecasts for a strong El Niño and an unseasonably warm autumn, O'Sullivan acknowledged that Burlington retains greater weather sensitivity than off-price peers, particularly during the third quarter, when warm temperatures from late September through November depress high-margin outerwear sales.2 Although management planned lower outerwear inventory while expanding weather-neutral categories for the second half—and leveraged localization systems to direct heavier items toward colder markets—leadership noted that these adjustments do not completely eliminate seasonal weather risk.2 Despite category diversification away from coats, autumn weather conditions remain a material variable for quarterly performance.
Fourth, capital allocation and executive incentive alignment warrant scrutiny. A rigorous financial review highlights four structural concerns: share repurchases funded through net debt issuance rather than free cash flow while capital expenditures absorb operating cash; executive incentive metrics tied to adjusted operating profit without return-on-capital or comparable sales hurdles; the systematic exclusion of cash lease-acquisition expenses from performance metrics; and a fiscal 2023 performance-share grant that paid out at the 200% maximum, indicating that the initial three-year EPS growth target of 13.3% was set conservatively relative to internal expectations.164 While common in corporate governance, these structures align executive compensation primarily with debt-funded earnings per share growth rather than total return on capital.
Fifth, macroeconomic and trade policy risks exert direct pressure on results. Tariff implementations reduced fiscal 2025 sales, produced a fiscal 2026 refund earmarked entirely for price reinvestment, and persist as an indirect inflationary pressure on consumer spending.41 Company regulatory filings explicitly note that sustained inflation disproportionately strains Burlington's core lower-income customer base, while moderating inflation or a broader economic slowdown could drive trade-down traffic from higher-income households.4 Consequently, performance remains sensitive to macroeconomic shifts in household discretionary income.
The three KPIs that matter.
First, comparable store sales—analyzed via two-year stacked growth, cannibalization adjustments, and the split between customer traffic and average order value. This metric isolates organic demand growth across existing locations. Investors must monitor customer transaction volume, as sustainable growth requires expanding customer traffic rather than relying solely on basket-size increases.
Second, annualized adjusted operating margin expansion, evaluated against freight and logistics cost cycles. Burlington achieved consecutive margin gains of 100 basis points in fiscal 2024, 80 basis points in fiscal 2025, and 100 basis points in the second quarter of fiscal 2026. The key risk metric is margin compression during periods of rising transportation costs, as demonstrated during fiscal 2022.
Third, new store first-year sales productivity and payback duration. The corporate expansion model assumes that 27,000-square-foot prototype stores generate over $7 million in year-one revenue and achieve full capital payback within two years. Any downward trend in new-store productivity as expansion enters secondary markets would alter unit economics and undermine the justification for allocating all operating cash flow toward fleet expansion.
XII. Recent News, Earnings Call Analysis & Transcript Guide
Two quarters, two consumers.
The two most recent quarters offer an instructive contrast, illustrating how management narrated markedly different demand environments while delivering broadly consistent bottom-line results.
In the first quarter of fiscal 2026, reported on May 28, total sales increased 14% to $2.85 billion, while comparable store sales rose 6%—substantially exceeding the guided range of 2% to 4%. Gross margin expanded by 30 basis points, adjusted earnings per share grew 26% to $2.10, and management raised full-year targets by passing through the full quarterly beat.20 These results validated the optimistic outlook Chief Executive Officer Michael O'Sullivan offered earlier that spring.
In the second quarter, reported on August 27, sales grew 11% to $3.00 billion, though comparable store sales decelerated to 2%.1 Adjusted earnings per share rose 38%, prompting management to raise full-year adjusted EPS guidance to between $11.77 and $11.97—representing 16% to 18% growth—alongside full-year comparable sales guidance of 3% to 4%.1 Beneath those headline numbers, management deliberately lowered its back-half projections. Third-quarter adjusted EPS is guided to $1.60 to $1.70, down from $1.80 a year earlier, with operating margins projected to shrink by 60 to 80 basis points due entirely to reinvesting the $55 million tariff refund into lower customer prices; excluding that reinvestment, fall guidance remained unchanged from May.12 Management allocated roughly 40% of the price reinvestment to the third quarter and 60% to the fourth.2
Under the hood of the most recent quarter.
Several operational details from the second-quarter earnings call provide valuable context for the second half of the year. The home business—which contracted a year earlier following a deliberate tariff-related pullback—outperformed the chain average in July and August, representing a key recovery heading into the gift-heavy fourth quarter.2 Regionally, the Northeast and Midwest outperformed, while the Southwest lagged behind.2 Beauty and accessories generated the strongest category gains.2 Comparable store inventory ended the quarter up 11%, a surge Chief Financial Officer Kristin Wolfe attributed to lapping the prior year's home curtailment, accelerating back-to-school receipts into late July, and targeted investments in high-velocity inventory.2 Management expects no further material tariff refunds.2
Myth versus reality.
Three common consensus narratives regarding Burlington warrant careful examination against operational evidence.
The first premise asserts that Burlington remains primarily a coat retailer. Outerwear now represents a minor fraction of overall sales, heavily surpassed by accessories, footwear, and home goods. Nevertheless, seasonal vulnerability persists: management acknowledges that third-quarter performance remains more weather-sensitive than that of peer discounters. Consequently, weather sensitivity has been reduced rather than eliminated, while public brand perception changes slowly.
The second premise suggests Burlington suffers disproportionately from low-income consumer stress. Trade-area disclosures consistently demonstrate the opposite: locations in lower-income demographic zones have delivered comparable sales growth above the chain average during both expansionary and softer quarters. The empirical record indicates that value-seeking consumers are allocating household budgets carefully—shopping at Burlington and purchasing slightly larger baskets per visit, even if store transaction counts remain flat.
The third premise holds that operating without an e-commerce platform inevitably surrenders market share to digital competitors. Aggregate figures from the past six years counter this assumption, as total sales nearly doubled following the website closure. The central analytical question concerns traffic composition rather than digital market-share loss, and a single quarter of flat transaction volume remains an isolated data point rather than a definitive trend.
What is not disclosed.
Assessing public disclosures requires identifying key metrics missing from company filings. Burlington does not publish average unit retail figures, store-level sales per square foot, store-level EBITDA, store-level return on invested capital, or vendor counts. While filings provide first-year sales targets and estimated payback periods for new store prototypes—alongside total and selling square footage from which general productivity can be calculated—specific store-level return metrics are omitted. Given that management's expansion thesis relies on new-store productivity, this omission represents a notable gap for a company allocating nearly $900 million annually to capital expenditures.3
Public equity markets have reacted cautiously to these financial disclosures. Despite fifteen consecutive quarters of double-digit earnings growth, Burlington's stock has traded below its 52-week peak, maintaining a market capitalization of approximately $16 billion.7 This valuation disparity reflects market debate over whether flat customer traffic and slowing comparable sales outweigh recent earnings beats, or if investors anticipate diminishing returns from margin expansion levers.
A guide to the primary material.
Four specific earnings calls contain the primary operational data for evaluating Burlington's strategy. The March 5, 2026 fourth-quarter call offers extensive detail, outlining the 2025 tariff response that prioritized margins over volume, acknowledging gaps in store localization capabilities, detailing store relocation and downsizing initiatives, and explaining the rationale behind raised sales guidance.21 The August 27, 2026 second-quarter call provides clear insight into prevailing consumer behavior, autumn weather exposure, and tariff-refund price reinvestment strategy.2 The March 2, 2023 fourth-quarter call serves as an essential reference, containing management's detailed breakdown of severe operational headwinds during fiscal 2022.24 Finally, the May 28, 2020 release and earnings call document the operational consequences of store closures on a physical-only discount retailer.19
Analyst inquiries during quarterly calls highlight key ongoing debates. Analysts Matthew Boss of JPMorgan and Ike Boruchow of Wells Fargo consistently probe the sustainability of margin expansion during periods of low comparable sales growth. Lorraine Hutchinson of Bank of America focuses on consumer health and inventory management. Dana Telsey analyzes new-store sales productivity and market cannibalization, while Mark Altschwager of Baird evaluates seasonal weather impacts and the balance between customer traffic and basket size.221 These core operational factors—margin quality, consumer demand, store productivity, and transaction composition—will determine whether Burlington's recent financial gains represent a permanent structural re-rating or a temporary operational recovery.
References
-
Burlington Stores, Inc. Reports Second Quarter Fiscal 2026 Results (Form 8-K, Exhibit 99.1) — SEC EDGAR, 2026-08-27 ↩↩↩↩↩↩↩↩↩↩↩↩↩↩↩↩↩
-
Burlington Stores Second Quarter Fiscal 2026 Earnings Conference Call — Burlington Stores Investor Relations, 2026-08-27 ↩↩↩↩↩↩↩↩↩↩↩↩↩↩↩↩↩↩↩↩↩↩↩↩↩↩
-
Burlington Stores, Inc. Reports Fourth Quarter and Full Year 2025 Earnings (Form 8-K, Exhibit 99.1) — SEC EDGAR, 2026-03-05 ↩↩↩↩↩↩↩↩↩↩↩↩↩
-
Burlington Stores, Inc. Form 10-K for the fiscal year ended January 31, 2026 — SEC EDGAR, 2026-03-19 ↩↩↩↩↩↩↩↩↩↩↩↩↩↩↩↩↩↩↩↩
-
The TJX Companies, Inc. Reports Q4 and Full Year FY26 Results (Form 8-K) — SEC EDGAR, 2026-02-25 ↩↩
-
Ross Stores, Inc. 2025 Annual Report (Form ARS) — SEC EDGAR, 2026 ↩↩
-
Burlington Stores Inc. Market Data and Quotes — The Wall Street Journal ↩↩
-
Monroe Milsten, Founder of Burlington Coat Factory, Dies at 98 — The Algemeiner, 2025-05-28 ↩↩↩↩↩
-
Rags to riches in the rag trade — Family Business Magazine ↩↩↩↩↩↩↩↩
-
History of Burlington Coat Factory Warehouse Corporation — FundingUniverse ↩↩↩
-
Burlington Coat Factory Warehouse Corp. — International Directory of Company Histories, via Encyclopedia.com ↩↩↩↩↩↩
-
Bain Capital Completes the Purchase of Burlington Coat Factory (Form 8-K, Exhibit 99.1) — SEC EDGAR, 2006-04-13 ↩↩↩↩
-
Burlington Coat Factory Warehouse Corporation Form 10-K for the fiscal year ended February 2, 2013 — SEC EDGAR, 2013-04-25 ↩↩↩↩
-
Burlington Stores, Inc. Form 424B4 (IPO Prospectus) — SEC EDGAR, 2013-10-02 ↩
-
Burlington Stores shares climb in market debut — Associated Press via KSL, 2013-10-02 ↩↩↩
-
Burlington Stores, Inc. 2026 Proxy Statement (Form DEF 14A) — SEC EDGAR, 2026-04-02 ↩↩↩↩↩↩↩↩↩↩↩↩↩↩↩↩↩↩
-
Burlington Stores, Inc. 2020 Proxy Statement (Form DEF 14A) — SEC EDGAR, 2020-04-03 ↩↩
-
Burlington exits e-commerce to focus on brick and mortar — Retail Dive, 2020-03-06 ↩↩
-
Burlington Stores, Inc. Reports First Quarter 2020 Earnings (Form 8-K, Exhibit 99.1) — SEC EDGAR, 2020-05-28 ↩↩↩↩↩
-
Burlington Stores Reports Strong First Quarter Sales and Earnings Growth (Form 8-K, Exhibit 99.1) — SEC EDGAR, 2026-05-28 ↩↩↩↩
-
Burlington Stores Fourth Quarter Fiscal 2025 Earnings Conference Call — Burlington Stores Investor Relations, 2026-03-05 ↩↩↩↩↩↩↩↩↩↩↩↩↩↩
-
Burlington scoops up Bed Bath & Beyond leases for $13.5M — NJBIZ, 2023-07-05 ↩
-
Burlington Stores, Inc. Reports Fourth Quarter 2022 Results (Form 8-K, Exhibit 99.1) — SEC EDGAR, 2023-03-02 ↩
-
Burlington Stores Fourth Quarter Fiscal 2022 Earnings Conference Call — Burlington Stores Investor Relations, 2023-03-02 ↩↩↩↩
 LinkedIn
 WhatsApp
 Reddit
 Hacker News
 Email
Email Kindle
 RSS Feed
 Spotify
 Apple Podcasts
 Amazon Music
 Audible
 YouTube