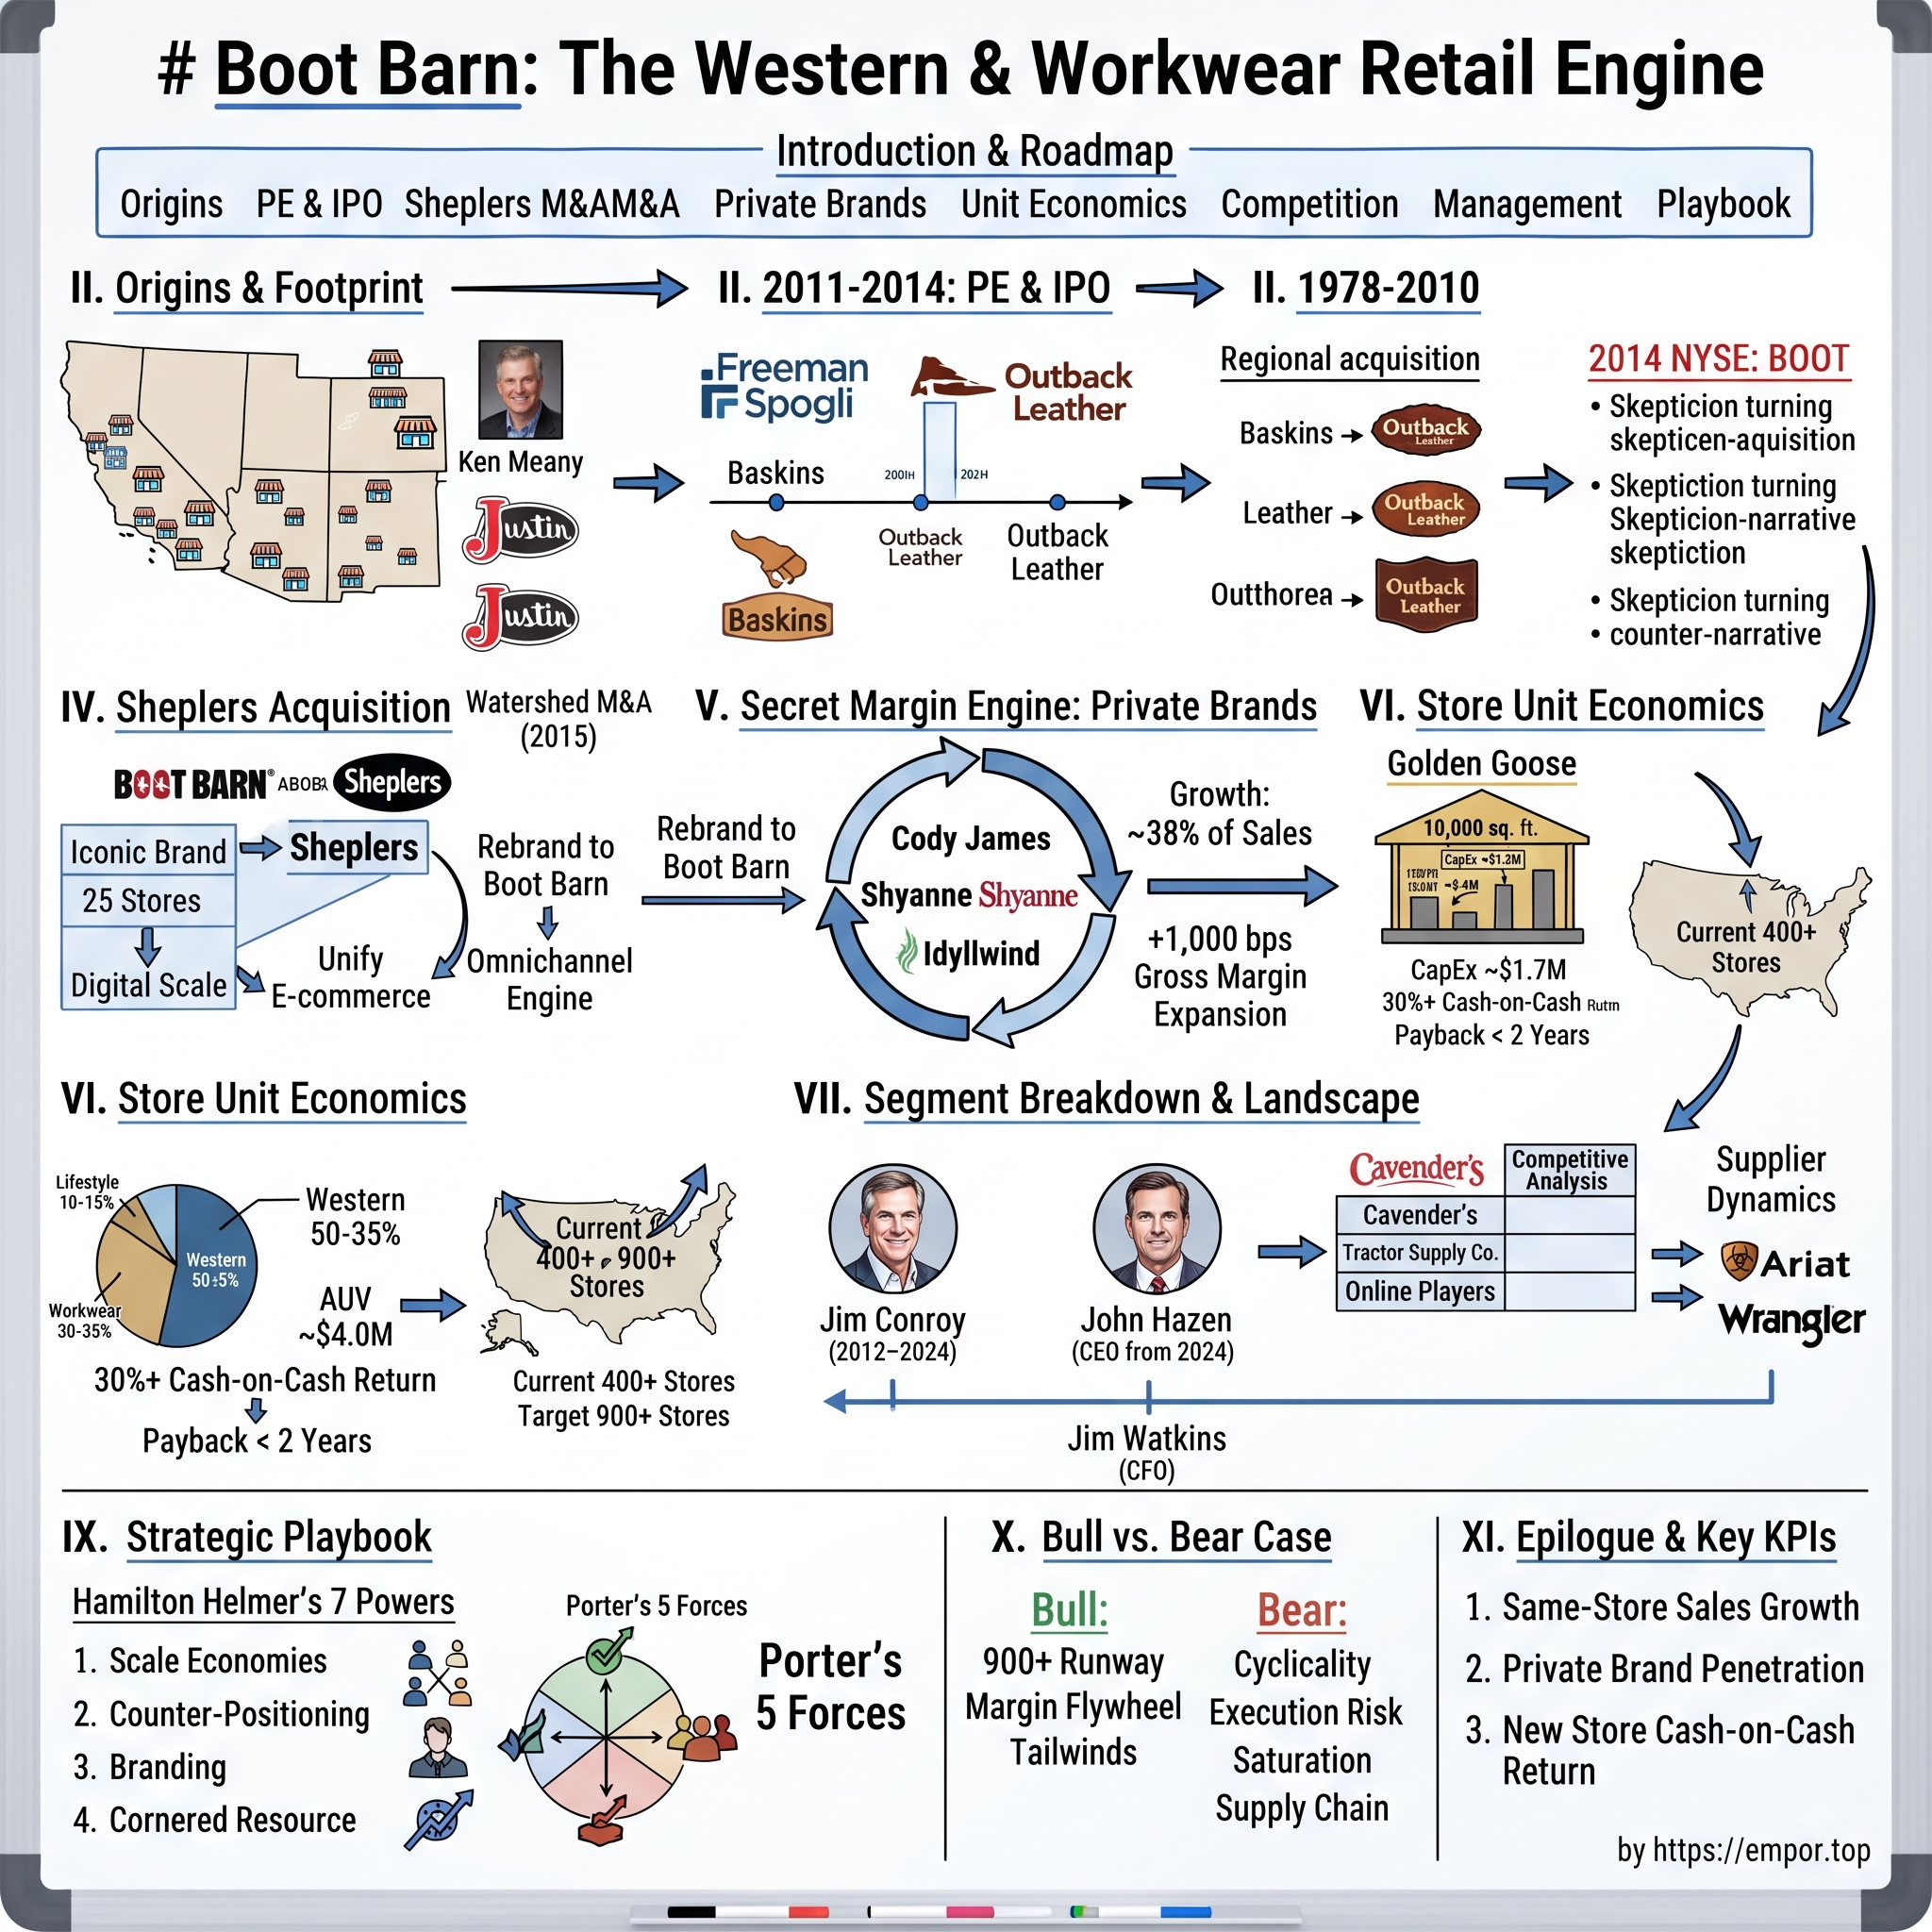
Boot Barn: The Western & Workwear Retail Engine
I. Introduction & Episode Roadmap
Walk into a Boot Barn on a Saturday afternoon in Lubbock, Texas, or Bethlehem, Pennsylvania, and the first thing that strikes a visitor is not the merchandise. It is the smell — leather, in industrial quantities. The second is the geometry. Roughly a third of the selling floor is dedicated to boots, stacked on self-service fixtures six shelves high, arranged not by brand or fashion narrative, but by category, gender, and size.1 There is no boot wall behind a counter and no salesperson guarding the inventory. Shoppers locate their size, sit down, and try them on.
That layout is a strategic statement disguised as a merchandising choice. It signals that Boot Barn is not a fashion retailer, but a functional destination where a working electrician can buy a composite-toe boot on a lunch break and a rodeo mother can buy her daughter's first pair of Shyanne boots on the same trip, from the same rack system, within the same 11,400 square feet of selling space.1
The financial metrics supporting that floor plan stand out in modern specialty retail. For the fiscal year ended March 28, 2026, Boot Barn Holdings generated $2.25 billion in net sales, an increase of 17.9% year over year, driven by a 7.2% gain in same-store sales. Net income rose 25% from the prior year to $225.9 million, or $7.35 per diluted share. The company opened a record 80 new stores during the fiscal year, reaching 539 locations across 49 states.12 By the end of its first quarter of fiscal 2027 in late June 2026, the total footprint had expanded to 566 stores.3
That performance places Boot Barn in rare company: a $2.25 billion physical retailer expanding revenue at nearly 18%, operating with a 13.3% operating margin and zero net debt, while compounding its store base in the low-to-mid teens. In a decade expected to be dominated by digital marketplaces and asset-light brands, Boot Barn grew by building brick-and-mortar stores.
The thesis worth testing. Management presents a straightforward narrative: Boot Barn is the sole national specialty retailer in a large, fragmented market; new stores quickly generate high cash returns on investment across diverse geographies; and a portfolio of exclusive in-house brands — including Cody James, Shyanne, Hawx, and Idyllwind — structurally expands merchandise margins as it approaches half of total sales. Combined, these dynamics are framed as a self-funding growth engine with a long expansion runway.
Much of that narrative is supported by disclosed data, but key elements warrant scrutiny. Management walked back its exclusive-brand penetration target within a single quarter. The store-level payback timeline cited on earnings calls is materially more aggressive than the assumptions disclosed in the company's Form 10-K filings. Occupancy costs have deleveraged, raising the required sales threshold to maintain margins. Furthermore, a substantial portion of reported earnings growth in fiscal 2027 stems from legal tariff refunds rather than core operations. Finally, the model has yet to be tested through a severe construction and energy downturn at its current retail scale.
The roadmap. This analysis proceeds in eleven movements: the company's unlikely origins in Orange County, California; the private-equity decade that transformed a regional chain into an institutional retailer; the 2015 acquisition of Sheplers that eliminated Boot Barn's primary national competitor and reshaped its e-commerce unit economics; the exclusive-brand engine driving gross margin expansion; the store model evaluated against regulatory filings rather than presentation slides; the category, channel, and vendor dynamics; the executive transition from a twelve-year CEO to his former chief digital officer; a strategic assessment using Hamilton Helmer's 7 Powers and Porter's Five Forces; a bull-versus-bear stress test built from an institutional investor's perspective; and the key operational metrics that signal the business's ongoing trajectory.
Trading at approximately $164 per share in early August 2026 with a market capitalization near $5 billion, the stock has moved between $133 and $210 over the prior twelve months.4 That trading range captures the central investment debate: Boot Barn has delivered consistently strong operating results, but its valuation prices in a decade of uninterrupted store expansion. Both aspects of that equation require rigorous evaluation.
The story begins in an unexpected location: a southern California beach town.
 Subscribe on LinkedIn
II. Origins & The Western Retail Footprint (1978–2010)
Huntington Beach, California, in 1978 was not cowboy country. It was surf country — Pacific Coast Highway, board shops, and oil derricks nodding on the bluffs. It was also where Ken Meany opened the first Boot Barn.5
The location was less eccentric than it sounded. Orange County in the late 1970s sat at the intersection of suburban Southern California and a working agricultural and industrial economy extending east and north: the citrus and dairy operations of the Inland Empire, the oilfields of Kern County, the equestrian culture of the Santa Ynez and Santa Clarita valleys, and an expanding workforce of construction trades building out the suburbs. Those customers needed two distinct items: durable work boots and Western wear signaling cultural identity. Meany recognized that a single storefront could serve both needs, serving the same customer on different days.
That dual positioning — combining workwear and Western apparel under one roof — established a foundational business model. Boot Barn avoided choosing between selling cultural identity and utility products, which follow distinct demand dynamics. Western apparel and boots represent discretionary cultural purchases with strong brand affinity and multi-year product cycles. Work boots and flame-resistant clothing function more like consumables: they experience regular wear and tear and are mandated by workplace safety regulation in many trades.1 The Western side provides brand affinity and pricing power, while the workwear side delivers repeatable replacement cycles insulated from broader consumer sentiment.
The slow decades
For its first thirty years, Boot Barn expanded through traditional independent retail methods: signing individual leases funded by cash flow, primarily within California and the Southwest. Meany and his son Patrick expanded the chain to 32 stores before selling a majority stake in 2007 to Marwit Capital Partners, a Newport Beach private equity firm.5
A footprint of 32 stores over 29 years represented an average growth rate of roughly one location per year. That pace indicates expansion was constrained by operational infrastructure rather than market demand. Operating store by store without a centralized replenishment system, internal product development teams, or direct overseas sourcing capabilities, the business lacked the systems required for rapid scaling. Each store opening functioned as an isolated project.
What the company accumulated during this period was supplier equity that proved difficult to replicate: long-standing relationships with legacy bootmakers. Key Western brands — including Justin, Tony Lama, Laredo, Dan Post, Resistol, Stetson, Wrangler, and later Ariat — operate selective distribution models, allocating limited-edition runs and premium leathers to favored accounts. Boot Barn spent three decades establishing itself as a primary distribution partner for those manufacturers. By fiscal 2026, the company's three largest suppliers still accounted for roughly 25% of net sales.1 That vendor concentration presents ongoing supply-chain risks alongside its channel advantages, a dynamic examined in subsequent sections.
Why this category resists disruption
Three structural factors explain why specialized boot retailing maintained resilience during a period of widespread e-commerce disruption across broader apparel retail.
First, fit requirements. A $250 leather Western boot presents complex sizing variables — including toe profile, instep fit, shaft height, and break-in behavior. Incorrect sizing leads to high return rates and customer dissatisfaction, creating friction for online-only sellers. Boot Barn's regulatory disclosures highlight this dynamic, noting that customers frequently browse online and then visit physical stores to ensure a proper fit.1
Second, style permanence. In fiscal 2026, management noted that the majority of top-selling styles in stores had been in the assortment for more than five years.2 This stability provides significant operational benefits, allowing the majority of inventory to run on automated replenishment systems driven by real-time point-of-sale data rather than being bought on speculative fashion bets.1 Consequently, inventory markdown risk remains lower than in traditional apparel retail.
Third, regulatory demand drivers. Safety-toe footwear, flame-resistant clothing, and high-visibility apparel represent mandatory expenditures for industrial workers. Workplace safety standards drive predictable product replacement cycles, which Boot Barn's filings name it as a demand driver.1
The scale wall
By 2011, Boot Barn had expanded to roughly 85 stores in eight states.6 Although it represented the largest specialty chain in its category, it functioned fundamentally as a regional retailer backed by legacy family-business infrastructure. It lacked proprietary brand development, digital capabilities, and distribution logistics capable of supporting national footprint expansion.
While the company had established the viability of its store model, it had not yet demonstrated that the format could scale nationally. Transitioning to systematic multi-state expansion required upfront investments in corporate infrastructure, distribution capacity, and executive management — initiating the private-equity phase of its corporate development.
III. The PE Buyout, Management Transformation & 2014 IPO
In 2011, Freeman Spogli & Co. — a Los Angeles private equity firm with a history in consumer and specialty retail — acquired Boot Barn from Marwit Capital Partners, taking an 89.1% stake in a business of roughly 85 stores across eight states with a nascent e-commerce site.6
What unfolded over the next three years illustrates a classic operational private-equity playbook, replacing regional family-style management with institutional retail systems.
Hiring a merchant-operator, not a financier
In 2012, Freeman Spogli appointed Jim Conroy as chief executive.7 Conroy's background differed from typical Western retail executives: after beginning his career in McKinsey consulting, he served in senior leadership roles at Claire's Stores, the mall-based accessories retailer. Although he lacked a background in Western wear, Conroy was a specialty retail operator who understood unit economics, store rollout discipline, and private-label brand development — a core capability of the accessories sector.
At Claire's, the business model relied on sourcing inexpensive inventory directly, branding it in-house, and capturing both wholesale and retail margins. Conroy joined a company whose sales floor was dominated almost entirely by third-party brands, creating an immediate opportunity to execute a similar private-label strategy.
Conroy's tenure also established a consistent long-term corporate strategy. For twelve years, the company presented investors with the same four-part blueprint: open new stores, drive same-store sales growth, build omnichannel capabilities, and expand merchandise margins through exclusive in-house brands. Those same four strategic pillars remain the core initiatives reported in fiscal 2027.3 That multi-year narrative consistency reflects disciplined execution, though current leadership inherited rather than designed the framework.
Regional roll-up as geographic arbitrage
The second pillar of the private equity playbook was scale through acquisition. The key transaction of the pre-IPO era closed on September 4, 2012, with the purchase of RCC Western Stores — a 1948-vintage chain of 30 locations across 12 states in the South and Midwest, headquartered in Rapid City, South Dakota. The deal expanded Boot Barn to 116 stores across 21 states, establishing a national footprint for the first time.8 The company acquired Texas-based Baskins in 2013, followed by smaller regional additions in subsequent years, including four Wood's Boots stores in Midland and Odessa, Texas, in 2017, and two Drysdales locations in Tulsa in July 2018 for $3.8 million.9
These acquisitions focused on asset conversion rather than brand preservation. Boot Barn's standard practice was to rebrand and remerchandise acquired stores under its own banner within twelve months, a process that management reported generated sales lifts compared to the original retail concepts.1 Rather than buying brand equity, Boot Barn purchased existing commercial real estate, established trade areas, and local vendor relationships, converting them to its centralized operating model. This approach provided a cost-effective path into new markets while creating the store density needed for efficient regional distribution and marketing.
Going public into skepticism
Boot Barn completed its initial public offering on the New York Stock Exchange on November 4, 2014. Shares were priced at $16.00 — the top of the expected $14 to $16 range — with the company selling 5,750,000 shares, including the full underwriters' option, to generate net proceeds of approximately $82.7 million.1011
While the offering priced at the top of its range, public market skepticism emerged shortly after listing, driven by two structural concerns.
First, the business faced commodity cyclicality. In fiscal 2015, Boot Barn generated $402.7 million in revenue.12 A significant portion of its workwear sales depended on employment in energy-producing regions, and the IPO closed just two months before crude oil prices suffered a sharp decline. That cyclical exposure materialized as store sales growth slowed during the 2015–2016 energy sector downturn.
Second, investors questioned the viability of physical store expansion. Boot Barn listed during a period of accelerating e-commerce growth and widespread retail closures, making market skepticism around physical apparel expansion understandable.
Management countered by positioning Boot Barn as a destination retailer of functional, fit-dependent products operating in a fragmented category of independent stores without a direct national competitor. Furthermore, leadership highlighted significant expansion opportunities east of the Mississippi River.1 At the time of the IPO, that geographic thesis was unproven, as Boot Barn operated no locations in states like Pennsylvania or Ohio. By fiscal 2026, the company had established 15 stores in Pennsylvania and 16 in Ohio.1
Freeman Spogli reduced its holding through subsequent share sales, completing its exit on May 22, 2018, when Boot Barn closed a secondary offering of 7,211,813 shares held by existing shareholders.13 With the private equity sponsor fully divested, Boot Barn operated as an independent public company, leaving its subsequent track record to management rather than financial sponsors.
Before that transition was complete, Conroy addressed the company's main remaining competitive challenge: acquiring its sole national rival, which held a dominant online presence.
IV. The Sheplers Watershed Acquisition & Omnichannel Strategy (2015)
Sheplers was older than the automobile. Founded in Wichita, Kansas, it had been selling Western wear for 116 years by 2015, building a mail-order catalog business that reached customers in regions where physical Western stores did not exist.14 That catalog heritage translated effectively to the internet. By the time Boot Barn went public, Sheplers had established the dominant e-commerce operation in the Western category.
For the newly public Boot Barn, the acquisition target addressed a clear structural gap. Boot Barn possessed a growing store network, while Sheplers controlled digital distribution. Boot Barn's proprietary online sales were economically negligible, representing roughly 4% of total sales.15
The transaction
On June 1, 2015, seven months after its IPO, Boot Barn announced a definitive agreement to acquire Sheplers for $147 million in cash. The transaction closed on June 29, 2015.1416
Financial disclosures detailed Sheplers' operational baseline. For the twelve months ended March 28, 2015, Sheplers generated approximately $157 million in net sales — including $66 million from e-commerce — and $14.9 million in adjusted EBITDA across 25 large-format retail stores. Management projected $6 million to $8 million in annual synergies, approximately 10% post-integration earnings accretion, and $14 million in one-time transaction and integration expenses.14
At 9.9 times trailing adjusted EBITDA — or roughly 7 times net of projected synergy midpoints — the purchase multiple appeared reasonable. However, investor skepticism focused on balance-sheet leverage: a company public for only seven months funded a $147 million cash purchase entirely with debt against a revenue base of roughly $400 million.
That financial leverage created long-term debt-service obligations. Boot Barn carried substantial interest expense for years following the acquisition, paying $16.3 million in fiscal 2019 compared to $1.5 million in fiscal 2026.12 Deleveraging required nearly a decade of disciplined operating cash flow.
What Boot Barn was actually buying
The transaction delivered three core assets, arranged by operational durability:
The competitor. Sheplers was the only other Western apparel retailer with national scale. While the acquisition did not create a monopoly in a category that remains highly fragmented among thousands of independent specialty stores, it eliminated the sole competitor capable of contesting Boot Barn on a national footprint.1 Remaining peers were limited to single-store operations or regional chains.
The e-commerce unit economics. Standalone footwear e-commerce faces structural margin erosion from return shipping costs when customers order multiple sizes. Sheplers operated a high-volume online channel, but as a standalone entity, the business suffered from margin dilution. Boot Barn addressed this by integrating digital operations directly into its store footprint.
Fulfilling digital orders from regional distribution hubs incurs warehouse handling and outbound freight costs, alongside return risks. By shifting fulfillment to existing store inventory — where floor space, working capital, and retail staff are already funded — incremental fulfillment costs decrease significantly. Encouraging in-store pickup drives foot traffic, creates cross-selling opportunities, and provides fitting rooms that mitigate product returns. Management subsequently embedded this model across the business, operating as a stores-first organization where a substantial share of digital orders is fulfilled directly by retail locations.3 Building out buy-online-pick-up-in-store, curbside collection, in-store returns, and store-based order fulfillment provided a structural cost advantage in specialized boot retail.1
The physical footprint. Boot Barn converted the 25 acquired Sheplers stores to its primary banner, unified inventory management systems, and eliminated redundant administrative overhead. Sheplers' Wichita facility was repurposed as Boot Barn's primary e-commerce fulfillment center, operating alongside distribution centers in Fontana, California, and Kansas City, Missouri, which manage inventory flow for exclusive brands and volume purchases.1
The lesson, and the honest caveat
The Sheplers integration serves as primary evidence that management could execute a large, debt-financed acquisition without disrupting core store operations. E-commerce sales expanded from approximately 4% to 15% of total revenue, national competitive pressure eased, and store-level return metrics remained stable.15
However, the transaction remains an isolated data point for large-scale M&A execution. Boot Barn has pursued no transformational acquisitions in the subsequent decade, making no acquisitions in fiscal 2026.1 For institutional investors, an eleven-year-old transaction provides limited validation of current M&A execution capabilities under updated executive leadership.
Nevertheless, integrating Sheplers' digital infrastructure provided the operational foundation and market runway necessary to deploy Boot Barn's primary long-term profit driver: its exclusive-brand strategy.
V. The Secret Margin Engine: Private Brands Strategy
Over the six fiscal years through fiscal 2026, Boot Barn's exclusive-brand penetration rose by approximately 1,900 basis points to reach 40.8% of consolidated sales, while merchandise margin expanded by roughly 660 basis points over the same period.2 That represents a nearly 19-percentage-point shift in sales mix and a 6.6-percentage-point expansion in merchandise margin — a structural evolution in unit economics rather than an operational side project. In fiscal 2026 alone, exclusive-brand penetration increased by 220 basis points as merchandise margin expanded by 80 basis points.2
What "exclusive brands" actually means here
In traditional retail, "private label" often connotes lower-priced substitutes positioned on bottom shelves. Boot Barn's approach differs, developing proprietary lines designed to function as standalone consumer brands.
The portfolio spans more than eleven distinct labels targeted at specific customer segments:1
- Cody James — the flagship men's Western line, which management identifies as the largest exclusive brand in the portfolio.3
- Shyanne and Cheyenne — women's Western boots, apparel, and accessories.
- Hawx — technical workwear and safety footwear designed for industrial trade requirements.
- Cody James Work — a functional work extension of the flagship brand.
- Idyllwind (developed with Miranda Lambert) and Moonshine Spirit (developed with Brad Paisley) — country-lifestyle lines built around multi-year artist partnerships.1
- Cleo + Wolf, Rank 45, Cody James Black 1978, Gibson, and El Dorado — covering country lifestyle, performance, and premium price tiers.
According to regulatory filings, each brand is developed to target "product and price segments that we believe are underserved by third-party brands."1 Rather than directly undercutting major wholesale partners like Ariat at existing price points, the company uses in-house brands to fill structural market gaps — unserved price tiers, specialized functional features, or underserved women's apparel silhouettes.
The economics, explained simply
The economic rationale behind in-house brands centers on disintermediation. When Boot Barn purchases footwear from a third-party vendor, the supplier captures a wholesale margin to cover its design, marketing, and operational overhead before Boot Barn applies a retail markup. When selling an internal brand like Cody James, Boot Barn's internal product development team manages design and contracts directly with manufacturing facilities, capturing the margin that would otherwise go to a third-party brand owner. The company then splits that captured margin between expanded gross profit and competitive shelf pricing.
Boot Barn discloses in its Form 10-K that exclusive brands "have historically achieved better merchandise margins than the third-party brands that we carry."1 While market commentators frequently cite an estimated 1,000 basis point margin premium for private label, the exact spread is not disclosed in the fiscal 2026 filing. Nevertheless, six consecutive years of expanding gross margins confirm the directional impact of the mix shift.
To support this vertical integration, Boot Barn established an internal dedicated sourcing organization during fiscal 2026. Management reported that the team was fully operational by the end of the fiscal year, with primary cost benefits expected to materialize in late fiscal 2027 and fiscal 2028. Factory negotiations and tariff mitigation managed by this team helped offset margin pressures during recent shifts in trade policy.2
The brand-storytelling experiment
Alongside manufacturing disintermediation, Boot Barn expanded direct-to-consumer digital channels for its proprietary labels. During fiscal 2026, the company launched standalone e-commerce sites for Cody James, Hawx, Cheyenne, and Cleo + Wolf to complement its existing Idyllwind platform.2 On earnings calls, management clarified that these standalone sites generated online conversion rates near 2% and represented a minor portion of overall revenue, framing their main function as brand marketing and customer acquisition to drive physical store traffic.3
Management acknowledged that it cannot directly measure physical store visits generated by these standalone websites.3 As a result, the standalone digital platforms remain an unvalidated marketing channel rather than a demonstrated growth driver. Additionally, the company began selling select exclusive and third-party items through TikTok Shop, which management described as expanding rapidly.3
The coexistence problem, and the wobble
The strategic vulnerability of an exclusive-brand strategy lies in managing relations with third-party vendors. Proprietary products compete directly for floor space with national brand manufacturers whose inventory allocations and co-op marketing support remain vital. Boot Barn explicitly cites this friction in its risk factors, warning that failing to maintain an appropriate balance between exclusive and third-party merchandise could adversely affect sales and gross profit.1
That balance experienced an operational shift in the first quarter of fiscal 2027. Following a year-long initiative to reinvigorate its workwear segment, the company generated high-single-digit same-store sales growth in work boots, marking its fifth consecutive quarter of positive growth in the category. However, that growth was driven primarily by third-party workwear brands rather than internal labels. Consequently, management lowered its full-year exclusive-brand penetration guidance from a previously projected 41.3% — which would have represented a 50-basis-point increase — to flat or slightly down compared to fiscal 2026.23
This adjustment presents contrasting analytical interpretations.
From a bullish perspective, management argued that strong third-party sales in a needs-based category expand the overall customer base. The chief financial officer noted that excluding the workwear category, exclusive-brand penetration continued to expand during the quarter.3 Furthermore, full-year merchandise margin guidance was raised from 50 basis points to approximately 60 basis points of expansion (excluding tariff refunds), supported by purchasing scale, full-price selling, supply chain efficiencies, and sourcing gains.23
From a cautious perspective, the shift demonstrates that exclusive-brand penetration can be quickly diluted by category mix shifts. It also suggests that gross margin expansion relies on multiple operational factors beyond private-label mix alone. Addressing whether the company's long-term 50% exclusive-brand penetration target remained achievable, chief executive officer John Hazen affirmed the target while framing an operational limit: "I don't think as we stand today and the brands that we have, that it is north of 50%. I think we're a house of brands. We're a retailer."3
Setting a 50% ceiling implies that the margin expansion runway from proprietary brand mix shift is capped at approximately nine additional percentage points. With private-label penetration growth moderating, the primary driver of top-line expansion shifts to physical store rollouts.
VI. Store Unit Economics & The 900+ Store Expansion Playbook
Eighty stores in one fiscal year. Then, in a single quarter, twenty-seven more — including ten that had been scheduled for fiscal 2027 and were pulled forward into the prior fourth quarter because the pipeline was running ahead of plan.23 Boot Barn opened 55 stores in fiscal 2024, 60 in fiscal 2025, and 80 in fiscal 2026.1 Over the twelve months through June 2026, it opened 93 — a 20% increase in store count.3
This is the engine. Everything else in the story is an input to it or a consequence of it.
Anatomy of the box
A Boot Barn store averages 11,400 selling square feet, typically freestanding or in a strip center, generally near high-visibility power or large neighborhood shopping centers, with a trade area of five miles or more.1 Note what is absent: enclosed malls. The format is deliberately off-mall — lower rent per square foot, easier parking for a customer who may arrive in a work truck, and no dependence on a department store anchor's foot traffic.
Roughly a third of the selling floor is boots, displayed in pairs on fixtures up to six shelves high, organized for self-service.1 Every store carries touchscreen devices that let a customer reach into e-commerce distribution center inventory and, in most cases, the inventory of larger third-party vendors — buy it in the store, ship it free.1 The physical store is finite; the assortment it can sell from is not.
The unit economics, and a discrepancy worth understanding
Here is where an investor should read carefully, because the company says two different things in two different places.
The fiscal 2026 10-K states: "Our new store model requires an average net cash investment of approximately $1.7 million and targets an average payback period of three years."1
On earnings calls, management consistently says new stores are projected to generate approximately $3.2 million in average annual revenue "with an investment payback of less than 2 years."3
Both statements can be true simultaneously — the 10-K describes the underwriting model used to approve a lease, while the call describes how the recent cohort is actually performing against it. Read that way, the gap is a feature: the company is underwriting to three years and delivering under two, which is exactly what you would want. Management has also said the $3.2 million figure is tracking "roughly in line, maybe slightly better, but not meaningfully more."3
But an investor should be clear about which number is the promise and which is the recent result. The three-year model is what the company has committed to in a filed document. The sub-two-year figure is a management characterization of a favorable cohort opened into an unusually strong Western-wear cycle. If the cycle cools, the model, not the cohort, is the relevant number.
The corroborating evidence for the store engine is genuinely strong, and it comes from an aggregate disclosure rather than a per-store claim: the 267 stores opened over the five years through fiscal 2026 — half the entire chain — contributed more than $750 million of incremental revenue in fiscal 2026, exceeding expectations on average for sales, earnings and payback.2 Roughly $2.8 million of revenue per store on average across a cohort that is not yet mature, half of it opened in the last two years, is a serious result.
There is a second, subtler benefit. Because new stores open below mature volume and ramp over years, they keep contributing growth after they enter the comp base. Stores opened in the prior five years added approximately 150 basis points to consolidated same-store sales in fiscal 2026.2 Roughly a fifth of the company's 7.2% comp was, in effect, immature stores growing up. That is a real tailwind — and it is also a mechanical one that will fade if the opening pace ever slows.
The cost of building fast
Speed is not free, and Boot Barn's disclosure on this point is unusually specific. Buying, occupancy and distribution center costs deleveraged by 50 basis points in the fourth quarter of fiscal 2026 and by 90 basis points in the first quarter of fiscal 2027, in both cases driven primarily by new store occupancy.23
The company's guidance made the mechanism explicit: accelerated store growth has reduced the proportion of fully mature locations in the sales base, raising occupancy as a percentage of sales even though average occupancy cost per store has stayed relatively consistent.2 For fiscal 2027, Boot Barn told investors it expects to leverage buying, occupancy and distribution center costs only at 10% same-store sales growth — a high hurdle — while leveraging SG&A at 2% comps and total operating income at 3% comps.2
That 10% figure is the honest price of the growth strategy, and management addressed it head-on when pushed. The CFO's framing: every store is four-wall EBITDA positive, and over a three-year period the company will have expanded operating margin by 240 basis points including tariff benefits, or 170 basis points excluding them.3 In other words, merchandise margin and SG&A leverage have more than covered the occupancy drag. Three years of evidence supports that. It is not a permanent guarantee.
Fiscal 2027 also carries two idiosyncratic costs worth flagging: two high-traffic, high-visibility flagship-style stores expected to generate outsized volumes but carrying higher pre-opening costs, including non-cash straight-line rent from early possession dates and long build-outs, with one not opening until late in the year.2 These are small items, but they illustrate a pattern — the reported occupancy line is increasingly a blend of steady-state stores and stores that are pure expense for months before they sell anything.
From 900 to 1,200
On the second-quarter fiscal 2026 call in October 2025, with 489 stores open, Boot Barn raised its long-term domestic store target from 900 to 1,200 and lifted its estimated total addressable market from $40 billion to $58 billion.1718 The basis: an internal market-by-market reevaluation combined with a third-party study, itself built partly on a survey of roughly 8,000 consumers.1718
The 1,200 figure is now the number in the 10-K.1 At 12% to 15% annual unit growth — the range management guides to — that implies well over eight more years of runway from the fiscal 2026 base.17
An analyst should treat a raised total addressable market with appropriate suspicion. TAM revisions are among the easiest numbers for a management team to move and among the hardest to falsify, and a 45% increase announced during a period of exceptional results deserves scrutiny rather than acceptance. That said, the store target is more testable than the TAM, because the geographic evidence is already partly in. Boot Barn now operates in 49 states, with 93 stores in Texas and 79 in California, but also 16 in Ohio, 15 in Pennsylvania, 11 in New York, 10 in New Jersey, and 7 in Massachusetts.1 Management has said new stores are opening well "across the country in different geographies," and that the assortment starts nearly identical everywhere, with local tweaks made mostly after opening.3
That is the actual test of the expansion thesis, and so far it is passing: a concept born in the Southwest is producing acceptable economics in the Mid-Atlantic and New England. It has not yet been tested at 1,200 stores, which would require roughly doubling density in markets where the brand is newest.
On real estate discipline, the CFO's answer to a direct question — is the priority hitting the number or getting the right sites? — was: "the goal is to open the best stores that we can open and not settle for stores that are going to be subpar."3 That is the right answer. It is also the only answer available on a public call, and the way to verify it is by watching new-store productivity, not by trusting the statement.
Funding it internally
The capital story is straightforward and, at this point, comfortable. Fiscal 2026 operating cash flow was $304.9 million against capital expenditure of $178.6 million, leaving roughly $126 million of free cash flow — and that was after absorbing a $97 million inventory build.12 Fiscal 2025, by contrast, produced essentially no free cash flow, because a $148 million inventory build consumed it all.12 Working capital, not capex, is the swing factor in this business.
Boot Barn ended the first quarter of fiscal 2027 with $139 million of cash and nothing drawn on its revolver, and in late July 2026 completed an amendment doubling that revolver's capacity to $500 million with maturity extended to 2031.3 Growth is self-funded. The revolver is optionality, not necessity.
Which brings us to what is actually inside the boxes.
VII. Segment Breakdown, Supplier Dynamics & Competitive Landscape
Boot Barn reports as a single segment, which is unhelpful for analysis but honest — the stores and the website sell the same goods to the same customers. The useful decomposition comes from the disclosures buried in the business section, and it contains at least one surprise.
By channel: the omnichannel paradox
E-commerce was 10.4% of consolidated net sales in fiscal 2026, versus 10.5% in fiscal 2025.1
That is lower than most observers assume, and it is lower than the roughly 15% penetration the Sheplers deal produced a decade ago. Yet e-commerce comp sales grew 14.1% in the fourth quarter of fiscal 2026 and 13.4% in the first quarter of fiscal 2027 — both far faster than store comps.23
How can a channel growing at 13–14% be shrinking as a share of the mix? Because the store base is growing faster. Boot Barn is adding roughly 15% more stores a year; non-comp new-store revenue lands entirely in the physical channel. The result is a company whose digital business is compounding at double digits while digital penetration stays flat.
This is the omnichannel paradox, and it is genuinely favorable. Website traffic reached more than 164 million visits in fiscal 2026, up from more than 114 million in fiscal 2025 — a 44% increase.1 That traffic is doing brand and demand-generation work whose payoff shows up in store sales, in a category where customers browse online and buy in person. The digital channel's job here is not to be big. It is to be a discovery and fulfillment layer for a store network. Investors accustomed to treating low e-commerce penetration as a red flag should invert the reading in this specific category.
By category: what actually sells
For fiscal 2026, the mix was: boots 46% of sales, apparel 37%, with the balance in hats, gifts, accessories and home merchandise. By styling, Western accounted for approximately 75% of sales, with work-related and other styles making up the remaining quarter. By gender, men's merchandise was approximately 60%.1
The 75/25 Western-to-work split is worth sitting with, because it reframes the company. Boot Barn is often described as a workwear retailer with a Western business attached. The disclosed mix says the opposite: it is predominantly a Western lifestyle retailer, with work as a meaningful, resilient, and — right now — accelerating minority.
That acceleration is real and management has been explicit about its origin. Reinvigorating work boots was one of three priorities Hazen set on taking the job, executed through in-store remerchandising, shifted marketing dollars, and deeper investment in key third-party work brands.2 The result was five consecutive quarters of work-boot comp growth through the first quarter of fiscal 2027, reaching high single digits.3
Pushed on whether this reflected the industrial capital-expenditure cycle — data center construction, electrification projects — Hazen declined the easy narrative: growth came more from lace-up than pull-on boots, "so not driven by oil"; work apparel strength was split between flame-resistant and non-FR product; and while stores report upticks when a large data center project arrives in town, he said he could not see it in the aggregate purchase data.3 That is a management team choosing a less flattering, more accurate answer over an available macro story. It is a small thing and it is the kind of small thing worth weighting.
The competitive field, war-gamed
Cavender's is the closest thing to a peer: family-controlled, Tyler, Texas-headquartered, now more than 130 stores across more than 18 states, expanding actively in 2026 into Nevada, Florida and New Mexico.19 Boot Barn's own filings claim more than four times as many stores as its nearest direct competitor selling primarily Western and work wear — arithmetic consistent with Cavender's scale.1
Cavender's is a real competitor with real brand equity in Texas and the South. What it does not have is public-market capital, national e-commerce scale, or a large exclusive-brand margin buffer. In practical terms, it can defend Texas. It cannot outspend Boot Barn into Ohio.
Tractor Supply Company overlaps in basic work apparel and rural lifestyle goods, and it is far larger overall. But Boot Barn's filings characterize farm supply stores as competitors that realize only a small percentage of total revenue from Western and work wear.1 The distinction is assortment depth: a Tractor Supply carries work boots; it does not carry a third of its selling floor in boots, arranged by size, with associates trained on toe profiles and safety-toe regulations.1 Both can win — they are solving different problems.
Independents. The most important competitor is not a company; it is a category structure. Boot Barn estimates thousands of independent specialty stores scattered across the country.1 These operators lack purchasing power, private-brand margin, and omnichannel infrastructure. They are also the source of Boot Barn's runway: every new Boot Barn is, in part, a share transfer from independents. This is a consolidation story more than a market-growth story, and consolidation stories have long tails.
Online-only players. The footwear return-rate problem is the structural defense, and it is the same one that explains why Boot Barn's own e-commerce works best when tethered to stores.
Supplier power: the two-way squeeze
Three suppliers accounted for roughly 25% of net sales in each of fiscal 2026 and fiscal 2025.1 That is genuine concentration, and it is the most underappreciated risk in the story.
The offsetting force is that Boot Barn is, in many cases, among the largest accounts of its suppliers — which the company says yields increased buying power and access to first-to-market or limited-edition product.1 There is also a scale mechanic management described directly: Boot Barn now takes full container loads of individual styles from vendors and earns volume discounts for it, and those discounts get larger simply as the company grows.3 That is a real, non-rhetorical source of margin improvement, and it explains part of why fiscal 2027 merchandise margin guidance rose even as exclusive-brand penetration guidance fell.
The unresolved question is what happens if a major vendor — the largest Western brands are the obvious candidates — decides that Boot Barn's exclusive brands have become a competitive threat and pulls allocation or pushes its own direct-to-consumer channel harder. Boot Barn's exclusive brands are the hedge against that scenario. They are also the thing that would provoke it. Management's stated approach is to aim exclusive brands at underserved price and product gaps rather than at vendors' core positions.1 The first quarter of fiscal 2027, where third-party work brands took share from Boot Barn's own labels because the third-party product sold better, is evidence that the company is genuinely willing to let the customer decide. That is the right behavior for protecting vendor relationships, and it costs margin mix to do.
The people running the floor
One operating detail deserves mention because it is unusual. As of March 28, 2026, Boot Barn employed approximately 3,800 full-time and 8,900 part-time "Partners," of whom roughly 11,500 worked in stores and roughly 1,200 at the Store Support Center and distribution centers.1 The company explicitly does not rely heavily on sales commissions or supplier-specific incentive programs for the vast majority of store associates.1
That is a deliberate choice with a strategic consequence: an associate who is not paid on the margin of a particular brand has no reason to steer a customer toward the exclusive brand or away from Ariat. In a store where the retailer is also a competitor to its own vendors, non-commissioned selling is what makes the coexistence claim credible.
Which leads naturally to the people making these decisions — and to the fact that the person who made most of them for twelve years no longer works here.
VIII. Management, Capital Allocation & Leadership Transition
On October 28, 2024, Boot Barn reported strong quarterly financial results while simultaneously announcing that Chief Executive Officer Jim Conroy would step down to lead Ross Stores.2021 Boot Barn's stock fell 8.2% following the announcement.22
That sharp drop reflected the extent to which public markets attributed Boot Barn's decade of store expansion and operational transformation to a single executive.
The Conroy record
Conroy officially stepped down as chief executive, president, and director on November 22, 2024, becoming CEO-elect at Ross Stores in December before assuming full leadership there in February 2025.2021 Over his twelve-year tenure, Conroy expanded Boot Barn from an 85-store regional chain with family-business infrastructure into a national retail network generating more than $1.5 billion in annual revenue, while nearly tripling operating margins compared to its pre-IPO levels.12
Following the 2015 Sheplers integration, management avoided further transformational acquisitions. Instead, the company paid down debt and reinvested free cash flow into organic store expansion and internal brand development. Annual capital expenditure increased from $60 million in fiscal 2022 to $179 million in fiscal 2026 to support the accelerated store rollout.12 During this period, the company paid no dividends, refrained from substantial share repurchases until fiscal 2026, and avoided expanding into unrelated retail categories.
That capital allocation strategy prioritized reinvestment in higher-return physical stores, an approach supported by the revenue and profitability generated by recent store cohorts.2
The Hazen question
John Hazen served as interim chief executive from November 22, 2024, until his permanent appointment on May 5, 2025, following an executive search. Executive Chairman Peter Starrett noted that the board unanimously selected Hazen based on his industry experience and digital transformation track record.23
The six-month interim evaluation period signaled that the board conducted an external review before electing internal continuity.
Hazen joined Boot Barn in 2018 as Chief Digital Officer, overseeing e-commerce, marketing, and customer experience.20 His background focused on digital commerce rather than core merchandising, including executive roles at Ring, True Religion, Kellwood, Nike, and Fox Racing.23
Given that digital sales account for roughly 10% of total revenue, Hazen's appointment initially raised investor questions about whether a digital executive would shift capital allocation away from physical store economics.
Hazen's operational priorities upon taking leadership focused on three key areas: establishing an internal sourcing organization, positioning exclusive labels as standalone brands, and reinvigorating the workwear category.2 The first two initiatives center on merchandising and supply chain operations rather than digital channels, while workwear has delivered positive same-store sales growth. Furthermore, Hazen has repeatedly described Boot Barn as a stores-first organization, framing standalone brand websites primarily as traffic drivers for physical stores.3
The primary operational shift under Hazen has been the build-out of a dedicated internal sourcing team. While creating a net expense in fiscal 2026, the initiative is projected to yield supply chain savings starting in fiscal 2028. Initial tariff-mitigation results credited to the team represent an early operational data point.2
Financial policy continuity is maintained by Chief Financial Officer Jim Watkins, who continues to use a standardized guidance methodology based on recent sales trends adjusted for historical seasonality.3
Testing guidance discipline
Boot Barn's guidance practices demonstrate a conservative baseline that has set up subsequent upward revisions, though recent adjustments warrant analytical distinction between core performance and one-time gains.
In May 2026, Boot Barn issued fiscal 2027 guidance projecting $2.6 billion in sales, 4.0% same-store sales growth, a 51.4% merchandise margin, $353 million in operating income, and $8.64 in diluted earnings per share. That initial outlook explicitly excluded approximately $18 million in pending legal tariff refunds.2
Ten weeks later, following first-quarter results that exceeded expectations, management raised full-year guidance to $9.23 in diluted earnings per share, increased merchandise margin guidance to 52.2%—incorporating a 70-basis-point benefit from tariff refunds—and raised operating income guidance to $374 million, while leaving the same-store sales growth projection unchanged at 4.0%.3
While excluding pending tariff recoveries until realized aligns with conservative accounting practices, the updated headline expectation of 26% earnings-per-share growth includes $0.46 per share from tariff refunds. That one-time recovery accounts for roughly a quarter of guided earnings growth for the fiscal year.3 Management disclosed this item transparently across quarters, allowing analysts to isolate operational growth from non-recurring receipts.
The CFO's forecasting methodology incorporates discretionary judgment alongside baseline trend extrapolation. When establishing the second-quarter fiscal 2027 outlook following a soft July sales period, management projected July's slower trend forward but added one percentage point to the same-store sales estimate to account for temporary factors, noting that combining June and July performance would have produced a higher baseline.3
Management's handling of the exclusive-brand guidance adjustment provided further insight into corporate communications. When lowering full-year exclusive-brand penetration guidance while raising overall merchandise margin targets, executive leadership provided specific category-mix data.3 In response to analyst inquiries regarding whether the revisions signaled shifts in long-term targets or reduced workwear competitiveness,3 Hazen acknowledged that both factors contributed.3
Incentive alignment: what the proxy actually says
Boot Barn's executive compensation structure links pay directly to earnings metrics rather than same-store sales growth or return-on-invested-capital (ROIC) targets.
For fiscal 2026, the annual cash incentive for the chief executive officer and chief financial officer was tied entirely to Consolidated EBIT. Performance goals were set with a threshold of $226.2 million, a target of $266.1 million, and a maximum of $306.0 million. Actual Consolidated EBIT reached $299.1 million, generating a 183% bonus payout. Hazen's target annual bonus was set at $894,231—representing 100% of his base salary—resulting in an actual cash payout of $1,634,211.24
Other senior leaders—including the Chief Merchandising Officer, Chief Digital Officer, and Chief Retail Officer—were evaluated on additional operational targets, including consolidated exclusive-brand sales penetration, which achieved a 140% payout, and consolidated merchandise margin for the merchandising officer, which achieved a 175% payout.24
Long-term equity incentives are split equally between time-based restricted stock units vesting over three years and performance share units tied to cumulative earnings per share across a three-year performance window, with potential payouts ranging from 0% to 200% of target. Following his permanent appointment, Hazen received a target long-term award valued at $4,100,000. Performance share units granted in fiscal 2024 vested at 146% of target, reflecting three-year cumulative earnings per share that reached 109% of targeted levels.24
This incentive structure features specific governance implications for investors:
First, the compensation framework focuses primarily on absolute profit dollars. It lacks explicit capital-efficiency parameters, such as return-on-invested-capital gates or store-level return hurdles. For a business allocating substantial annual capital to new store developments, tying incentives to EBIT and cumulative earnings per share rewards overall profit expansion rather than unit-level capital efficiency. While pre-opening expenses and occupancy costs moderate short-term earnings growth from aggressive store expansion, the compensation plan relies on management oversight rather than explicit contractual metrics to guard against capital misallocation if new-store economics soften.
Second, specific cumulative earnings-per-share performance targets remain undisclosed, with Boot Barn citing commercial sensitivity.24 Without published target thresholds, external investors cannot independently evaluate the rigor of long-term performance goals. Additionally, the vesting structure exhibits significant upside sensitivity, where achieving 109% of target generated a 146% equity payout.
Returning capital, finally
In fiscal 2026, Boot Barn initiated share repurchases under a $200 million board authorization. The company repurchased approximately 287,000 shares for $50 million in fiscal 2026 and an additional 158,000-plus shares for $25 million during the first quarter of fiscal 2027, bringing cumulative repurchases to $75 million for roughly 445,000 shares.23 The company does not pay a cash dividend.
Relative to Boot Barn's $5 billion market capitalization, cumulative repurchases of $75 million represent a modest capital allocation choice aimed primarily at offsetting share dilution from equity compensation rather than significantly reducing share count. This capital deployment reflects a strategic decision to prioritize internal cash flow toward store expansion—where targeted payback periods remain under three years—over large-scale share buybacks at current market valuations.
Whether Boot Barn's ongoing expansion and financial performance stem primarily from durable structural competitive advantages or favorable macroeconomic cycles requires a formal strategic framework.
IX. Strategic Playbook: Hamilton Helmer's 7 Powers & Porter's 5 Forces
Frameworks are only useful if applied honestly, including where they fail. Hamilton Helmer's test for a genuine "power" is demanding: it must produce a benefit the company enjoys alongside a barrier preventing competitors from copying it. Most claimed corporate moats fail the barrier requirement.
Where Boot Barn passes
Scale Economies. This represents the company's strongest case, backed by structural data rather than broad assertions. Boot Barn's scale enables three advantages that smaller competitors cannot replicate: a dedicated in-house product development and sourcing organization that designs and places factory orders directly; full-container-load purchasing that earns volume discounts growing mechanically with size; and marketing amortization across 566 stores. That advertising reach lets the company sponsor Stagecoach, the Houston Livestock Show and Rodeo, the National Finals Rodeo, Professional Bull Riders, and hundreds of local events at a cost per store that a 130-store chain cannot match.123
The barrier is capital and time. A competitor cannot build a sourcing organization for 40 stores' worth of volume and cannot fund national marketing on a regional base. This power is real and compounding, providing substantial support for Boot Barn's fiscal 2027 margin guidance.
Cornered Resource — partially. Two candidates exist. Vendor allocation: Boot Barn's status as one of the largest accounts of key suppliers grants access to first-to-market and limited-edition product.1 That inventory access is genuinely scarce. Real estate: prime off-mall sites in specific trade areas are non-replicable once taken, and Boot Barn is claiming them at approximately 15% annual unit growth in markets where no competitor is building.
The barrier is weaker than it appears in both cases. Vendor allocation is a business relationship rather than a binding contract, and relationships can be repriced. Real estate is a genuine first-mover asset, but the United States offers abundant strip-center space; being first is an advantage of timing rather than permanent exclusion.
Branding. Boot Barn's brand equity in Western and blue-collar communities rests on decades of rodeo sponsorship, artist partnerships, and grassroots presence — the kind of cultural authenticity a general merchandiser cannot quickly manufacture.1 The barrier is time and credibility risk: a retailer that misreads Western culture is punished by the exact core customers it needs to retain. The company's loyalty database, comprising 10.8 million members who purchased within the prior three fiscal years after expanding 12.5% in fiscal 2026, serves as the clearest quantitative measure of that affinity.12
Counter-Positioning — weakly. Helmer's counter-positioning requires a business model incumbents cannot copy because doing so would damage their existing economics. Boot Barn's destination off-mall format does not meet that definition. Department stores could not replicate a 3,000-pair boot assortment, but they have no strategic interest in doing so, while regional peer Cavender's operates essentially the same format. The tactile fitting advantage over online-only retail is real, but it represents an industry category characteristic rather than a proprietary power. This reflects a favorable market structure that Boot Barn exploits effectively, rather than a unique competitive barrier.
Where Boot Barn has no power
There is no network effect. There are no switching costs — a customer can purchase their next pair of boots anywhere, and roughly half of Boot Barn's transactions originate from new customers in any given period.3 There is no proprietary process power; the operating model is disciplined but transparent. Finally, there is no regulatory protection insulating the business.
This distinction matters. Boot Barn's advantages stem from scale and brand equity — powerful assets, but of a type that erodes if execution falters, while offering no protection against a broader cyclical decline in demand. Nothing in the model locks a customer in.
Porter's Five Forces
Rivalry: low to moderate. Thousands of independent retailers and one primary regional chain operate in a market management sizes at $58 billion.117 Notably, John Hazen reported in mid-2026 that industry promotional cadence remained rational across independent operators, farm-and-ranch stores, and specialty competitors.3 Rational pricing in a fragmented category creates a favorable environment — though one that could shift quickly if a rival mismanages inventory.
Threat of new entrants: low. Replicating 566 stores at approximately $1.7 million in net cash investment each, alongside an internal sourcing organization, supplier relationships, and brand equity, requires a multi-decade, multi-billion-dollar commitment against an incumbent already securing top tier real estate.1
Buyer power: low. Individual consumers hold no negotiating leverage, and purchasing decisions prioritize fit, durability, and brand over price. Management reported markdowns as a percentage of inventory running below historical levels and no shift in customer response to promotional merchandise — empirical evidence that buyers are not extracting price concessions.3
Supplier power: moderate, and the most contested force. Carrying three suppliers that account for 25% of net sales represents genuine vendor concentration.1 The exclusive-brand portfolio provides a structural counterweight, and mutual dependence is real: Boot Barn serves as a critical distribution channel for major bootmakers. However, that commercial balance is negotiated continuously, and first-quarter fiscal 2027 results showed that when third-party products win consumer preference, Boot Barn cedes merchandise mix rather than forcing proprietary labels.3
Threat of substitutes: mixed by category. Substitution risk is non-existent for mandated safety footwear and flame-resistant workwear. It is moderate for Western fashion apparel, where consumer spending can easily shift to alternative lifestyle categories. That structural asymmetry makes the 75-to-25 Western-to-work revenue split a critical analytical detail: three-quarters of total sales sits in the more substitutable category.
The composite strategic evaluation reveals a well-defended retail engine operating in a structurally attractive, fragmented market. Its scale advantages are real and compounding, yet the model possesses no structural defense if category-wide demand cools. That vulnerability defines the precise fault line dividing the bull and bear cases.
X. Bull vs. Bear Case & Skeptical Investor Stress Test
In late July 2026, Boot Barn reported first-quarter fiscal 2027 financial results that exceeded Wall Street expectations across major operating metrics, yet disclosed that same-store sales during the first four weeks of July were approximately flat.3
Management attributed the July deceleration to temporary event scheduling, citing fewer Western-lifestyle concerts than in the prior year and televised World Cup matches that drew foot traffic away from stores. Executives supported the explanation with hourly transaction logs showing sharp comp declines during broadcast windows, noting also that July 2025 had faced an exceptionally strong 11% same-store sales comparison.3
That single disclosure encapsulates the central investment debate. Skeptics view the deceleration as evidence of a fragile demand profile vulnerable to minor consumer distractions. Optimists see a resilient model where the weakest month of the year held steady against an 11% comparison while needs-based workwear continued expanding at high-single-digit rates. Both conclusions draw from the same operational data.
The bull case
The store expansion runway relies on empirical performance rather than assumptions. Even if the 1,200-store long-term target proves aggressive, reaching the company's prior 900-store goal from its 566-location footprint still represents more than 60% unit growth. Furthermore, expansion outside legacy Southwest markets is supported by store performance across 49 states, where a five-year cohort of 267 new locations generated over $750 million in incremental fiscal 2026 revenue.12
Gross margin expansion relies on multiple operational levers. First-quarter fiscal 2027 performance demonstrated that gross margin is not solely dependent on private-label mix shift. When exclusive-brand penetration moderated, full-year merchandise margin guidance still increased, supported by purchasing scale, full-price selling, distribution efficiencies, and direct-sourcing initiatives.3 A margin structure backed by four operational drivers offers greater durability than one reliant on a single mix variable.
Workwear expansion improves earnings stability. Five consecutive quarters of positive same-store sales growth in work boots, accelerating to high single digits, highlight strength in a needs-based category driven by workplace safety requirements.13 Sustained growth in this segment improves earnings quality by expanding the non-discretionary portion of sales.
Consumer demand remains broad-based across demographic segments. Internal transaction analysis across customer income brackets revealed no widening gap between lower- and higher-income shoppers, a consistency management confirmed even during the softer July sales period.23 In a broader retail environment characterized by uneven consumer spending, uniform demand across customer tiers provides near-term stability.
A conservative balance sheet eliminates debt-service risk. Operating zero net debt with no revolver borrowings, an expanded $500 million credit facility maturing in 2031, and fully self-funded capital expenditures, the business model carries minimal financial leverage risk.3
The bear case, argued properly
Discretionary Western apparel dominates the revenue mix. While investment theses frequently emphasize needs-based workwear resilience, work apparel and safety boots represent only 25% of net sales.1 The remaining 75% comes from discretionary Western apparel and footwear, which benefited from a strong multi-year cultural cycle reflected in fiscal 2026 same-store sales gains of 8.4% in the second quarter and 6.1% in the fourth quarter.2[^25] Signs of moderation emerged in the first quarter of fiscal 2027, as sales of women's Western boots shifted from mid-teens growth in the prior-year period to a mid-single-digit decline, concentrated in fashion leather styles.3 Chief Executive Officer John Hazen attributed the decline to changing style preferences and stockouts in key $280 price-point inventory.3 However, product stockouts and shifting consumer tastes can also mark the initial stages of a broader category deceleration.
Occupancy deleverage creates a permanent hurdle for operating margins. For fiscal 2027, the leverage point for buying, occupancy, and distribution center expenses rose to a 10% same-store sales growth threshold, compared to full-year guidance of 4.0%.2 At planned comp levels, fixed store occupancy costs naturally deleverage as long as annual unit count expands at a 12% to 15% rate. Management noted that operating margins expanded 170 basis points over the prior three years (excluding tariff refunds) because merchandise margin gains and administrative leverage offset occupancy drag.3 However, as private-label penetration approaches its 50% target ceiling, merchandise margin gains will moderate, leaving operating margins vulnerable if comp growth slows.
Non-recurring tariff refunds inflate reported earnings growth. Recent trade policy shifts significantly impacted headline financial metrics. After the U.S. Supreme Court declared baseline tariffs under the International Emergency Economic Powers Act unlawful on February 20, 2026, Customs and Border Protection established a portal on April 20, 2026, to issue refunds with interest.1 Boot Barn recognized $14.7 million in tariff refunds during the first quarter of fiscal 2027—contributing 250 basis points to merchandise margin and $0.38 to diluted earnings per share—and expects full-year refunds to reach $17.8 million, adding 70 basis points to merchandise margin and $0.46 to earnings per share.3 Full-year guidance assumes ongoing tariff rates between 10% and 12%.3 Although disclosure of these items has been thorough, tariff recoveries account for nearly a quarter of guided fiscal 2027 earnings growth, masking lower core operating growth while trade policy remains subject to ongoing Section 301 and 232 investigations.1
Rising inbound freight costs present medium-term margin risks. Recent increases in container rates and fuel surcharges threaten gross margins once existing logistics contracts expire. Management indicated that twice-annual inventory turns lock in shipping costs through fiscal 2027, but acknowledged medium-term uncertainty. Chief Financial Officer Jim Watkins noted: "We're operating in the same environment as everybody else is. And as we get into next year, we'll have to see how that plays out."3 Unhedged freight costs eroded 90 basis points of gross margin during previous supply chain disruptions.3
Inventory expansion outpaces same-store sales growth. Total inventory rose 16% year-over-year to $900 million in the first quarter of fiscal 2027, compared to a 1% gain in same-store inventory.3 While management attributed the growth to new store openings, private-label commitments, and volume purchasing discounts—noting markdowns remain below historical averages—volume-discount purchasing ties up substantial working capital.3 In fiscal 2025, a $148 million inventory expansion absorbed operating cash flow, reducing free cash flow to zero.12 A widening gap between inventory growth and same-store sales represents an operational vulnerability if consumer demand softens.
Executive leadership remains unproven in an economic downturn. John Hazen completed his first full year as permanent chief executive during favorable retail market conditions.23 Long-term supply chain savings from the internal sourcing team are not scheduled to materialize until fiscal 2028.2 Furthermore, management lowered its full-year exclusive-brand penetration guidance within a single quarter of setting the initial target.23 The updated management team has yet to navigate a prolonged cyclical contraction.
The activist stress test
An institutional investor conducting a rigorous stress test of the business would challenge management on five specific operational and governance issues:
Capital allocation metrics: Annual store capital expenditures reach approximately $130 million, yet executive compensation contains no formal return-on-invested-capital (ROIC) targets.224 Investors should demand specific cash-on-cash return figures for the fiscal 2024 and fiscal 2025 store cohorts individually—rather than five-year aggregate averages—and request separate performance metrics for locations opened in newly entered, low-brand-awareness markets.
Margin and payback disclosures: Filings indicate that exclusive brands generate higher merchandise margins than third-party inventory, but management does not quantify the exact margin spread.1 Additionally, earnings call commentary cites an investment payback period under two years, whereas Form 10-K filings underwrite new locations to a three-year payback model.13 Management should publicly reconcile the underwriting model with actual store cohort performance.
Occupancy leverage thresholds: Buying, occupancy, and distribution costs require a 10% same-store sales gain to achieve expense leverage in fiscal 2027, compared to full-year comp guidance of 4.0%.2 Analysts must evaluate at what store count this leverage hurdle stabilizes, and how operating margins will hold if merchandise margin gains cap out before occupancy costs leverage.
Executive compensation design: Performance share units granted in fiscal 2024 vested at 146% of target for achieving 109% of cumulative earnings-per-share goals, while baseline performance targets remain undisclosed.24 Governance standards warrant greater transparency regarding long-term incentive target thresholds and payout curves.
Store maturity comp tailwinds: Immature stores ramping to full volume contributed approximately 150 basis points to consolidated same-store sales growth in fiscal 2026.2 Investors need visibility into mature-store comp trends isolated from new-unit maturation, as well as the mechanical comp impact if annual store openings slow.
These questions do not expose immediate operational flaws, but they highlight areas where current public disclosures leave key analytical gaps.
Second-layer signals
Several operational details outside the primary thesis warrant monitoring at the margin:
- Credit facility extension. In July 2026, Boot Barn amended its credit agreement, doubling revolver capacity to $500 million and extending maturity to 2031 with zero balance drawn—securing liquidity from a position of balance-sheet strength.3
- Geographic concentration. Despite expanding into 49 states, California and Texas represent 172 of 539 locations, exposing revenue to regional economic shifts and localized weather disruptions.1
- Distribution center capacity. Logistics operations rely on a three-node distribution system. Management extended the lease on its Fontana, California facility in mid-fiscal 2026 while deploying capital improvements across all three hubs, addressing throughput capacity constraints incrementally rather than adding a major regional hub.12
- M&A discipline. Boot Barn completed no corporate or store acquisitions in fiscal 2025 or fiscal 2026, reflecting a capital strategy focused exclusively on organic store development.1
XI. Epilogue, Key KPIs & What to Watch
One detail in Boot Barn's fiscal 2026 disclosures illuminates the business model more clearly than any margin figure: the majority of top-selling styles across its store network had been in the assortment for more than five years.2
That continuity shapes operational strategy. The retailer's core best-sellers are established inventory positions held for half a decade, restocked automatically as real-time point-of-sale data triggers purchase orders.1 Rather than speculating on seasonal fashion trends, the operating model focuses on maintaining stock depth for proven styles across localized trade areas.
This discipline explains how a boot retailer established in Huntington Beach in 1978 grew into an 80-store-a-year expansion engine by fiscal 2026 while traditional mall apparel concepts faced widespread retrenchment. Boot Barn identified a category where product cycles span years rather than months, where proper fit demands physical try-ons, where safety regulations mandate a quarter of merchandise demand, and where local independent competitors lack sourcing scale, proprietary brand margins, and digital infrastructure. Over the fourteen years following its private equity buyout, the company executed a consistent playbook: expanding store count, developing proprietary brands, and scaling supply chain logistics.
The operational model has demonstrated its efficacy over a multi-year period, supported by six consecutive years of gross margin expansion, recent store cohorts outperforming underwriting targets, and a fully self-funded capital expenditure program.2 The central analytical question is determining how much of recent financial performance stems from structural advantages versus a favorable convergence of external factors: a multi-year Western fashion cycle, elevated industrial construction spending, rational competitor promotion, and non-recurring legal tariff refunds.13
The three metrics that actually matter
1. Same-store sales, split between retail stores and e-commerce. Channel composition provides the cleanest indicator of whether sales momentum reflects underlying demand growth or cyclical tailwinds. Physical store comps signal unit-level health, while digital comps measure broader brand adoption relative to store footprint growth. Equally critical is the breakdown between average unit retail prices and customer transaction counts. Revenue growth driven by transaction volume signals market share expansion, whereas growth driven solely by higher prices faces long-term limits. For fiscal 2027, management projected average unit retail growth near 3% alongside flat-to-1% transaction growth, highlighting transaction volume expansion as the primary source of operational upside.3
2. New-store productivity and payback timelines. Management's reported target of $3.2 million in first-full-year average revenue per new store—delivering an investment payback under two years—underpins the valuation case for $130 million in annual store capital expenditure and an expanded long-term store pipeline.23 Executive leadership committed to updating these unit metrics if performance trends shift.3 The key test remains whether new stores in newer, low-brand-awareness regional markets sustain the unit economics demonstrated in core Texas and California trade areas. Any persistent decline in new-store sales productivity or payback length would alter the compounding math of the rollout.
3. Merchandise margin performance relative to exclusive-brand mix. For six fiscal years, merchandise margin expansion tracked rising exclusive-brand penetration directly. Results in the first quarter of fiscal 2027 decoupled these metrics, as full-year exclusive-brand penetration guidance was revised flat to slightly down while full-year merchandise margin guidance increased.3 Tracking this relationship reveals whether gross margin expansion reflects broader operational drivers—such as vendor volume discounts, direct sourcing, and full-price selling—or depends strictly on private-label mix shift. If gross margin gains moderate while proprietary brand penetration caps out, fixed occupancy deleverage will pressure overall operating margins.
What would falsify the case
Three operational developments would challenge the investment thesis. First, new-store first-year average sales drifting below $3.0 million would extend payback periods beyond underwriting thresholds and compress returns on invested capital. Second, same-store inventory growth persistently outpacing same-store sales would risk inventory imbalances and force higher promotional markdowns. Third, a contraction in work-boot same-store sales occurring alongside a Western category deceleration would signal that the workwear segment's non-discretionary demand hedge is failing to offset broader consumer softness.
Boot Barn has established a dominant, self-funded specialty retail footprint during an era characterized by widespread physical retail contraction. The company's multi-year operating record demonstrates disciplined execution, comprehensive disclosure, and clear operational strategy. The remaining untested variable is how the business model performs if macro consumer spending in Western lifestyle categories experiences a sustained, multi-year downturn.
References
-
Boot Barn Holdings, Inc. Form 10-K for Fiscal Year Ended March 28, 2026 — U.S. Securities and Exchange Commission, 2026-05-14 ↩↩↩↩↩↩↩↩↩↩↩↩↩↩↩↩↩↩↩↩↩↩↩↩↩↩↩↩↩↩↩↩↩↩↩↩↩↩↩↩↩↩↩↩↩↩↩↩↩↩↩↩↩↩↩↩↩↩
-
Boot Barn Holdings Q4 and Full Year Fiscal 2026 Earnings Call Transcript — Seeking Alpha, 2026-05-14 ↩↩↩↩↩↩↩↩↩↩↩↩↩↩↩↩↩↩↩↩↩↩↩↩↩↩↩↩↩↩↩↩↩↩↩↩↩
-
Boot Barn Holdings Q1 Fiscal 2027 Earnings Call Transcript — Seeking Alpha, 2026-07-29 ↩↩↩↩↩↩↩↩↩↩↩↩↩↩↩↩↩↩↩↩↩↩↩↩↩↩↩↩↩↩↩↩↩↩↩↩↩↩↩↩↩↩↩↩↩↩↩↩↩↩↩↩↩↩↩↩↩↩↩↩↩
-
Boot Barn Holdings, Inc. Company Profile & Market Data — Reuters ↩
-
Boot Barn CEO an Apparel Industry Outlier — Orange County Business Journal ↩↩
-
Boot Barn, Inc. Acquired by Freeman Spogli and Management — Freeman Spogli & Co., 2011 ↩↩
-
Boot Barn Holdings, Inc. Notice of 2026 Annual Meeting and Proxy Statement (DEF 14A) — U.S. Securities and Exchange Commission, 2026-07-16 ↩
-
Matrix Serves as Exclusive Advisor to RCC Western Stores on its Sale to Boot Barn, Inc. — Matrix Capital Markets Group, 2012-09-04 ↩
-
California-based Boot Barn acquires Drysdales, of Tulsa — Fox Business ↩
-
Boot Barn Holdings, Inc. Announces Completion of Its Initial Public Offering and Exercise of Option to Purchase Additional Shares — Boot Barn Investor Relations, 2014-11-04 ↩
-
Western apparel retailer Boot Barn prices IPO at $16, the high end of the range — Nasdaq, 2014-10-29 ↩
-
Boot Barn Holdings, Inc. SEC Filings Archive (CIK 0001610250) — U.S. Securities and Exchange Commission ↩↩↩↩↩↩↩
-
Boot Barn Holdings, Inc. Announces Closing of Public Offering by Selling Stockholders — Business Wire, 2018-05-22 ↩
-
Boot Barn Announces Definitive Agreement to Acquire Sheplers, Inc. — Business Wire, 2015-06-01 ↩↩↩
-
Boot Barn buys western wear retailer Sheplers for $147 million — Digital Commerce 360, 2015-06-02 ↩↩
-
Boot Barn Holdings, Inc. Completes Acquisition of Sheplers, Inc. — Boot Barn Investor Relations, 2015-06-29 ↩
-
Boot Barn Holdings Q2 Fiscal 2026 Earnings Call Transcript — Seeking Alpha, 2025-10-29 ↩↩↩↩
-
Boot Barn Boosts Store Target to 1,200 from 900 — Orange County Business Journal ↩↩
-
Cavender's Boot City Expands Operations in Sparks, NV — Cavender's, 2026 ↩
-
Boot Barn CEO Jim Conroy to Step Down — SGB Media, 2024-10-28 ↩↩↩
-
Boot Barn CEO Jim Conroy Steps Down to Head Ross Stores — Retail Dive, 2024-10-29 ↩↩
-
Boot Barn's CEO Steps Down; Shares fall 8.2% — Orange County Business Journal, 2024-10 ↩
-
Boot Barn Holdings Removes "Interim" from John Hazen's CEO Title — SGB Media, 2025-05-05 ↩↩↩
-
Boot Barn Holdings, Inc. Compensation Discussion and Analysis, 2026 Proxy Statement — U.S. Securities and Exchange Commission, 2026-07-16 ↩↩↩↩↩↩
 LinkedIn
 WhatsApp
 Reddit
 Hacker News
 Email
Email Kindle
 RSS Feed
 Spotify
 Apple Podcasts
 Amazon Music
 Audible
 YouTube