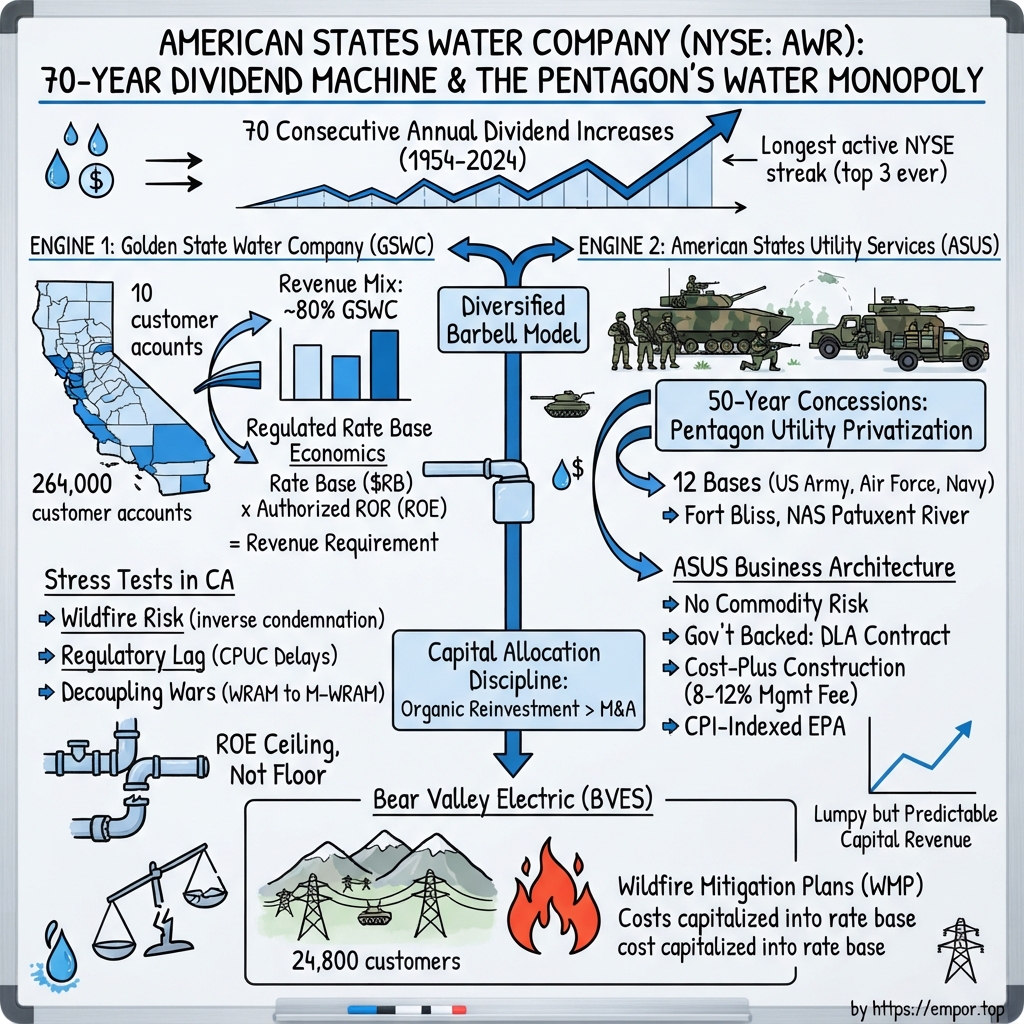
American States Water Company (NYSE: AWR): The 72-Year Dividend Machine and the Pentagon's Water Monopoly
I. Introduction & Episode Roadmap
On August 4, 2026, the board of American States Water Company—headquartered in a low-rise office complex on East Foothill Boulevard in San Dimas, California, an inland suburb best known to moviegoers as the setting for a 1989 time-travel comedy—approved an increase to its cash payout. The quarterly dividend rose from $0.5040 to $0.5455 per share, an 8.2% increase paid on September 2.1
That action marked the 72nd consecutive calendar year in which American States Water raised its dividend. The company has paid a common dividend every single year since 1931.2 That payout streak has weathered the aftermath of the Great Depression, the entire Cold War, the stagflation of the 1970s, Black Monday, the dot-com collapse, the 2008 financial crisis, a global pandemic, and the 2022 interest rate shock. On the New York Stock Exchange, only an elite handful of issuers possess a longer active record.
Behind that record lies an operational paradox. American States Water sells a price-regulated commodity in California—one of the most litigious and politically challenging utility jurisdictions in the United States—to communities that have periodically attempted to seize its infrastructure through eminent domain. The utility cannot adjust customer rates without commission approval, cannot choose its operating territories, and purchases substantial supplies from a public wholesaler that raises wholesale prices at will. Yet in 2025, the company earned a 12.5% return on book equity on $658 million in revenue, even as it reinvested $210.9 million—nearly a third of its top line—back into buried pipe.2
On paper, that dynamic should be fragile. Explaining why it has endured for more than seven decades, while pinpointing where operational, legal, and capital allocation seams are beginning to show, forms the core of this analysis.
What AWR actually is. The holding company comprises three distinct operating units, and their relative financial contributions matter far more than conventional utility summaries suggest.
Golden State Water Company (GSWC) is the core regulated water utility, serving roughly 265,200 customer connections across 11 California counties under the oversight of the California Public Utilities Commission.12 In fiscal 2025, it generated $464.1 million in revenue—about 71% of the consolidated total—and $100.9 million in segment net income, roughly 77% of consolidated earnings.2 Its physical footprint spans 2,890 miles of pipeline, five surface water treatment plants, adjudicated groundwater rights of 70,362 acre-feet per year, and surface water rights of 11,335 acre-feet per year.2
American States Utility Services (ASUS) operates as an unregulated contracted-services division managing 50-year utility privatization concessions across U.S. military installations. In 2025, it generated $136.7 million in revenue (21% of the consolidated total) and $23.5 million in net income (18%), while absorbing just $6.0 million in company capital additions.2 Viewed together, those metrics illustrate the underlying economic engine: ASUS produced nearly a fifth of corporate profit while requiring virtually no equity capital from the balance sheet.
Bear Valley Electric Service (BVES) is a small regulated electric distributor serving roughly 24,900 connections around Big Bear Lake in the San Bernardino Mountains.1 In 2025, it contributed $9.6 million in net income—about 7% of the consolidated total—on $57.2 million in revenue.2 While it represents the smallest segment, it carries by far the most severe tail risk through catastrophic wildfire liability.
The roadmap. The analysis begins with the company's 1929 founding and the two municipal condemnation battles of the 2010s that define the true strength and legal limits of its economic moat. Next comes the regulatory mechanics: how an investor-owned water utility generates profit, and why 2022 proved that regulated returns are far from guaranteed. The focus then turns to ASUS, frequently described as a hidden crown jewel, evaluating its actual operating expansion against its multi-decade contract durations. From there, the investigation covers capital allocation, balance-sheet leverage, and a looming arithmetic challenge embedded within the dividend streak, followed by Bear Valley's exposure to wildfire liabilities and California's inverse condemnation doctrine. It concludes with competitive dynamics, the bull and bear investment theses, and the three core metrics that indicate whether the long-term thesis remains intact.
The story begins where those foundational water rights were first secured.
 Subscribe on LinkedIn
II. California Water Wars & The 1929 Genesis
The founding story is not romantic. It is a roll-up.
In April 1928, a group of Chicago investors formed a holding company called American States Public Service Company with the intention of acquiring utilities across the country. An engineer named John C. Rath surveyed Southern California, and between March 1928 and October 1929 he assembled 33 separate water properties—subdivision wells, agricultural pumping outfits, ditch companies, and small municipal systems—across Los Angeles and Orange Counties for roughly $5.8 million. On December 31, 1929, two months after the Wall Street crash, the operating entity was incorporated as American States Water Service Company of California. It began life serving approximately 43,000 customers across 31 communities, with most of the local systems physically disconnected from one another.3
The timing appeared catastrophic, but proved resilient. In its first full operating year, the company earned more than $600,000 on revenues of nearly $1.5 million.3 That performance demonstrated the business's foundational characteristic: household water consumption remains remarkably stable during an economic depression, exhibiting near-total price and demand inelasticity across the business cycle. What did collapse was the Chicago holding company, which deteriorated through the early 1930s and entered bankruptcy receivership. The California operating subsidiary insulated itself from the failure, reorganized as Southern California Water Company, and by November 1947 began a fully independent existence under sanitary engineer C.P. Harnish.3
What Rath had purchased in 1928 was less about physical pipe than strategic positioning within a legal system that was rapidly closing.
Why the water rights mattered more than the assets. Western water law operates under the doctrine of prior appropriation—first in time, first in right—layered atop riparian claims and, across Southern California's groundwater basins, formal judicial adjudication. In an adjudicated basin, a court permanently quantifies and divides safe-yield pumping entitlements among the existing pumpers. Once a decree is entered, the basin's capacity is locked. Newcomers cannot claim new groundwater; they must either purchase existing entitlements from incumbent holders or import water through wholesalers at substantially higher rates. GSWC holds adjudicated groundwater rights of 70,362 acre-feet per year, securing an entrenched low-cost position that cannot be duplicated today.2 Rath essentially secured seats at the table before the rules were finalized, just as the Los Angeles Department of Water and Power was constructing the massive aqueducts that would define California water politics for the next century.
The carve-out that created the industry. Most California drinking water is publicly administered. Regional giants—including LADWP, the East Bay Municipal Utility District, and the Metropolitan Water District of Southern California—are public agencies. What remained in private investor ownership is a small, tightly regulated oligopoly overseen by the CPUC: Golden State Water, California Water Service Group, San Jose Water under SJW Group, and several smaller legacy operators. These investor-owned utilities do not compete with one another; they operate within distinct, non-overlapping franchise territories. On July 1, 1998, amid an industry-wide corporate restructuring wave, a new holding company was established above the operating utility and restored to an old name: American States Water Company, holding Southern California Water and American States Utility Services as direct subsidiaries.3 This corporate structure served a critical regulatory function: it ring-fenced the utility's capital structure from the unregulated federal contracting division, ensuring CPUC-mandated equity ratios would not constrain holding-company capital allocation elsewhere. In 2005, the water operating entities were consolidated under the Golden State Water Company brand.4
Historical falsification: the myth of absolute monopolistic immunity
The foundational premise of many water utility investments is that buried pipe networks are immune to competitive displacement, guaranteeing perpetual operating franchises.
The physical dimension of that claim holds firm. No competitor will finance a second, parallel distribution network beneath the paved streets of an established suburb like Culver City merely to compete on retail price. But displacement in the water utility sector does not stem from commercial rivals; it originates from local voters.
Municipalities wield eminent domain authority, and California law explicitly authorizes government agencies to condemn and acquire public utility infrastructure if doing so establishes a more necessary public use.2 During the 2010s, two distinct GSWC service territories tested that legal threat, producing divergent outcomes that outline the boundaries of the company's moat.
Ojai. Golden State Water lost. Because retail rates in the Ojai Valley were among the highest in GSWC's system, a local civic coalition called Ojai FLOW mobilized public opposition, prompting voters to authorize the Casitas Municipal Water District to pursue a hostile acquisition. Following years of administrative and courtroom disputes, the parties settled on April 12, 2017. Casitas acquired the Ojai water system through eminent domain for approximately $34.5 million, covering physical infrastructure, receivables, and regulatory assets.5 Casitas formally assumed operations for the roughly 2,900 customer connections on June 8, 2017.6 Those assets were permanently removed from GSWC's rate base.
Claremont. Golden State Water prevailed. In November 2014, Claremont voters approved Measure W, authorizing up to $135 million in municipal revenue bonds to condemn and municipalize the local system. The dispute advanced to trial in Los Angeles County Superior Court. On December 9, 2016, Judge Richard L. Fruin Jr. dismissed the city's condemnation complaint, ruling that Golden State had successfully rebutted the statutory presumption favoring government ownership—partly because the debt service on the city's proposed acquisition bonds would actually force consumer water rates higher.[^7] Claremont appealed the decision but ultimately abandoned the effort. Under an October 2017 settlement, the city dismissed all litigation, paid Golden State $4.8 million in legal reimbursements, and agreed to refrain from condemnation efforts for at least 12 years, while Golden State forgave $5.8 million in disputed receivables. Claremont spent nearly $14 million in taxpayer funds on the failed acquisition campaign.7
In an ironic postscript, GSWC today leases groundwater rights from the City of Claremont—entitlements allocated to the municipality under the Six Basins adjudication—with $0.9 million in remaining lease commitments under a contract running through 2028.2 The former courtroom adversaries now operate as routine commercial counterparties.
Verdict. The evidence does not invalidate the franchise moat, but it refines it. While physical commercial competition is non-existent, political displacement is an active, documented risk that consumes significant financial resources even when the utility wins. Condemnation is rarely ignited by water contamination or inadequate service quality—the Claremont court specifically recognized GSWC as the more capable operator. Instead, the catalyst is retail rate disparity relative to adjacent municipal districts, particularly in affluent communities with the legal budget and civic organization to sustain multi-year litigation. This dynamic elevates rate design from routine administrative compliance into the front-line defense of the operating franchise, meaning every general rate case carries cumulative political friction that never shows up on a regulatory ledger.
That dynamic also establishes a tangible timetable. The Claremont litigation truce expires around 2029, meaning the 2028–2030 general rate case before the CPUC will determine the exact rate structure in place when the city becomes legally eligible to revisit condemnation.
That reality leads directly into the regulatory machinery that governs those rates.
III. The Engine of Value: Utility Rate Base Economics 101
One central principle explains how this company generates profit: a regulated water utility does not get paid for selling water. It gets paid for owning pipe.
The underlying economic mechanism is straightforward. A regulatory commission tallies the utility's prudent operating costs—labor, administration, depreciation, and taxes—and adds an authorized return on invested capital. That invested capital is the rate base: the depreciated original cost of physical assets deemed prudently built and actively serving customers, including water mains, treatment plants, wells, storage reservoirs, and meters. Multiplying the rate base by an authorized rate of return yields the revenue requirement—the total dollar amount the utility is legally permitted to collect from its customer base. Customer tariffs are then calibrated to generate that target.
To use an analogy: imagine a commercial landlord whose rental income is governed by a municipal board that appraises the building, audits operating expenses, and caps rent at those costs plus a fixed percentage return on the property's physical valuation. The landlord cannot increase earnings simply by raising rent on existing square footage; profit compounds only by prudently expanding the physical structure with regulatory approval.
Under this regulatory framework, rate base expansion serves as the primary engine of earnings growth. At Golden State Water, that capital base has grown substantially: adopted average water rate base expanded from $980.4 million in 2021 to $1,673.2 million in 2026, representing an 11.3% compound annual growth rate over five years.[^9] That pace exceeds typical utility expansion rates and underpins the core equity investment thesis.
The authorized return. GSWC's current authorized rate of return on rate base is 7.93%, derived from an authorized return on equity of 10.06%, an embedded cost of debt of 5.1%, and an authorized capital structure comprising 57% equity and 43% debt.2 Two dimensions of that 10.06% return on equity warrant close examination. First, it sits at the upper end of recent California water utility benchmarks. It was established through the Water Cost of Capital Mechanism—an index that automatically recalibrates authorized ROE as benchmark utility bond yields shift—which lifted the authorized return from the 8.98% benchmark established in the prior cycle to 10.06%, effective January 2024.[^10] Second, and more consequential for multi-year earnings models: in November 2025, the CPUC approved a joint request from GSWC and three peer water utilities to defer their next cost-of-capital application by one year, pushing the required filing date to May 1, 2027, with an effective implementation date of January 1, 2028, while leaving the existing adjustment mechanism in place through the deferral.[^9]
That deferral is a critical, frequently overlooked component of the company's near-term outlook. By locking in a 10.06% authorized ROE through December 31, 2027,2 the decision removes near-term cost-of-capital regulatory risk. At the same time, it indicates that the ROE recovery leg of the bull thesis is no longer an upcoming catalyst; it has already materialized and is fully reflected in current earnings.
The three-year cycle and regulatory lag. GSWC files a general rate case every three years to forecast capital investments and operating expenses, after which the CPUC conducts its administrative review. The 2022–2024 cycle illustrates the operational friction of regulatory lag: although revised tariffs were scheduled to take effect on January 1, 2022, final decisions on the general rate case and cost of capital were not issued until June 29, 2023—eighteen months into the three-year rate period.[^10][^11] Throughout that period, the utility continued to deploy capital into infrastructure while billing customers under outdated rate schedules, financing the cash shortfall with short-term debt before booking a retroactive catch-up adjustment once the decision was finalized.
That lag created sharp accounting distortions. Diluted earnings per share fell from $2.55 in 2021 to $2.12 in 2022—a 17% decline during a year in which rate base was expanding and underlying operations remained sound. EPS then snapped back to $3.37 in 2023 once retroactive revenues were recorded.2 In isolation, neither year's reported figure accurately reflected run-rate business economics.
This dynamic highlights a central accounting reality in utility finance: reported net income is heavily influenced by regulatory assets and liabilities—deferred balances that a utility records today under the expectation that regulators will authorize future recovery from ratepayers. The historic Water Revenue Adjustment Mechanism (WRAM) and Modified Cost Balancing Account (MCBA) operated on this principle, allowing GSWC to book uncollected revenue and deferred costs on its balance sheet until surcharges could be enacted. Those legacy balances did not disappear with the discontinuation of the mechanisms; in May 2025, GSWC instituted surcharges to recover all pre-2025 revenue and supply cost variances, with the majority scheduled for recovery over eighteen months.2 Because the value of these regulatory assets depends on management's assessment of recovery probability—subject to audit rather than marked to market—reported earnings can diverge meaningfully from cash flow. This gap was particularly pronounced in 2024, when a one-time tax benefit of $0.13 per share from the water rate case settlement and $0.06 per share in retroactive electric utility rates were recognized within a single quarter.[^9]
The 2025–2027 case, and what the company lost in it. The 2025–2027 general rate case was settled with the CPUC's Public Advocates Office and approved by final decision on January 30, 2025. It authorized GSWC to invest approximately $573.1 million in capital infrastructure over three years, including $17.7 million allocated for "advice letter" projects that are submitted for recovery as they reach completion.8 This settlement established a protective accounting structure: advice letter projects accrue financing costs at the adopted cost of debt during construction and transition to the full authorized rate of return once placed in service, shielding the utility from uncompensated regulatory lag during construction. GSWC completed an initial tranche and filed for recovery in November 2025; the CPUC approved the filing in December, adding roughly $80 million in project costs and accumulated memorandum balances into the 2026 adopted rate base and generating approximately $11 million in incremental annual revenue requirement.[^9]
While capital approvals progressed favorably, the proceeding imposed a major structural setback on earnings predictability.
Historical falsification: the guaranteed return fiction
The claim under test: investor-owned utilities earn a return guaranteed by the state, making them functionally risk-free.
The 2022 earnings decline disproves the strong form of that claim. An authorized ROE is an allowable ceiling established by the regulator, not a guaranteed cash floor; when regulatory decisions lag by eighteen months during an inflationary period, earned returns fall materially short, with retroactive recovery granted entirely at the regulator's discretion.
The more significant test of this thesis, however, emerged from the regulatory battle over revenue decoupling—a case study in how administrative agencies can enforce policy outcomes even after suffering courtroom defeats.
Between 2008 and 2024, GSWC operated under a full WRAM paired with an MCBA. These mechanisms completely decoupled revenue from volumetric water consumption: if drought mandates or conservation campaigns reduced customer usage, GSWC still collected its authorized revenue requirement via balancing account surcharges. Similarly, if wholesale water rates exceeded forecasts, the cost variance was passed through to ratepayers. By insulating the utility from volumetric and weather fluctuations, this framework provided the steady, bond-like stability long associated with the equity.
In August 2020, the CPUC ordered the full WRAM discontinued. GSWC, three peer utilities, and the California Water Association petitioned for judicial review. On July 8, 2024, the California Supreme Court set aside the CPUC's order—not on the substantive economic merits of decoupling, but on narrow procedural grounds, ruling that the Commission's scoping memos failed to provide adequate administrative notice that eliminating the WRAM was under consideration.9
The procedural victory proved fleeting. On January 30, 2025, the CPUC—having addressed its procedural defects—reaffirmed its policy stance and denied GSWC's request to retain the full WRAM and MCBA. Instead, the Commission mandated a transition, effective January 1, 2025, to a Monterey-style Water Revenue Adjustment Mechanism (M-WRAM) and an Incremental Cost Balancing Account (ICBA).82
The practical difference is substantial. Under the M-WRAM, GSWC reconciles only the revenue variance between tiered conservation rates and a uniform flat rate across actual metered consumption; it no longer compensates for overall reductions in customer water usage. Under the ICBA, the utility tracks deviations between authorized and actual per-unit water supply costs, but it no longer shields against shifts in the underlying supply mix.2 As a result, two critical operational variables have transferred from ratepayers back to equity holders: the total volume of water customers purchase, and the proportion of supply sourced from proprietary wells versus expensive municipal wholesalers.
The operational impact of this exposure became apparent in 2025. Total customer water consumption came in nearly 4% below the level adopted in the rate case, creating a direct volume drag on revenue. However, because GSWC was able to source a higher proportion of supply from internal wells than modeled in the rate case, the lower supply costs offset the volumetric decline, resulting in no material net earnings impact.[^9]2 Relying on offsetting variances is not risk mitigation; it represents operational exposure balancing on a knife's edge.
In the first quarter of 2026, that exposure swung unfavorably. Golden State Water's quarterly earnings were pressured by an unfavorable supply mix that relied more heavily on purchased water, driven partly by temporary well outages across several service districts.[^14] Routine well maintenance has thus become a direct quarterly earnings sensitivity.
The financial scale of this variable is evident on the income statement: purchased water expenses climbed to $98.2 million in 2025 from $74.3 million in 2024, with purchased water expanding from 41% of total supply to 48%.2 Because purchased wholesale water costs multiple times more than groundwater pumped from owned wells, fluctuations in rainfall, basin levels, or mechanical well availability now transmit directly to the bottom line.
Verdict. The premise that utility returns are state-guaranteed is invalid in its strict form and considerably diminished in practice. GSWC operates with a high-probability return structure, but one constrained by chronic regulatory lag—demonstrated by significant earnings volatility between 2021 and 2023—and, since January 2025, direct volumetric and supply-mix risks absent for sixteen years. The primary operational indicators tracking this risk are now reported quarterly: the spread between actual water consumption and rate-case projections, alongside the proportion of purchased wholesale water versus proprietary pumped supply.
The next regulatory benchmark is already underway. In July 2026, GSWC filed its 2028–2030 general rate case under CPUC docket A.26-07-001.10 In its second-quarter investor presentation, management outlined a proposed capital investment plan of approximately $1 billion—a roughly 75% increase over the $573.1 million authorized in the 2025–2027 cycle.11 Whether the Commission approves a capital budget of that scale, and whether it reconsiders full decoupling in the wake of judicial review, represent the defining regulatory questions for the core utility.
Meanwhile, an entirely different operating division within the holding company generates earnings independent of Sacramento oversight.
IV. The Hidden Crown Jewel: ASUS and the 50-Year Pentagon Concessions
Fort Bliss sprawls across roughly one million acres of Texas and New Mexico desert outside El Paso. Buried beneath that expanse run 1.7 million feet of water pipe, nearly one million feet of wastewater lines, 40 storage tanks, and 16 lift stations.[^17] In 2004, the U.S. Army decided it no longer wanted to operate any of it.
That decision rested on a specific statutory foundation: Section 2688 of Title 10 of the U.S. Code, which authorizes the secretary of a military department to convey a utility system on a military installation to a municipal, private, regional, district, or cooperative utility—the legal basis for the Department of Defense's utility privatization program.12 The underlying rationale was straightforward: military branches faced decades of deferred maintenance in buried infrastructure, lacked the capital budget appetite to remediate it, and held little institutional expertise in operating water utilities—the core competency of commercial utility operators.
On June 22, 2004, the Army awarded Fort Bliss Water Services Company—a newly formed subsidiary of American States Utility Services—a 50-year privatization contract valued at up to $383.2 million.[^17] That award was ASUS's first, establishing the template for the division's subsequent expansion.
Why the structure is unusual. In defense procurement, five-year indefinite-delivery/indefinite-quantity contracts represent the industry standard, making recompetes a constant operational reality. Fifty-year firm concessions, by contrast, are exceedingly rare. Operating subsidiaries of ASUS hold 50-year utility contracts across ten installations: Fort Bliss in Texas and New Mexico, Fort Lee in Virginia (covering wastewater), Joint Base Langley-Eustis and Joint Expeditionary Base Little Creek-Fort Story in Virginia, Joint Base Andrews in Maryland, Fort Jackson in South Carolina, Fort Bragg in North Carolina, Eglin Air Force Base in Florida, Fort Riley in Kansas, and Naval Air Station Patuxent River in Maryland. Joint Base Cape Cod in Massachusetts represents the lone exception, operating under a task-order agreement with a 15-year term.2
How ASUS gets paid. Revenue flows from two distinct streams that behave very differently.
The first stream is a firm-fixed-price management fee for operating, maintaining, testing, and renewing utility systems—an operational annuity adjusted annually through Economic Price Adjustments (EPAs) filed with the federal government to reflect wage and cost inflation.2 This component represents the segment's predictable foundation.
The second stream is capital upgrade and construction work. The federal government funds the projects, while ASUS oversees design and project management. Because American States Water does not hold these infrastructure assets on its balance sheet, the segment required only $6.0 million in company capital additions during 2025 despite generating $136.7 million in total revenue.2 That dynamic is reflected across the segment's financial reporting: $60.6 million of construction expenses flowed through the income statement in 2025 with matching revenue, while ASUS generated $23.5 million in segment net income.2 Functionally, it operates as an asset-light management business structured as a government contractor.
The common characterization of ASUS as an "unregulated" business requires qualification, as it overstates the segment's operational autonomy. ASUS's operating subsidiaries remain subject to utility oversight, but through state commissions outside California. Fort Bliss Water Services holds a certificate of public convenience and necessity from the Public Utility Commission of Texas. In addition, the Virginia State Corporation Commission exercises jurisdiction over the Virginia military operations, the Maryland Public Service Commission regulates Joint Base Andrews and potentially Patuxent River, the South Carolina Public Service Commission oversees Fort Jackson, and the North Carolina Utilities Commission exercises authority over the Fort Bragg entity.2 While the practical distinction from Golden State Water's California regime is meaningful—these installations operate under firm-fixed-price federal contracts rather than forward-looking general rate cases, and state regulators apply a relatively light touch—the segment does not operate in a regulatory vacuum. Rather than complete deregulation, ASUS provides geographic and administrative diversification.
The strategic value of ASUS lies less in its operating margin than in its institutional independence. Its earnings are determined by federal contracting officers rather than CPUC commissioners, backed directly by the U.S. Treasury. For a parent corporation otherwise exposed almost entirely to California's political and regulatory climate, roughly one-fifth of consolidated profit is insulated from Sacramento.
Historical falsification: the friction behind the 50-year moat
The claim under test: ASUS operates as an automated compounding engine, insulated from bureaucratic friction by multi-decade contract terms.
The operating record does not support that automated narrative, and disconfirming evidence appears throughout the company's regulatory filings.
The price-adjustment mechanism involves administrative friction. Contract price adjustments are not automatic escalators; they are formal filings that must be prepared, submitted, and negotiated on an installation-by-installation basis across staggered annual cycles. The company's 2025 annual report outlines a schedule of ten separate EPA filings across ten military installations, each with an individualized filing quarter and adjustment period.2 When administrative negotiations stall, operating margins compress, recovering only once retroactive settlements are approved. That volatility is documented in financial results: management cited the resolution of various economic price adjustments as a key driver of higher ASUS earnings in both 2025 and the first quarter of 2026.[^9][^14] Earnings that surge when administrative backlogs clear are earnings that were temporarily depressed while those negotiations were pending.
Construction revenue remains inherently volatile. ASUS revenue increased by $9.5 million in the fourth quarter of 2025 and $6.4 million in the first quarter of 2026, with management attributing both increases primarily to higher construction activity resulting from project timing.[^9][^14] In federal contracting, timing reflects congressional appropriations cycles, continuing resolutions, and Pentagon capital disbursement schedules. Extrapolating a single high-revenue quarter at ASUS effectively annualizes a federal budget cycle rather than a permanent step-change in earning power.
Contract wins are infrequent and stepwise. This dynamic distinguishes a stable annuity from a high-growth business. ASUS secured its first privatization concession at Fort Bliss in 2004. Its most recent 50-year contract, covering Naval Air Station Patuxent River, was awarded in August 2023 with an initial estimated value of approximately $349 million over 50 years, subject to annual price adjustments.1314 Operations at Patuxent River and Joint Base Cape Cod both commenced in April 2024.2 While having two installations enter service in a single year was notable after an extended dry spell, one of the two agreements carries a 15-year term rather than the marquee 50-year concession.
Competitive scale highlights this gap. American Water Works' Military Services Group operates water and wastewater systems across 18 military installations, serving approximately 670,000 military personnel and dependents under the same 50-year privatization model.15 ASUS operates eleven. In a market where the addressable universe of privatizable bases is finite and each contract involves multi-year procurement contests, ASUS remains the smaller of the sector's two scaled incumbents.
The construction backlog reflects a similar steady-state reality. The Department of Defense awarded ASUS $29.4 million in new capital upgrade construction projects during 2025, scheduled for completion through 2028.[^9] Relative to a segment generating $136.7 million in annual revenue, that award volume represents routine replenishment rather than accelerated expansion.
Verdict. The franchise moat survives scrutiny, but in a more defined role. ASUS represents a high-return, capital-light annuity backed by an exceptionally creditworthy counterparty and insulated from volumetric water risk—attributes supported by more than fifteen years of operating performance. What the data does not support is characterizing the division as a rapid growth engine. Over more than two decades, American States Water has secured privatization contracts at an average pace of roughly one base every two years, trailing its primary competitor in contract volume. Management's public commentary reflects that measured pace: on the first-quarter 2026 earnings call, Chief Executive Officer Robert J. Sprowls affirmed only that the company remains "confident that we can effectively compete for new military base contract awards in the future based on our strong reputation with the military and our expertise."[^14] That framing emphasizes competitive positioning rather than an accelerating deal pipeline.
Testing this dynamic over the medium term is straightforward: an acceleration in new 50-year awards and expanding construction contract volumes would challenge the bear case, while another multi-year stretch of earnings hovering around $0.60 per share without new base additions would reinforce it.
For 2026, management projected that ASUS would contribute between $0.63 and $0.67 per share to consolidated earnings, compared with $0.61 in 2025 and $0.55 in 2024.[^9] The trajectory reflects steady compounding rather than rapid expansion.
The leadership team that assembled this operating structure has guided the company long enough to be evaluated on the broader capital allocation decisions that followed.
V. Management, Governance, & Capital Allocation
A revealing detail emerges from the earnings call transcripts that corporate press releases omit. At the conclusion of the fourth-quarter 2025 earnings call—a full-year financial review for an enterprise carrying a 72-year dividend growth streak—the conference operator opened the line for questions and reported an empty queue. The call abruptly adjourned. Three months later, on the first-quarter 2026 call, the pattern repeated: "as there are no questions, this concludes our question-and-answer session."[^9][^14]
Two consecutive quarters without a single analyst question is unusual even for a small-cap utility, and the silence cuts both ways. Viewed generously, management's prepared remarks are unusually thorough, frequently spanning more than fifteen minutes of granular regulatory and operational detail. Viewed critically, it indicates that the equity is under-scrutinized on Wall Street: no analysts are probing the utility's volumetric supply-mix exposure, the sustainability of its dividend payout trajectory, or the deal pipeline at ASUS in a public forum where management's answers are recorded under securities law.
Robert J. Sprowls joined American States Water in 2004 as chief financial officer and stepped into the role of president and chief executive officer in January 2009, amid the depths of the global financial crisis. He has led the company for more than seventeen years and served in its executive suite for twenty-two. His public communication style is uniformly technical, detailing advice letter memorandum accounts, adopted supply mixes, and attrition rate filings in the same measured cadence with which he references a Newsweek ranking of the most trustworthy companies in America.[^14] What he avoids is promotional narrative or promises of corporate reinvention. In an industry where utility executives frequently pledge strategic transformation, seventeen years of quarterly presentations focused almost exclusively on buried pipe replacement represents a deliberate strategic posture.
Eva G. Tang serves as senior vice president of finance, chief financial officer, corporate secretary, and treasurer. She joined the company in 1996 and has served as CFO since 2009.16 Sprowls and Tang have directed the company's financial strategy together for seventeen consecutive years—a level of executive continuity rarely matched in publicly traded utilities, and an operational advantage in a business where earnings depend heavily on institutional memory across decades of CPUC regulatory precedent.
That executive continuity, however, also reflects a broader human capital concentration that management explicitly acknowledges. American States Water and its operating subsidiaries employed 900 people at year-end 2025: 537 at Golden State Water, 48 at Bear Valley Electric, and the remaining 315 across ASUS and the parent holding company.2 Roughly 38% of that workforce will be eligible to retire within five years—a demographic reality the company's annual report highlights both in its human capital disclosures and as a formal risk factor, noting that many operational positions require specialized state certifications and licenses that cannot simply be hired around.2 For an enterprise whose competitive moat is substantially procedural—rooted in the institutional ability to build complex rate cases, administer regulatory memorandum accounts, and negotiate federal economic price adjustments—an impending generational turnover among licensed personnel presents a tangible operational headwind. Adding to near-term labor considerations, Bear Valley's collective bargaining agreement with the International Brotherhood of Electrical Workers, covering 18 of the electric utility's 48 employees, expires in December 2026.2
Another structural nuance that standard utility summaries overlook is that American States Water operates as a pure holding company whose primary assets consist of its equity investments in operating subsidiaries, meaning every dividend distributed to shareholders relies entirely on cash coming up from below.2 Those intercompany cash flows fluctuate far more than the smooth trajectory of common dividend distributions suggests: Golden State Water transferred $55.4 million to the holding company in 2023, $35.1 million in 2024, and $37.5 million in 2025.2 Under regulatory ring-fencing rules, the regulated utilities must give first priority to their own operational and capital expenditure requirements, maintaining the equity-heavy capital structures mandated by the CPUC; consequently, the parent company's access to subsidiary liquidity remains legally subordinate to regulatory capital requirements.2 While this restriction has never constrained corporate distributions—given the company's conservative balance sheet—it represents the exact administrative conduit through which an adverse cost-of-capital determination or unexpected capital mandate would ultimately transmit to common shareholders.
What the incentives actually pay for. A close examination of executive compensation disclosures reveals management priorities that differ sharply from conventional corporate structures.
The chief executive's annual cash incentive is weighted 60% toward financial performance and capital deployment metrics, 20% toward customer service quality, supplier diversity, and regulatory compliance, and 20% toward individual performance objectives.16 The structure of long-term equity incentives is more revealing: 19% is tied to total shareholder return relative to a defined peer index of water utilities, 45% based on Golden State Water's water segment operating expense achievement, 11% based on ASUS cumulative net earnings, and 25% service-based restricted stock units.16
Nearly half of the chief executive's multi-year incentive compensation is therefore anchored to containing operating expenses at the water utility—rather than earnings-per-share expansion, rate base accumulation, or corporate acquisitions. Only about one-fifth is tied directly to equity market outperformance.
This compensation architecture is both economically defensible and strategically telling. Under CPUC ratemaking mechanics, managing operating costs below adopted regulatory allowances represents one of the few avenues through which a utility can temporarily earn above its authorized return on equity. Controlling expenses also suppresses customer rate increases, reinforcing the utility's political standing and mitigating condemnation risk in communities like Claremont. Conversely, this structure rewards administrative efficiency over aggressive capital deployment: an incentive plan that allocates 45% of its long-term weight to operational cost containment and only 19% to relative shareholder return provides management little financial incentive to pursue out-of-state acquisitions or corporate transformation, even if a strategic opportunity were to emerge.
Corporate governance practices remain conservative. Stock ownership guidelines mandate holdings equal to five times base salary for the chief executive and three times the annual cash retainer for outside directors. Share hedging is prohibited; share pledging requires prior board authorization, and no director or executive officer has pledged shares since the restriction took effect; a clawback policy enforces forfeiture upon accounting restatements; and the program includes no guaranteed minimum bonuses or uncapped annual incentives.16 At the May 2026 annual meeting, shareholder support for the advisory say-on-pay resolution reached approximately 91%—with 28.6 million votes in favor, 2.5 million against, and 250,000 abstaining—reflecting broad institutional backing, even if short of an overwhelming endorsement.16
The capital allocation record, and what it deliberately excludes. The holding company's strategic posture becomes clearer when contrasted with broader industry peers. In March 2020, Essential Utilities (formerly Aqua America) completed a $4.275 billion acquisition of Peoples Natural Gas, an all-cash transaction including roughly $1.1 billion in assumed debt that expanded the company's asset base by nearly 50% and permanently changed its earnings mix.17 Similarly, American Water Works has spent more than a decade acquiring municipal water and wastewater systems across multiple state jurisdictions. American States Water has pursued neither path.
Instead, the company has concentrated capital expenditures almost exclusively on internal system renewals, deploying $210.9 million into regulated infrastructure in 2025 and guiding toward $185–220 million for 2026.1[^9] When acquisitions occur, they are strictly small-scale tuck-ins: a $5.25 million agreement to acquire the City of Norwalk's municipal water system serving roughly 900 residential customers—submitted for CPUC approval in January 2026 and projected to add about $1 million in annual revenue—alongside service rights for master-planned developments that expand incrementally as homebuilders construct them. These developer agreements include the San Juan Oaks community on the Central Coast, projected to scale toward approximately 1,300 connections, and Sutter Pointe in Northern California, which encompasses an initial development phase of up to 3,800 connections and an estimated multi-decade buildout reaching 17,500 dwelling units.[^9]
This pattern reflects capital discipline in a foundational sense: management allocates capital primarily into assets that are eligible for immediate inclusion in the regulated rate base, avoiding the premium multiples and integration risks of large competitive auctions. Yet this discipline warrants objective assessment. The absence of goodwill write-downs or restructuring charges across public filings from fiscal 2018 through fiscal 2025 demonstrates financial prudence, but it also reflects a strategic choice never to deploy capital outside the company's historical operating perimeter. For public equity investors, capital discipline that has never been tested by a major contested transaction remains a conservative operating habit rather than a proven competitive capability.
The balance sheet, and the ATM that is ending. At December 31, 2025, American States Water maintained a consolidated debt-to-capitalization ratio of 0.48 to 1.00 against a 0.65 debt covenant threshold; Golden State Water recorded a debt-to-capitalization ratio of 0.4352 against a 0.6667 covenant limit, and a debt-to-EBITDA ratio of 3.4x against an 8x limit.2 Standard & Poor's affirms the holding company at "A" with a stable outlook and the water utility at "A+" stable.1 Golden State Water holds substantial balance-sheet headroom under these agreements, with capacity to issue an additional $1,148 million of debt before its dividend covenant would even bind.2
One structural dynamic that the dividend narrative tends to obscure deserves to be stated plainly: American States Water does not generate surplus free cash flow after accounting for infrastructure reinvestment, nor is its business model designed to do so. In 2025, net cash generated from operating activities totaled $229.7 million against $210.9 million in company-funded regulated capital expenditures, leaving just $18.8 million in organic cash generation before paying dividends—a figure flattered by roughly $17 million of non-recurring PFAS litigation proceeds and by the catch-up surcharges described earlier.[^9]2 After accounting for common dividend payments, capital outlays exceed operating cash flow. This deficit is not an operational flaw; it is the deliberate financial mechanics of rate-base compounding in action. A growing rate base requires investment to exceed depreciation, which means a growing regulated utility structurally consumes cash and funds the gap with debt and equity. The common dividend is therefore funded not from annual surplus cash, but out of a capital structure that the regulator permits and the credit markets fund. That arrangement remains financially sound when borrowing costs are manageable and regulatory recovery is dependable; it becomes uncomfortable if both change at once.
Dilutive equity financing has remained modest and is being wound down. American States Water raised $67 million net under its at-the-market program during 2025 and $6.2 million in Q1 2026, and Tang has stated on consecutive calls that the company does not expect to continue the ATM once the remaining balance—$34.3 million as of the first quarter—is used.[^9][^14] Although modest, the share issuance produced a measurable earnings drag: management attributed a $0.01 per share earnings reduction to ATM dilution in each of the fourth quarter of 2025 and the first quarter of 2026.[^9][^14] Ending the program is a real signal that internally generated cash plus debt capacity is expected to fund the plan.
Historical falsification: has management ever destroyed value — and can the dividend keep this pace?
Two claims require rigorous testing against the empirical record.
The first claim concerns capital preservation: whether management has maintained capital discipline or destroyed shareholder value through misallocated investments. Across company filings from fiscal 2018 through fiscal 2025, the record shows no goodwill impairments, no discontinued speculative ventures, and no accounting restatements. While this finding applies to a bounded multi-year review period rather than the company's entire history, it confirms that the executive team has avoided the value-destroying diversifications that have periodically challenged other diversified utilities.
The second claim is more demanding, as it defines the boundary of future shareholder returns: can American States Water sustain an 8% annual dividend growth rate over the long term?
Over the five-year period through the first quarter of 2026, the company increased its cash dividend at a compound annual rate of 8.5%, exceeding management's stated long-term policy of more than 7% over the long term.2 Management cites this performance constantly and reasonably to demonstrate total-return credibility.
Evaluating that dividend expansion alongside underlying earnings growth reveals an arithmetic tension. Diluted earnings per share rose from $2.55 in 2021 to $3.37 in 2025—compound growth of roughly 7.2%.2 The dividend has been growing about a percentage point and a half faster than earnings, from a payout baseline that was already substantial. Following the August 2026 increase, the new annualized rate of $2.182 per share sits at roughly 65% of 2025's reported EPS.12
A cash dividend cannot outgrow earnings indefinitely without the payout ratio mathematically converging on 100%. While this variance has remained sustainable to date—supported by a conservative 2021 earnings baseline, multi-year rate case adjustments between 2022 and 2024, and utility payout ratios in the 60% corridor that remain standard—the claim that American States Water can hold an 8%-plus dividend CAGR as a structural feature is not supported by the earnings record. It is supported instead by rate base expansion, which requires the CPUC to continually approve annual capital budgets near $200 million while preserving an authorized return on equity of 10.06%.
Verdict. Management's operating and governance record survives scrutiny; the capital allocation record is clean but under-tested; and the dividend growth rate is best understood as a policy floor of 7% plus whatever the rate base delivers, not as a durable 8.5%. The KPI that confirms or falsifies it is the payout ratio: if it drifts through the low 70s while EPS growth stays in the 7% range, the dividend increases will have to converge toward the policy floor.
The one part of this business where a single bad night could break the arithmetic entirely sits four thousand feet up a mountain.
VI. Bear Valley Electric & The Wildfire Overhang
Big Bear Lake is a resort community in the San Bernardino Mountains—dense pine forest, ski runs, roughly 24,900 electric connections, and a fire ecology that has unsettled California utility investors since 2018. American States Water owns the local electric utility.
That ownership stems from historical circumstance rather than corporate design. Bear Valley operated as a division of Golden State Water Company from 1935 through 2020—a relic of an era when diversified regional utilities bundled whatever municipal infrastructure existed within their geographic footprint.18 What changed was liability risk. Bear Valley Electric Service, Inc. was incorporated in California on December 12, 2018, just six weeks after the Camp Fire destroyed the town of Paradise and pushed Pacific Gas and Electric toward bankruptcy. The CPUC authorized the corporate separation in decision D.19-12-039 on December 30, 2019, and GSWC completed the transfer of the electric utility's operating assets and liabilities into a standalone AWR subsidiary on July 1, 2020.18
The corporate reorganization was deliberate: American States Water insulated its water utility from its electric wires at the exact moment California reinforced strict liability for utility equipment.
Inverse condemnation, explained simply. Under California's legal doctrine of inverse condemnation, a utility can be held strictly liable for property damage caused by its equipment even if it was not negligent in operating or maintaining that infrastructure.2 The underlying legal theory is that an investor-owned utility, much like a government agency exercising eminent domain, should distribute the collective burden of wildfire damage across its broader ratepayer base. In practice, traditional tort defenses do not apply: if a BVES power line ignites a blaze, whether the company adhered to industry engineering standards is legally irrelevant. That liability exposure extends to water infrastructure as well: a municipal or private water system can face inverse condemnation claims for wildfire damage if the network fails to operate as designed, including instances where the water facilities are themselves damaged or incapacitated by the fire.2
The three mitigating factors. First, BVES operates exclusively as a low-voltage distribution network without the high-voltage transmission lines that sparked California's most catastrophic blazes. Its physical plant consists of roughly 87.8 miles of overhead 34.5-kilovolt sub-transmission lines, 495.89 miles of overhead 4.16- or 2.4-kilovolt distribution lines, 114.98 miles of underground cable, and 14 substations.2 Second, the operating entity is legally ring-fenced from the water utility, maintaining an independent credit facility that carries no parent-company guarantee; at year-end 2025, BVES posted an interest coverage ratio of 4.71x and a total funded debt ratio of 0.43, operating with comfortable covenant headroom.2 Third, state regulators have actively funded mitigation programs: California's Office of Energy Infrastructure Safety approved BVES's 2026–2028 Base Wildfire Mitigation Plan in November 2025.2
The residual risks. The primary operational friction lies in the timing of regulatory cost recovery, which the company's annual report states plainly: the CPUC does not authorize rate recovery of wildfire mitigation plan costs when approving the plan itself, deferring cost recovery instead to the subsequent general rate case.2 As a result, BVES must incur capital expenditures upfront and seek rate recovery years later. The January 16, 2025 electric rate case decision illustrates both that procedural lag and its eventual resolution: it established rates retroactive to January 1, 2023, authorized recovery for capital projects and incremental wildfire mitigation expenses incurred prior to 2023 that had been excluded from historical rates, raised the authorized ROE from 9.6% to 10.0%, and lowered the adopted cost of debt from 6.6% to 5.51%.2 Carrying unrecovered operational and capital balances across a two-year regulatory delay introduces meaningful balance-sheet friction.
Commercial liability insurance presents an even more immediate operational vulnerability. The company's 10-K disclosures describe the underwriting environment in candid terms: commercial policies that do not exclude wildfire liabilities are increasingly scarce, coverage may become unavailable on commercially viable terms, and BVES may not receive regulatory authorization to pass increased insurance premiums or uninsured wildfire losses through to customer rates.2 California's utility liability insurance market has effectively repriced coverage statewide, leaving a subsidiary that generates $9.6 million in annual net income with minimal capacity to absorb sustained premium inflation or retain severe liability without external relief.
A second, less obvious operational exposure at Bear Valley is entirely separate from fire ecology. BVES generates virtually none of its own electric power, purchasing the vast majority of its supply under wholesale contracts and relying on the spot market during peak demand spikes—which, in an alpine resort community, coincide with severe winter cold snaps and crowded holiday ski weekends.2 Purchased power expenses rose from $11.6 million in 2024 to $18.1 million in 2025, driven primarily by higher average wholesale prices per megawatt-hour.2 While a supply-cost balancing account shelters the utility from most volumetric and pricing swings over time, this volatility highlights the strategic value of a recently approved clean-energy asset: in December 2025, the CPUC authorized a $28 million capital expenditure, plus allowance for funds used during construction, for utility-owned solar generation and battery storage—capacity designed to satisfy roughly 18% of BVES's renewables portfolio standard mandate while establishing local generation and energy-shifting capability.[^9] For a mountain utility operating at the terminus of a constrained transmission corridor, developing local generation is less an environmental showcase than a critical resilience investment against wholesale power shocks.
The forward regulatory filing crystallizes that strategy. On January 30, 2026, BVES filed its general rate case application for the 2027–2030 cycle, requesting capital budgets of approximately $133 million over four years alongside roughly $17 million in additional advice letter projects, an authorized return on equity of 11.3%, an embedded cost of debt of 5.92%, an authorized capital structure comprising 60% equity and 40% debt, and an overall return on rate base of 9.15%.[^9]19
That 11.3% ROE request is the revealing metric. It sits 124 basis points above what Golden State Water is authorized to earn on its water rate base, with BVES requesting a richer equity capitalization to match. Management is explicitly pricing wildfire and operational risk into its cost-of-capital filing. Whether the CPUC endorses that premium represents the segment's defining regulatory milestone for 2027.
Historical falsification: is Bear Valley an unmitigated liability?
The claim under test, evaluated from both perspectives: bullish investors view BVES as a minor, well-insulated, rate-base-compounding business; bears view it as an unhedged catastrophe bond.
The disconfirming evidence against the bear thesis is concrete: across the regulatory and financial filings reviewed, BVES has recorded no catastrophic wildfire ignition events; its distribution-only topology lacks the high-voltage transmission lines that caused the Pacific Gas and Electric and Southern California Edison disasters; the operating subsidiary has been legally ring-fenced since July 2020; and state regulators have approved its wildfire mitigation plans while authorizing capital recovery, albeit with administrative delay.
The counter-evidence against the bull thesis is that none of those operational safeguards alters the underlying legal payoff structure. Under California's strict-liability inverse condemnation standard, a clean historical operating record carries limited predictive reassurance because liability does not require utility negligence—dry timber, extreme wind gusts, and local topography govern the outcome. The corporate asymmetry remains stark: Bear Valley contributes roughly 7% of consolidated net income while carrying an operational liability tail that could, in an extreme event, eclipse the market capitalization of the entire holding company.
Verdict. The historical record neither refutes nor validates the bear thesis, leaving the risk intact but unquantifiable by backward-looking performance—the defining dilemma of low-frequency, high-severity exposures. Investors must instead monitor observable regulatory proxies: whether the CPUC grants an authorized return on equity near the requested 11.3% in the 2027–2030 rate case, whether Bear Valley's commercial liability insurance coverage limits hold or compress at renewal, and whether regulators continue authorizing timely cost recovery for mitigation capital. An administrative decision that approves capital deployment while rejecting the requested risk premium would serve as an unmistakable warning sign.
Stepping back from these segment-level risks, a coherent set of structural principles emerges from more than seven decades of utility operation.
VII. The Playbook: Durable Business & Strategic Lessons
1. The inviolable moat of buried capital — with a political asterisk.
The 2,890 miles of pipeline buried beneath Southern California streets cannot be economically duplicated, and the adjudicated groundwater rights supporting them cannot be recreated.2 Customer churn is structurally zero, as switching water providers requires physically moving to another municipality. Furthermore, retail rates are established through administrative law rather than open-market pricing, meaning traditional commercial pressures—such as price wars, market share battles, or product substitution—simply do not exist.
The municipalization disputes in Ojai and Claremont, however, demonstrated the legal limits of that monopoly, elevating what could be seen as isolated battles into a core operational principle: in the water utility sector, an economic moat is breached through the political process or not at all, and the probability of that breach rises alongside retail customer tariffs. That reality transforms operational cost containment into a critical defensive discipline rather than a mere margin lever—which is precisely why the chief executive's long-term incentive program allocates 45% of its weighting to water segment operating expense achievement.16 Executive compensation design and municipal condemnation history reflect the exact same underlying business risk.
2. Regulatory judo: turning compliance capital expenditure into rate base.
For an industrial manufacturer, a new environmental mandate represents an uncompensated operating cost. For an investor-owned water utility, it serves as an earnings growth catalyst, because the capital deployed to achieve compliance is added to the regulated rate base and earns an authorized return. This dynamic represents one of the most counterintuitive mechanics of the utility business model.
In 2024, the Environmental Protection Agency finalized maximum contaminant levels for six PFAS compounds in drinking water and designated PFOA and PFOS as hazardous substances under CERCLA; the Lead and Copper Rule Improvements took effect alongside those mandates; and California's Division of Drinking Water established a hexavalent chromium standard of 10 parts per billion.2 Stripping out PFAS—the synthetic chemicals historically utilized in firefighting foams and industrial coatings—requires filtering water to trace concentrations measured in parts per trillion. In practical engineering terms, this necessitates building granular activated carbon or ion-exchange treatment facilities across dozens of impacted production wells. Golden State Water projects these mandates will materially elevate capital expenditures over the coming decade.2 Once prudently constructed and placed in service, every one of those filtration vessels earns an authorized rate of return.
The regulatory timeline governing these requirements remains fluid, directly influencing the multi-year cadence of capital deployment. In May 2025, the EPA announced an intention to extend the final PFAS compliance deadline by two years to 2031 without immediately publishing formal implementing rules; in September 2025, the agency asked the U.S. Court of Appeals for the D.C. Circuit to vacate the drinking water standards for four PFAS compounds—a petition the court unanimously rejected in January 2026.2 Shifts in federal regulatory policy therefore represent a tangible, if under-analyzed, variable for the utility's capital expenditure pipeline: if compliance schedules are stretched or standards relaxed, the near-term capital deployment schedule decelerates accordingly.
This regulatory dynamic also faces the same administrative boundary that led to the termination of the full revenue decoupling mechanism. Compliance capital generates an authorized return only if the CPUC determines the assets are prudent and used and useful in public service. The Commission preserves full statutory discretion to disallow expenditures it considers excessive, and the administrative review process with the Public Advocates Office exists specifically to scrutinize proposed capital outlays. Because rising customer bills and stricter treatment mandates arrive concurrently, ratepayer affordability concerns intensify precisely when capital investment needs peak. A regulatory commission facing consumer pushback can manage bill impacts through several administrative mechanisms short of outright capital disallowance: it can extend project amortization periods, reclassify projects into advice letter treatment where cost recovery is deferred until completion, or reduce the authorized cost of capital. GSWC experienced that procedural deferral directly when the 2025–2027 decision transferred $58.2 million of capital investments out of base rates and into advice letter filings, including infrastructure that had been under construction since 2023.[^9] While the utility preserved project economics through interest accruals in regulatory memorandum accounts, the decision underscores that regulators frequently manage customer rate shocks through timing delays. In utility ratemaking, the operational hazard is often not capital disallowance, but cash recovery deferral.
Litigation recoveries introduce an additional, frequently overlooked financial nuance to this environmental spending. Golden State Water has participated on the receiving end of PFAS settlement proceeds alongside its remediation outlays. As a co-plaintiff in nationwide class-action litigation against industrial chemical manufacturers—including DuPont, Tyco Fire Products, and BASF—GSWC and an ASUS operating subsidiary received approximately $17 million in settlement distributions during 2025, which were deposited into a dedicated regulatory memorandum account to fund PFAS-related capital and operational expenditures.2 The DuPont class settlement had been finalized on June 30, 2023, and received formal approval from the federal district court in South Carolina on February 28, 2024.2 While these recoveries meaningfully bolstered operating cash flow in 2025, their non-recurring nature means they should be separated from baseline cash generation when evaluating the ongoing business.
3. The barbell: rate base on one end, federal fee income on the other.
The foundational logic of the 1998 holding company restructuring was that the regulated water utility and the federal defense contracting business should not share the same capital structure. Golden State Water absorbs balance-sheet capital and converts it into an expanding rate base at an authorized return on equity. ASUS requires virtually no dedicated corporate equity, translating specialized operational expertise into firm-fixed-price management fees paid by the U.S. Treasury. This complementary structure explains why consolidated return on equity reached 12.5% in 2025—well above GSWC's authorized ROE of 10.06%—by producing roughly a fifth of corporate net income on negligible committed equity capital.2
The operational constraint remains the procurement cycle: contract wins at ASUS occur in discrete, multi-year intervals rather than steady annual increments, and the unit remains the smaller participant in a sector led by two scaled incumbents.
4. Not playing the roll-up game — a choice with a real cost.
Management's deliberate refusal to pay steep control premiums for municipal water acquisitions or diversify into natural gas distribution has protected American States Water's investment-grade balance sheet and preserved a focused operating model. Yet that conservatism carries an unavoidable structural cost: it leaves the enterprise almost entirely tethered to a single regulatory jurisdiction. More than three-quarters of consolidated earnings depend directly on rulings issued by five appointed commissioners in San Francisco.2 Industry peers that accepted higher balance-sheet leverage and operational integration challenges acquired geographic and political diversification across multiple state commissions in return. While capital discipline represents a defensible strategic posture, evaluating that record requires factoring in the geographic concentration it purchased.
The frameworks that follow make that strategic trade-off explicit.
VIII. Porter's 5 Forces & Hamilton Helmer's 7 Powers Analysis
Threat of new entrants: effectively zero. Duplicating an established water distribution network beneath municipal streets is barred by local franchise ordinances, blocked by physical right-of-way constraints, and economically unfeasible. There is no venture-backed disruption model in municipal water; software cannot transport physical gallons. The only meaningful path for displacement is a municipality exercising eminent domain—which represents municipal expropriation rather than commercial entry, and which the historical record in Ojai and Claremont proves is protracted, expensive, and legally unpredictable.
Supplier power: moderate-to-high, and structurally increasing. Golden State Water Company pumped roughly 52% of its water supply in 2025 and purchased the remaining 48%, primarily from regional wholesalers including the Metropolitan Water District of Southern California.2 Historically, the utility was largely insulated from wholesale tariff increases because the Modified Cost Balancing Account passed those costs directly through to ratepayers. That protection is now considerably weaker: under the Incremental Cost Balancing Account instituted in 2025, GSWC tracks per-unit price deviations but directly absorbs the financial consequences of supply-mix variances.2 Meanwhile, long-term allocation pressures along the Colorado River and environmental conveyance restrictions across the Sacramento-San Joaquin Delta indicate that imported water will become scarcer and more expensive over time.2 Supplier power is therefore rising in financial significance rather than receding—one of the most consequential structural shifts in the business following the 2025 regulatory reset.
Buyer power: zero structurally, formidable politically. Individual retail customers cannot switch to a competing water utility. Collective buyer power, however, is channeled directly through the CPUC's Public Advocates Office, which scrutinizes rate filings and negotiates multi-year rate case settlements. Cal Advocates was GSWC's formal counterparty in the 2025–2027 general rate case settlement, and the resulting regulatory decision eliminated the company's full revenue decoupling mechanism.8 Beyond administrative proceedings, ratepayer pushback can escalate to municipal ballot initiatives and condemnation litigation, as demonstrated in Ojai and Claremont.
Threat of substitutes: zero functionally, material volumetrically. Bottled water, residential cisterns, and industrial desalination cannot replicate grid-delivered potable water at municipal scale and regulated tariffs. While conservation is not a functional substitute, it now represents a direct volume headwind in a way it did not prior to January 2025, because the Monterey-style mechanism leaves baseline consumption declines with equity holders. The 2025 operating results—where customer water consumption fell nearly 4% below adopted rate-case forecasts—demonstrated that volumetric exposure in practice.[^9]
Rivalry: non-existent in regulated water, active in defense contracting. Golden State Water faces no commercial rivals within its franchised service territories. Competitive rivalry is concentrated entirely within ASUS, which competes against American Water Works and other operators for Department of Defense utility privatization awards—a procurement market where American States Water operates as the smaller of two scaled incumbents.15
Industry scale and the regulatory ceiling. American States Water remains a mid-sized operator among publicly traded peers. American Water Works spans multiple state jurisdictions with a market capitalization roughly an order of magnitude larger; Essential Utilities pairs regulated water operations with a large natural gas utility following its Peoples transaction; and California Water Service Group represents the closest structural peer, operating under the same CPUC jurisdiction, the same cost-of-capital index, and the same decoupling mandates.17
That shared regulatory environment matters more than the valuation spread. Because California Water Service Group, SJW Group, and Golden State Water litigate the same tariff and cost-recovery mechanisms before the same five commissioners, California utility regulation functions as an industry-wide ceiling rather than a company-specific variable. When the CPUC discontinued the full revenue adjustment mechanism, it applied the policy uniformly across the peer group. No degree of administrative advocacy enables one investor-owned utility to extract a fundamentally different regulatory outcome than its peers. Consequently, durable financial outperformance must be generated through operating expense discipline rather than regulatory exceptionalism.
Helmer's 7 Powers, applied honestly.
Cornered Resource — high, and the most durable of the seven. Golden State Water's adjudicated groundwater rights of 70,362 acre-feet per year across Southern California basins represent a classic cornered resource: legally finalized, geographically irreplaceable, and inaccessible to any potential entrant except through the acquisition of an existing rights holder.2 The 50-year federal utility concessions at ASUS represent a comparable structural asset, accompanied by an important operational qualification: winning a concession through competitive defense procurement roughly once every other year secures a cornered resource after the award, but provides no proprietary mechanism for winning the next one.
Switching Costs — high, and practically insurmountable at the retail level. Terminating water service requires a household or business to physically relocate outside the utility's service territory. At the retail consumer level, switching costs are as close to absolute as utility economics permit.
Scale Economies — moderate, and primarily local. Centralized water-quality testing laboratories, an administrative team seasoned across decades of CPUC ratemaking, and SCADA monitoring networks spread over 265,200 customer connections provide genuine fixed-cost leverage. However, with approximately 900 employees across all operating subsidiaries, the enterprise is substantially smaller than national peers like American Water Works.2 Scale advantages provide an operating edge over fragmented municipal systems, but deliver little procurement or cost leverage relative to larger investor-owned utilities.
Process Power — moderate, and the primary operational differentiator. The institutional capability required to prosecute complex general rate cases before the CPUC—forecasting operational expenditures across multiple regional districts, negotiating settlements with the Public Advocates Office, and managing advice letter memorandum accounts—cannot be quickly duplicated or easily recruited. The 2025–2027 rate case settlement, which secured financing-cost compensation for construction work on advice letter projects, stands as a tangible product of that administrative capability.[^9] Seventeen years of executive continuity between the chief executive and chief financial officer has institutionalized that regulatory playbook.
Counter-Positioning, Network Economies, and Branding — absent. American States Water enjoys no counter-positioning advantages, as no incumbent business model prevents peer utilities or municipal operators from adopting identical operational methods. Physical water distribution networks exhibit no demand-side network effects, where additional connections do not enhance the utility of the network for existing users. Finally, consumer branding in investor-owned water operates closer to a political liability than an economic asset: high brand visibility during general rate case debates or retail tariff adjustments often serves as the primary catalyst mobilizing municipal condemnation campaigns.
These structural forces and power dynamics define the boundaries of the investment debate, establishing the foundation for the competing bull and bear theses.
IX. Bear vs. Bull Case & The 3 Critical KPIs
The bull case, stated at its strongest.
The primary pillar of the bull thesis is not the dividend yield, but rate-base compounding. Golden State Water expanded its adopted rate base at an 11.3% compound annual rate over five years—an exceptional pace for regulated utility assets—and management is attempting to sustain that trajectory with an approximately $1 billion capital expenditure request for the 2028–2030 cycle, a roughly 75% increase over the $573.1 million authorized for 2025–2027.[^9]118 If the CPUC approves an investment program near that magnitude, the core earnings engine remains primed for multi-year expansion.
Furthermore, the authorized return supporting that expanding capital base is locked and competitive. An authorized return on equity of 10.06% paired with a 57% equity capital structure remains in place through December 31, 2027, with the next cost-of-capital filing deferred until 2028—providing a rare multi-year window of regulatory certainty in California.2[^9]
The balance sheet maintains ample capacity to finance this capital program without relying on dilutive share issuance. A consolidated debt-to-capitalization ratio of 0.48 against a 0.65 covenant limit, Golden State Water's debt-to-EBITDA ratio of 3.4x against an 8.0x ceiling, and solid investment-grade credit ratings of A at the holding company and A+ at the water utility provide sufficient debt capacity to fund infrastructure outlays—explaining why management is winding down its at-the-market equity program.21[^9]
Environmental mandates provide an ongoing pipeline of non-discretionary capital deployment. Federal standards for PFAS, updated Lead and Copper Rule improvements, and California's hexavalent chromium limit effectively convert mandatory environmental compliance into rate-base assets earning authorized returns, with the D.C. Circuit's January 2026 decision upholding four PFAS maximum contaminant levels preserving that investment pipeline.2
Finally, operational results heading into late 2026 have demonstrated that underlying momentum. Diluted earnings per share of $3.37 in 2025 represented a 10.9% increase over 2024's adjusted $3.04, while second-quarter 2026 earnings reached $1.09 per share—a 25.3% year-over-year increase driven by revised rates, a 4% increase in customer water consumption, and a favorable supply mix.[^9]1
The bear case, stated at its strongest.
The bear thesis begins with the structural erosion of the utility's earnings protections. In January 2025, the CPUC's termination of the full Water Revenue Adjustment Mechanism and Modified Cost Balancing Account shifted baseline volumetric consumption risk and supply-mix volatility from ratepayers directly onto equity holders.2 Although GSWC and its peers prevailed before the California Supreme Court on procedural grounds in July 2024, the Commission reaffirmed its policy position six months later in its January 2025 decision, demonstrating the practical limits of courtroom victories against administrative regulators.98 While higher-than-modeled groundwater pumping masked a nearly 4% demand decline in 2025, temporary well outages in the first quarter of 2026 forced an expensive reliance on purchased wholesale water, directly depressing quarterly earnings.[^14] Similarly, the earnings rebound in the second quarter of 2026 was aided by a 4% consumption rebound and favorable supply sourcing—the precise operational variables that turn into earnings headwinds during cool, wet weather cycles.1
Second is political and geographic concentration. More than three-quarters of consolidated profit remains tied to a single regulatory body in Sacramento, where an ambitious $1 billion capital expenditure proposal will test ratepayer affordability tolerances just as the litigation moratorium in Claremont expires around 2029.
Third is the wildfire liability tail at Bear Valley Electric. California's strict-liability inverse condemnation doctrine, combined with a severely hardening commercial insurance market and an electric subsidiary that generates just $9.6 million in annual net income, creates an asymmetric tail risk that operational mitigation plans cannot fully eliminate.2
Fourth is the reality of contract growth at ASUS. Across more than two decades of defense contracting, American States Water has secured concessions at eleven installations, trailing American Water Works' portfolio of eighteen military bases, with $29.4 million in new construction awards logged in 2025 and 2026 segment earnings guided to a modest $0.63 to $0.67 per share.[^9]15 The division functions as a highly dependable, capital-light annuity rather than an accelerating growth engine.
Fifth is the mathematical tension embedded within the dividend streak. Cash distributions have grown at an 8.5% compound annual rate over five years, outpacing underlying earnings growth and pushing the payout ratio toward 65%, even as Wall Street research coverage remains largely passive, with consecutive earnings calls passing without a single analyst question.12[^9][^14] For an enterprise whose primary capital-markets identity is a 72-year dividend growth streak, the institutional pressure to maintain high-single-digit payout increases through periods of slower earnings expansion creates a subtle capital allocation strain that warrants ongoing scrutiny.
An emerging operational risk carries unique contractual stakes across the defense portfolio: cybersecurity. The company's annual report identifies ransomware as the most significant threat to its operational infrastructure, highlights supervisory control and data acquisition (SCADA) network intrusion as a key vulnerability, and explicitly warns that a security compromise could disqualify ASUS from future awards, trigger contractual penalties, or prompt contract termination by the Department of Defense.2 While the enterprise mandates quarterly cybersecurity training for all staff, specialized annual instruction for ASUS personnel, and formal governance policies around generative artificial intelligence, the consequence profile is asymmetrical.2 For a conventional municipal utility, a cyber disruption is an operational and reputational challenge; for a defense contractor managing infrastructure on sovereign military installations, a breach represents an existential procurement risk with a federal counterparty that enforces stringent national security standards.
Sixth is the sector-wide duration headwind. Regulated water utilities trade as long-duration equities sensitive to interest rate benchmarks, and compensation disclosures illustrate the resulting valuation derating: across 72 publicly traded U.S. utilities tracked by Standard & Poor's, the non-weighted three-year annualized total shareholder return through December 31, 2025 averaged positive 14% for electric utilities, 9% for gas distributors, 7% for multi-utilities, and negative 5% for water utilities, as institutional capital rotated toward power providers benefiting from electrification and data-center load growth.16 Although American States Water led its seven publicly traded water peers over five years, its total return ranked in the third quartile over three-, seven-, and ten-year horizons.16 Outperforming a derating peer group highlights operational resilience, but it cannot fully counteract sector-wide valuation compression.
Where the evidence actually lands. The thesis of fundamental operational durability holds: American States Water retains essential monopoly assets, adjudicated groundwater rights, and an established rate-base compounding model that will continue generating regulated returns over the next two decades. What does not survive scrutiny is the characterization of the equity as an insulated, bond-proxy asset. Between 2008 and 2024, Golden State Water operated under a regulatory structure that fully insulated earnings from weather, drought mandates, and wholesale price shocks. Since January 2025, that insulation has been partially dismantled, exposing quarterly net income to volumetric swings and well-field operational reliability. Investors who valued the equity as an untouchable utility annuity now own a partially recoupled business exposed to operational and regulatory variables that are only beginning to be reflected in quarterly financial comparisons.
The three KPIs that matter.
1. Golden State Water's adopted average rate base and the outcome of the 2028–2030 general rate case. Rate-base expansion remains the primary driver of enterprise value, having grown from $980.4 million in 2021 to $1,673.2 million in 2026.[^9] The rate-case application filed in July 2026 under docket A.26-07-001 represents the most consequential forward catalyst for the company;10 the specific capital expenditure authorized by the CPUC against the company's proposed $1 billion request will dictate underlying earnings growth through 2030. Key milestones to track include the terms of any joint settlement reached with the Public Advocates Office—where these multi-year dockets are traditionally resolved—and whether regulators consider restoring full revenue decoupling.
2. The quarterly variance between actual water consumption, the supply mix, and adopted rate-case forecasts. Prior to 2025, this operational variance was neutralized by regulatory balancing accounts; today, it dictates whether quarterly earnings track rate-base expansion. The sensitivity is evident across recent quarters: a nearly 4% consumption deficit in 2025 was offset by favorable internal pumping, temporary well outages in the first quarter of 2026 generated an adverse wholesale supply drag, and a 4% consumption surge paired with favorable sourcing lifted second-quarter 2026 earnings.[^9][^14]1 This operating spread represents the metric that transforms an unusually wet winter or localized mechanical maintenance into a quarterly earnings revision.
3. ASUS concession awards and newly contracted construction project volumes. While the military contracting segment's operational cash annuity remains secure, its pace of growth remains the unresolved debate. Investors must track new 50-year privatization awards alongside the annual volume of newly authorized capital upgrade construction projects, which totaled $29.4 million in 2025.[^9] An acceleration in contract wins would confirm ASUS as an expanding growth vector, whereas sustained stagnation at current award volumes would solidify its role as a stable, capital-light contributor delivering roughly one-fifth of consolidated net income.
X. Epilogue & The Next 50 Years
There is a version of the American States Water story frequently presented at dividend conferences that is mostly true yet subtly incomplete. In that telling, the company has increased its cash payout for 72 consecutive calendar years simply because it distributes an indispensable commodity within an infrastructure franchise no competitor can enter, with the implication that the streak will persist indefinitely because it always has.
The more accurate view is that American States Water has endured by mastering a demanding and unglamorous operational discipline: deploying capital into regulator-approved rate base at a pace that does not push customer tariffs to the point where local voters mobilize to condemn the system. Striking that balance is far more complex than standard utility narratives suggest. Ojai proved that municipalization can succeed. Claremont demonstrated that even prevailing requires years of contentious courtroom battles and millions of dollars in legal and administrative friction.
The recent operating record shows that this model is not rigid—it bends. It bent in 2022, when an eighteen-month regulatory delay reduced reported earnings per share by 17% during a period when underlying utility operations remained sound. It bent again in 2025, when the revenue decoupling mechanism the utility had relied on since 2008 was discontinued by the CPUC, vacated on procedural grounds by the California Supreme Court, and promptly eliminated by the regulator once more. Yet each time the enterprise adapted: the rate base continued to compound, and the dividend increased. The historical record reflects operational resilience and regulatory recovery rather than structural immunity.
The critical question ahead is narrower than the sweeping themes often raised around western water scarcity. It centers on how the CPUC resolves Golden State Water's proposed $1 billion capital plan for the 2028–2030 rate cycle: the volume of infrastructure investment regulators authorize, the return on equity they approve, and whether any revenue stabilization mechanisms are reinstated. Every other strategic initiative—from PFAS filtration facilities and the Sutter Pointe development to new defense concessions at ASUS and wildfire mitigations at Bear Valley Electric—remains secondary to that administrative outcome. If the Commission's decision accommodates that capital program, rate-base compounding will continue near its recent cadence. If California's ratepayer affordability politics constrain bill increases, the physical distribution network will remain buried and irreplaceable, continuing to earn a return—only at a slower and more contested pace.
Stripped of promotional framing and dividend milestones, that dynamic reflects the fundamental reality of an investor-owned utility: a durable economic claim on an indispensable physical asset, whose ultimate financial return is determined by a regulatory body answering to a broader public. The pipes underground remain permanent. The return on them never was.
References
-
American States Water Company Announces Second Quarter 2026 Results (Form 8-K, Exhibit 99.1) — U.S. Securities and Exchange Commission, 2026-08 ↩↩↩↩↩↩↩↩↩↩↩
-
American States Water Company Form 10-K for the Fiscal Year Ended December 31, 2025 — U.S. Securities and Exchange Commission, 2026-02-18 ↩↩↩↩↩↩↩↩↩↩↩↩↩↩↩↩↩↩↩↩↩↩↩↩↩↩↩↩↩↩↩↩↩↩↩↩↩↩↩↩↩↩↩↩↩↩↩↩↩↩↩↩↩↩↩↩↩↩↩↩↩↩↩↩↩↩↩↩
-
American States Water Company — Company History — Reference for Business ↩↩↩↩
-
American States Water Company Announces New Name for Southern California Water Company — American States Water Company ↩
-
American States Water Company Announces Agreement to Resolve Litigation and Eminent Domain Action of Its Ojai Water System — Business Wire, 2017-04-13 ↩
-
Water wars, part 2: after the ruling, a reckoning — Claremont COURIER ↩
-
American States Water Company Announces Final Decision by the CPUC in Its Water Utility General Rate Case Proceeding (Form 8-K, Exhibit 99.1) — U.S. Securities and Exchange Commission, 2025-01-30 ↩↩↩↩↩
-
Golden State Water Co. v. Public Utilities Commission, S269099 — Supreme Court of California, 2024-07-08 ↩↩
-
Golden State Water Company Prepared Testimony, Application A.26-07-001 (2028-2030 General Rate Case) — California Public Utilities Commission, 2026-07 ↩↩
-
American States Water Q2 2026 slides: EPS jumps 25% on rate gains — Investing.com, 2026-08 ↩↩
-
10 U.S. Code § 2688 — Utility systems: conveyance authority — Legal Information Institute, Cornell Law School ↩
-
American States Water Company Announces New Privatization Contract Award at Naval Air Station Patuxent River, Maryland — Business Wire, 2023-08-16 ↩
-
NAVFAC awards cost saving utilities contract for Naval Air Station Patuxent River — Naval Facilities Engineering Systems Command, 2023 ↩
-
Military Services Site Locations — American Water Works Company ↩↩↩
-
Definitive Proxy Statement on Schedule 14A for the 2026 Annual Meeting — U.S. Securities and Exchange Commission, 2026 ↩↩↩↩↩↩↩↩
-
Essential Completes Transformational $4.275 Billion Acquisition of Peoples — Essential Utilities, Inc., 2020-03 ↩↩
-
Corporate Reorganization Plan BVES, Inc. — Bear Valley Electric Service, Inc. ↩↩
-
Application of Bear Valley Electric Service, Inc. for Authority to Increase Rates for Test Year 2027 — Bear Valley Electric Service, Inc. / California Public Utilities Commission, 2026-01-30 ↩
 LinkedIn
 WhatsApp
 Reddit
 Hacker News
 Email
Email Kindle
 RSS Feed
 Spotify
 Apple Podcasts
 Amazon Music
 Audible
 YouTube