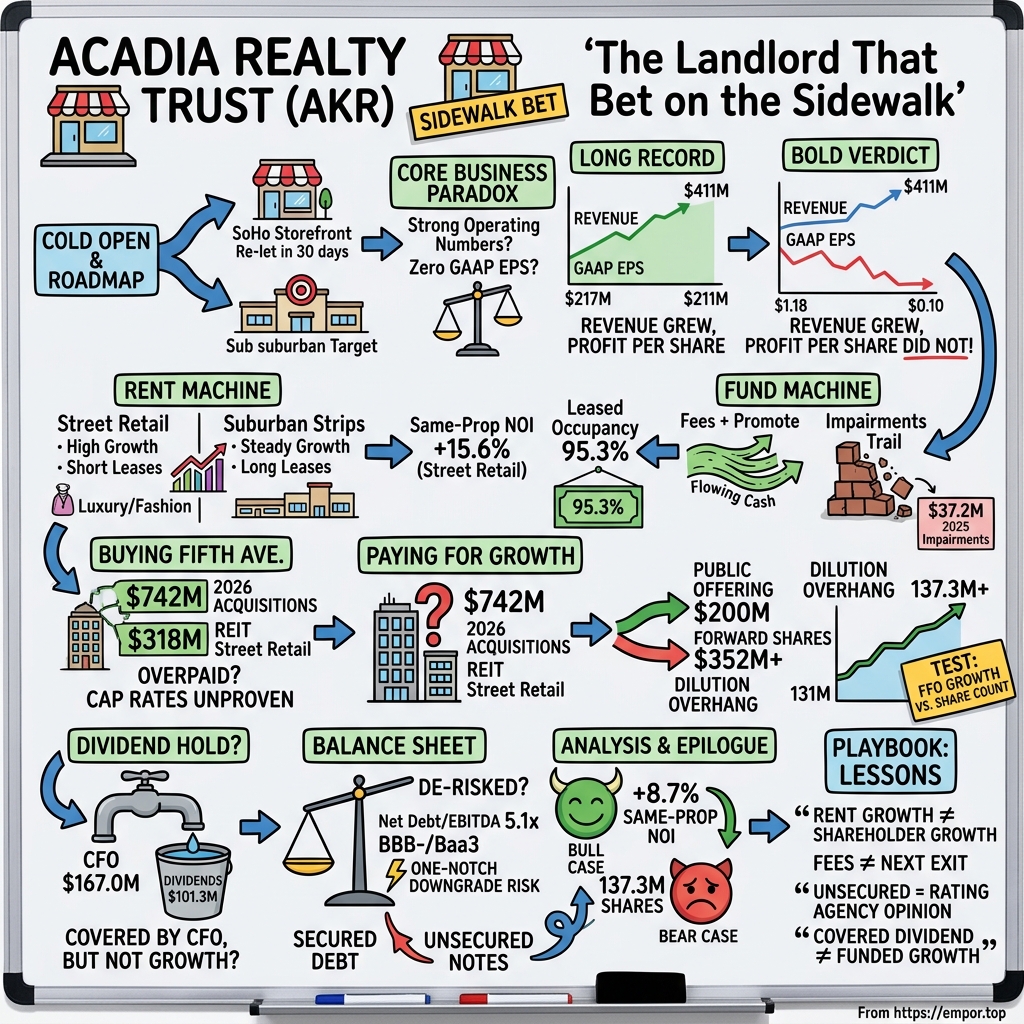
Acadia Realty Trust: The Landlord That Bet on the Sidewalk
I. Cold Open & Roadmap
Start on Greene Street in SoHo. Cast-iron facades, cobblestones, display windows taller than most apartments. On this block a storefront sits between tenants, looking like a gap in a row of teeth. To a passer-by it is just an empty shop. To a landlord it is an option: the old lease is gone, the market rent has moved, and the next tenant will sign at today's price, not yesterday's.
Now walk north to 129 Fifth Avenue. In 2026 its owner re-let space there within 30 days, at a yield the company described as above 9%.4 In a city where trophy retail usually trades at yields that make bond investors wince, a 9% yield on Fifth Avenue is a headline.
Then leave Manhattan and drive to a suburban strip centre anchored by a Target. There is a big parking lot, a nail salon, a mattress store, and a lease that rises a little every few years whatever the economy does. It is not glamorous, but it is steady.
One company owns both worlds. Acadia Realty Trust (NYSE: AKR) is an internally managed real estate investment trust with about $411m of 2025 revenue.7 It runs a co-investment fund business on top of its property portfolio. Over the past three years it has bet that the sidewalks of SoHo, the West Village, Williamsburg and Armitage Avenue are worth more than the parking lots of suburbia, and it has sold shares heavily to make that bet.
That brings the paradox. The operating numbers are as strong as they have been in a decade. GAAP earnings per share are close to zero. The weighted share count rose from about 95m in 2023 to about 131m in 2025, and shares outstanding have kept rising in 2026.71 At $18.63 on the last close, the stock sits near its 52-week low of $18.45, down from a high of $23.03.6
This story is organised around four questions:
- Is street-retail growth strong enough to pay for the equity dilution?
- Is the balance sheet being de-risked, or just re-labelled?
- How much of the earnings comes from the fund platform and note interest, and how safe is it?
- Does the dividend hold without new equity?
A short briefing on the structure
Acadia reports two businesses. The "REIT Portfolio" is the core: properties it owns outright or nearly so, now increasingly street and urban retail in New York, Chicago, Washington, Boston, San Francisco and Los Angeles, alongside a legacy suburban book.11 "Investment Management" is a set of funds, Funds II through V plus Mervyns II, in which Acadia invests alongside institutional partners, charges fees and, if returns clear a hurdle, earns a "promote", the real-estate world's version of carried interest.1
Here is the accounting trap. Many fund assets are consolidated, so their revenue, debt and losses appear in Acadia's statements at 100%, while Acadia owns only a slice. The headline figures overstate what shareholders actually own. Keep that in mind throughout: when this story says "Acadia's share", it means the economic slice, not the consolidated total.
To see why the paradox matters, start with the long record, because it is less flattering than the current quarter.
 Subscribe on LinkedIn
II. The Long Record: Growing Revenue, Not Profit
Picture a ten-year chart with two lines. The first, revenue, climbs steadily from about $217m in 2015 to about $411m in 2025.7 The second, GAAP earnings per share, runs the other way, from $1.18 in 2014 to about a dime in 2025.7 Two lines crossing like that is the oldest warning in public markets: the company got bigger, and each shareholder did not get richer.
Revenue compounded at about 6.6% a year over the decade and about 10.4% a year over the last five.7 Those are respectable for a landlord. The issue is the denominator. The weighted share count was about 95m in 2023 and about 131m in 2025.7 Over the longer stretch since 2014 it has more than doubled from about 59m.7
Kenneth Bernstein's long game
The man behind the chart is Kenneth Bernstein, chief executive since 2001.11 He has led Acadia through three different identities. He began with a suburban shopping-centre REIT in the north-east. He then built one of the earliest fund platforms among listed retail landlords, raising institutional capital to buy distressed and opportunistic retail, including the Mervyns department store real estate. Finally, starting well before 2023 and accelerating after it, he moved the core portfolio onto high streets.
Bernstein's style is that of a patient deal-maker rather than an operator obsessed with quarterly smoothness. He talks about "dislocations" and "mispricings", and the fund model is built to exploit them. That instinct produced wins. It also produced the mistakes the funds still carry, as Section IV shows. Two decades with one leader means investors can judge him on a full cycle, not on promises.
Why GAAP misleads, and why FFO still has to be divided
A REIT's GAAP earnings are a poor guide to its cash economics. Accounting rules make a landlord depreciate buildings that often rise in value, so a large non-cash charge sits in every year. Impairments arrive in lumps when values fall, and gains arrive in lumps when properties sell. That is why Nareit, the industry body, created Funds From Operations (FFO): net income with real-estate depreciation, impairments and property-sale gains stripped out.8
Acadia's GAAP history shows why. Net income was a healthy $65–72m a year in 2014–16, when large disposition gains flattered it, and has been negative or near zero in most years since 2018.7 Even FY2025 cannot be pinned down cleanly. Standardised data shows about $13.6m on the income-statement line and −$39.2m on the cash-flow line, while summaries of the 10-K put it nearer $16.9m.7 The differences come from how noncontrolling interests and fund results are allocated. This story does not pick one. The honest conclusion is that GAAP profit is small whichever line is used.
FFO is the right lens, but it is not a free pass. FFO per share is what an owner of one share receives in recurring earnings, and if the company issues shares faster than FFO grows, total FFO can rise while each owner falls behind.
The 2026 setup
Management's own measuring stick is "FFO As Adjusted", which strips out more volatile items such as promote income and certain gains. Its 2026 guidance is $1.24–1.26 per share, which management says is about 10% growth at the midpoint.3 That is the claim to test.
One wrinkle in the 2026 numbers might look like weakness: first-half revenue fell to $198.4m from $205.0m a year earlier.1 The 10-Q ties the decline to properties sold. Selling assets and reinvesting the proceeds shrinks revenue before it rebuilds it, so this reads as recycling, not softer rents.
The verdict on the long record is blunt. It does not support calling Acadia a growth compounder. Revenue grew; profit per share did not. The 2023–26 street-retail pivot is management's claim that the pattern has broken. That claim is unproven until FFO per share outgrows the share count for several years in a row. To judge whether it can, look at how the rent machine actually works.
III. How the Rent Machine Works: Street Retail vs. Suburban Strips
Every quarter, on the earnings call, Acadia's leasing team reaches for one phrase above others: "double-digit cash leasing spreads".4 It sounds like jargon, but it is the whole investment case in four words. A cash leasing spread compares the rent on a new or renewed lease with the rent the previous tenant paid in its final period. Double digits means the new tenant pays at least 10% more for the same space.
The two kinds of lease
The pricing unit in retail property is rent per square foot per year. How that rent moves depends on the kind of property.
A suburban strip centre typically uses long, triple-net leases. The tenant pays the base rent plus its share of taxes, insurance and maintenance, and the base rent steps up by a small fixed amount every few years. A Target might sign for ten or twenty years with options to extend. Good for predictability, bad for capturing a boom: if the market rent doubles, the landlord waits for the lease to end.
Street retail works differently. Leases are shorter, built-in bumps are often larger, and the tenant mix leans to fashion, luxury, beauty and "digitally native" brands that want a flagship. When a lease rolls in a hot corridor, the landlord marks the space to market. That is the engine behind Acadia's numbers, and it cuts both ways. Shorter leases mean more upside when rents rise and more vacancy risk when they fall. A Greene Street shop is worth more in a boom and is harder to fill in a bust.
What the engine is producing
The recent results are strong. Same-property net operating income (NOI), which compares the same buildings year over year and strips out acquisitions and sales, grew 8.2% in Q3 2025, 5.9% in Q1 2026 and 8.7% in Q2 2026.32 Within that, street retail rose 15.6% in Q2 2026.3 For context, open-air shopping-centre REITs typically report same-property NOI growth of roughly 3–4% in a good year, so Acadia's street book is growing several times faster than a typical strip centre.
Occupancy has room to rise. At the end of March 2026, leased occupancy was 95.3% and economic occupancy, meaning tenants actually paying rent, was 94.1%.2 The gap between the two is signed leases where rent has not started. That gap is near-term income already contracted.
Q2 2026 revenue was $95.4m, of which $91.2m was rental income.3 In other words, about 96% of the top line is rent. Fees and other income are the remainder.
The conclusion is that demand for Acadia's best streets is real and is converting into income now. The limit is time. This is two to three quarters of standout data within one rent cycle, and New York street rents fell hard between roughly 2015 and 2020 before rebounding. A rent recovery is not a moat. The street-retail thesis is supported, not proven, until it survives a luxury or consumer slowdown.
Who else wants these streets
Prime street retail is scarce in a physical sense: there is only one block of Greene Street between Prince and Spring. It also faces less pressure from e-commerce than enclosed malls do, because flagship stores double as advertising and as showrooms for online sales. In many cases, brands that once lived online now want a physical address precisely because it is scarce.
The competitive set splits in two. In open-air shopping centres, Acadia is a small player next to Federal Realty, Regency Centers and Kite Realty, whose market values are about $9.2bn, $13.1bn and $4.9bn against Acadia's roughly $2.6bn.6 On the high street, the competition is Vornado in Manhattan, Kimco in mixed formats, and a deep pool of private capital: family offices, sovereign funds and private-equity real-estate funds, which bid on the same corners without a public share price to defend. That last group matters most, because it sets the clearing price for the assets Acadia wants to buy.
The tenants
Acadia's tenant base is not dangerously concentrated. A supplemental excerpt lists Target as a top tenant with three stores, about 409,000 square feet, about $8.3m of annual base rent and 7.0% of pro rata leasable area.11 Target is a large share of space but a much smaller share of rent, which shows the gap between the cheap suburban square foot and the expensive city one. The company does not foreground its top-five or top-ten tenant shares in its quarterly releases.
The concentration that matters is not one name. It is one kind of tenant. The street book depends on fashion and luxury brands, such as the Amiri storefront on Greene Street.4 Those tenants rise and fall together with high-income spending and tourism. Diversified by name, concentrated by theme.
The rent ledger
Collection looks healthy. Rents receivable fell to $55.4m at 30 June 2026 from $65.0m at year-end.1 Part of any REIT's receivable is "straight-line rent", an accounting asset created by spreading future rent bumps evenly across a lease. It is not cash a tenant owes today. Acadia does not break out the straight-line share or the ageing in its quarterly releases, so the decline is best read as a mildly positive signal, not proof.
So the operating engine is running hot. The harder question is what sits next to it: a fund platform whose income is lumpier and whose record is mixed.
IV. The Fund Machine: Fees, Promotes and the Impairment Trail
In 2026, Acadia's funds sold assets at about 1.9 times the equity invested, gross.3 For a real-estate fund, nearly doubling the money is a good outcome and the kind of exit that pays a promote. In the same year that management celebrated those exits, the 2025 accounts carried $37.2m of impairments in Funds III and IV.7 Both facts describe the same machine. That is the point of this section.
How the fund model works
Imagine a restaurant that cooks its own meals and also runs a catering business with outside partners. The catering business uses other people's money. The restaurateur puts in a slice of capital, earns a management fee on the total, and earns a bonus, the promote, if the partners' returns clear an agreed hurdle.
That is Acadia's Investment Management platform. Institutional partners provide most of the capital. Acadia co-invests, manages the properties, and collects fees plus promote. The debt at the fund level is generally non-recourse, which means lenders can seize the fund's property but cannot come after Acadia's corporate balance sheet.1
The model has real appeal: Acadia can deploy more capital than its own balance sheet would allow, it earns fees whatever happens, and it can buy opportunistic assets that would not fit in the core portfolio. In 2026 it was busy. The funds recorded about $715m of year-to-date dispositions and $504m of recapitalisations.34 Investment Management also accounted for $424m of the year's acquisitions.4
The drawback is lumpiness. Fees are steady, but promotes arrive only when funds exit successfully, and exits depend on markets. The fees also come from vehicles Acadia itself controls and consolidates, so they are related-party income by construction. Acadia lists those arrangements in the related-party notes of its 10-K, but it does not present fees and promote as a share of FFO in its quarterly releases, which leaves investors to estimate how much of the earnings depend on the fund cycle.
The impairment trail
A capital-allocation claim has to face the fate of earlier capital. The $37.2m of 2025 impairments is that test. Because outside partners own most of these funds, only about $8.9m of the loss fell to Acadia after noncontrolling interests.7 The structure did what it was built to do: it spread the pain. But an impairment is still a statement that assets were bought or held at more than they turned out to be worth.
These write-downs were not a one-year accident. Funds III and IV invested in the decade before the pandemic, in suburban centres and urban redevelopments, some of which struggled as retail rents fell between roughly 2016 and 2020. City Point in downtown Brooklyn, a fund-era redevelopment, became the most visible example of a project that took longer and cost more to stabilise than planned. Gains have come in one-offs too: a $4.4m realised gain on Albertsons shares in Q3 2025 was a legacy of the Mervyns-era investments, not a repeatable income stream.7
Weighing it: the impairments are moderate in scale to Acadia's share, concentrated in older vintages, and partly offset by 2026 exits at about 1.9x. Peer fund managers in opportunistic retail have suffered far worse. The record does not reject the fund platform, but it narrows the claim. Fund income should be treated as a lower-quality slice of earnings, valuable but cyclical, until the company shows its share of FFO and a run of exits at or above the 1.9x benchmark.
The note book
There is a quieter source of income: structured lending. Acadia holds notes receivable of about $154.5m net, with an allowance for credit losses of about $2.2m, about 1.4%.1 Interest income was $23.7m in 2025, after $25.1m in 2024 and $20.0m in 2023.7
That interest is large next to the company's GAAP profit. Standardised data shows a 2025 pre-tax loss of about $39.6m on one presentation.7 On any line, the note book is a meaningful contributor. A 1.4% reserve on loans to retail real estate looks thin if property values fall. Mezzanine and preferred-equity positions sit behind senior lenders, so a borrower's distress hits them first. The answer depends on the collateral and the borrowers, which Acadia describes in its 10-K notes rather than in its quarterly releases.
The conclusion for this section: fund and note income is real, but it is lumpy, partly self-referential, and backed by a record that includes write-downs. It does not break the investment case, but it should not be valued like contractual rent. With that in mind, turn to the core portfolio's most important bet: what Acadia paid for its new streets.
V. Buying Fifth Avenue: Did Acadia Overpay?
On 14 September 2026, Acadia published an investment and leasing update. The headline number was $742m of 2026 acquisitions, split between $318m of street retail for the REIT Portfolio and $424m for Investment Management.4 Management reiterated its target of $400–500m of street-retail acquisitions a year.4 For a company with a market value near $2.6bn, that is a buyer's pace.6
The case for the deals
The cleanest evidence is 129 Fifth Avenue. Acadia re-let space there within 30 days at a yield the company put above 9%.4 Yield here means annual net operating income divided by the price paid. If you buy a building for $100 and it produces $9 a year after operating costs, the yield is 9%. Acadia borrows at roughly 5.5% on ten-year unsecured debt, so a 9% yield leaves a positive spread.9
The argument for buying now is timing. New York street rents fell for roughly five years before the pandemic and then rebounded, so prices on many corners have not caught up with the new rents. Buy at yesterday's price, re-let at today's rent, and the yield jumps. That is the mark-to-market engine from Section III, applied to acquisitions.
The case against
Two deals do not make a record. Acadia does not publish a cap rate for every acquisition, and the blended yield on the $318m of 2026 street retail is not disclosed. Without it, investors cannot benchmark the portfolio against Federal Realty, Regency or Kite, or against private-market street-retail sales.
The trickier issue is competition for the same assets. Private buyers who do not need to show a quarterly FFO per share can accept lower yields. If Acadia must outbid them, it either accepts a lower yield or buys the deals they pass on. The 9%+ example shows Acadia can find good deals. It does not show the average is that good.
Where the money went
The investing record shows the scale of reinvestment. Capital expenditure on property rose from $59.0m in 2022 to $80.3m in 2024.7 In 2025, standardised data shows no separate capex line but about $476m of "other investing" outflow, which bundles acquisitions, fund investments and redevelopment.7 That figure needs the 10-K cash-flow statement to split. Either way, Acadia is investing heavily, and with outside money, not retained cash.
Recycling is part of the record. The funds sold at about 1.9x, and the REIT has sold suburban assets to fund street buys.3 Selling a mature strip centre and buying a street asset with more rent upside is sensible portfolio management, as long as the new asset's yield after capex beats the old one.
Platform cost is the final check. G&A rose from $40.6m in 2024 to $45.7m in 2025, about 11% of revenue.7 That is high next to large shopping-centre REITs, which spread overhead over much larger portfolios. Running a fund platform and a deal-heavy acquisition programme is staff-intensive. The question is whether G&A grows more slowly than the asset base. One year of 13% G&A growth on 14% revenue growth is neutral, not a sign of scale economies.
Discipline, then a buying spree?
A pattern that damages investor trust is promising balance-sheet discipline and then buying aggressively right after. Acadia's messaging since 2025 has paired the two. Management has talked up deleveraging and the investment-grade rating in the same releases that announce acquisitions.34 So far, leverage has fallen while buying accelerated, because equity paid for much of it. That is consistent, not contradictory, but it moves the burden onto the share count.
The verdict: the entry yields look attractive on the cited deals, and the logic of buying below replacement rent is sound. But two data points are not a record, and the company publishes little on the yields of the rest. Intact but unproven. That brings the story to the price of the strategy: the shares.
VI. Paying for Growth: Dilution and the Forward-Share Overhang
Picture the Q2 2026 earnings release. Alongside the leasing numbers sat the capital-markets activity. Acadia completed a $200m public offering. It settled 3.8m forward shares for $72.1m. And it still had 17.8m forward shares, about $369m, waiting to be settled.31 By the September update, about $352m of net proceeds remained under forward agreements.4
What a forward sale is
A forward sale lets a company lock in today's share price but receive the cash, and issue the shares, later. Imagine agreeing to sell your car at today's price but handing over the keys in six months. The company gets price certainty and avoids holding idle cash. The cost is an overhang: everyone knows those shares are coming, and they will dilute per-share results when they arrive.
For Acadia, the 17.8m forward shares are about 13% of the 137.3m shares outstanding at 30 June 2026.1 Shares outstanding had already risen from 131.0m at the end of 2025.1 So the 2026 share count is still climbing, and the forward book guarantees more.
The equity history
Acadia has been a frequent issuer for years. It raised $145.5m of equity in 2019, $63.9m in 2021 and $119.5m in 2022, then stepped up to $459.9m in 2024 and $277.5m in 2025.7 The jump in 2024 coincided with the street-retail acquisition push.
It has also bought back stock: $55.1m in 2018 and $22.4m in 2020.7 That history cuts in an interesting way. In those years management judged its shares cheap enough to buy. Today, with the stock near its 52-week low, it is selling more through forwards priced earlier.6 Buying back at one price and issuing at another is not a mistake in itself, since it depends on what the proceeds earn. But it shows the company's view of its own value moves with its funding needs.
The test
The question is not whether dilution happened. It is whether each new share buys more FFO than it costs. If Acadia issues stock at, say, 15 times FFO, that is a cost of equity of roughly 6.7%. If it puts the money into assets yielding 9% unlevered, the trade adds to FFO per share. If the money goes into assets yielding 6%, or into deals that need years of redevelopment, it subtracts.
Over 2023–25, GAAP per-share results did not keep up. FFO is the fairer test, and management's 2026 guidance of about 10% FFO As Adjusted growth implies the trade is now working.3 At the 2026 midpoint and the last price, the stock trades at about 14.9 times guided FFO As Adjusted.63 A lower share price raises the cost of each new share, which makes the arithmetic harder for every future raise.
The verdict stays open. The settling figure is 2027 FFO As Adjusted per share growth against share-count growth once the 17.8m forward shares are settled. If FFO per share grows clearly faster than shares, the pivot is paying for itself. If not, shareholders own more of a better portfolio through a smaller slice. That leads naturally to the next question: can the dividend survive without the equity tap?
VII. Does the Dividend Hold Without New Equity?
Open the 2025 cash-flow statement and three numbers tell the story. Cash from operations: $167.0m. Dividends paid: $101.3m.7 Then, in 2026, $742m of acquisitions.4 The first two fit comfortably. The third does not fit at all.
Covered, but not funded
The dividend is covered by operating cash. In 2025 it took about 61% of CFO.7 Over 2021–25, cumulative CFO was about $701m and cumulative dividends about $350m, roughly half.7 Cash from operations rose from $105.0m in 2021 to $167.0m in 2025, so the payout has risen in step with real cash generation, not ahead of it.7
The leftover after dividends, about $66m in 2025, is far too small to pay for $742m of acquisitions or the redevelopment programme. That gap is funded by equity, debt and asset sales. A REIT is expected to work this way: the tax rules require it to pay out most of its taxable income, so retained cash is always thin. The danger is only if investors confuse a covered dividend with a self-funding growth plan.
Profit into cash
Over 2021–25, Acadia's cumulative net income was negative, about −$72m on the cash-flow line, while CFO was about $701m.7 The gap is almost entirely depreciation and amortisation, about $692m, plus about $61m of stock-based compensation.7 Working-capital swings were small, ranging from about −$38m to about +$5m in a year.7 The cash is genuine and not flattered by stretching payables or delaying collection.
Stock-based compensation deserves a note. It is non-cash, so it is added back to CFO, but it is a real cost to owners because it dilutes them. About $61m over five years, roughly $12m a year, is modest next to $167m of CFO, but owner earnings should subtract it.
The stress test that already happened
The COVID shock in 2020 is the closest thing to a live stress test. Retail tenants stopped paying, and Acadia, like many retail REITs, cut its dividend sharply and rebuilt it afterwards. The low 2021 dividend figure of about $40m reflects that rebuilding, and the climb to about $101m by 2025 includes both a restored per-share rate and a much larger share count.7 The lesson is that the dividend proved flexible in a crisis, which protected the balance sheet but shows the payout is not a promise.
The verdict: the dividend holds on CFO. Growth does not. The settling figure is 2026 CFO against dividends plus recurring capex, the spending needed just to keep buildings leased. If that number stays comfortably positive as the share count rises, the dividend is safe on its own merits. The other half of the funding question is debt, and that is where the balance sheet changed most in 2026.
VIII. Balance Sheet: De-Risked or Re-Labelled?
The most dramatic line in the Q2 2026 10-Q is not about rent. It is in the debt note. In six months, mortgage and secured debt fell from $893.9m to $480.0m, and unsecured notes rose from $879.5m to about $1.11bn.1 About $414m of secured debt disappeared, and about $234m of unsecured notes appeared. The drawn credit line was a modest $43.3m.1
Secured versus unsecured, in plain terms
Secured debt is a mortgage: the lender has a claim on a specific building. Unsecured debt is a promise backed by the whole company's credit. Investment-grade REITs prefer unsecured debt because it leaves buildings free to sell or refinance and it usually costs less. Moving from secured to unsecured is what a maturing REIT does.
The trade-off is that unsecured lenders rely on the company's overall strength and, in practice, on its credit rating. A mortgage lender looks at one building. A bondholder looks at S&P and Moody's.
The rating knife-edge
Acadia is rated BBB− by S&P and Baa3 by Moody's, the lowest rung of investment grade at both agencies.910 One notch lower and its bonds become high yield, where funding is more expensive and the buyer base narrower. In April 2026, Acadia upsized its credit facility to $1.425bn.3 The facility ties the release of subsidiary guarantees to the BBB−/Baa3 rating. That is the mechanism that makes the rating matter: the cheaper, cleaner unsecured structure depends on keeping it.
The bond market's view, as a rough indicator, puts Acadia's ten-year senior unsecured yield around 5.55%.9 Federal Realty and Regency, rated higher, borrow more cheaply. Every acquisition Acadia makes, it makes with more expensive money than its best-capitalised competitors.
The case that it is real de-risking
Leverage is falling. Net debt to adjusted EBITDA went from 5.5x at Q1 to 5.1x at Q2 2026.23 Maturities are light: about 2.4% of debt in 2026, 2.5% in 2027 and 7.1% in 2028, with no significant REIT-portfolio maturities until 2029.3 Interest coverage, using 2025 EBITDA of about $213m against interest of about $95m, is about 2.2 times.7
Coverage of 2.2x is adequate but not generous. If a sixth of EBITDA disappeared in a downturn, coverage would fall below 2x, which is the zone where rating agencies get nervous.
The case that it is re-labelling
The total debt has not shrunk much. It has been reshuffled, and the leverage improvement came largely from equity issuance and EBITDA growth, not from repaying debt from free cash. Fund-level debt, non-recourse to Acadia but consolidated in the accounts, complicates every leverage ratio. Acadia reports its leverage on a pro rata basis to strip much of that out, but investors still need the 10-K to see the split.
The verdict is narrowed, not rejected. The near-term refinancing risk is low and leverage has improved. But the balance sheet has moved from collateral-backed borrowing to a structure that depends on staying at the edge of investment grade. The settling event is any S&P or Moody's action. Those choices were made by a long-tenured team, and the next section asks how that team is paid and how strong its moat really is.
IX. Management, Incentives & the Moat Test
On 13 May 2026, Acadia held its annual meeting. About 95.6% of shares were represented. Every trustee nominee was elected, Deloitte & Touche was ratified as auditor, and the pay plan passed.5 A clean, quiet vote. That calm is a data point: there is no visible shareholder revolt against the strategy or the dilution.
Pay against profits
Kenneth Bernstein's 2025 compensation was reported at about $6.9m, made up of an $850,000 salary, a $2.49m bonus and $3.57m in stock, about 11% above the prior year's $6.2m.11 The proxy is the final word on the components, and the say-on-pay vote result should be read there.
The point is not the size. A $6.9m package for the CEO of a $2.6bn REIT is within the industry norm. The point is what drives it. Acadia's incentive plans lean on FFO-type metrics and total shareholder return. FFO has grown, so pay has grown. GAAP per-share results have not, and neither has the share price this year, which is near its 52-week low.6 When pay follows FFO and the company can raise FFO by issuing shares into accretive deals, the metric to watch is FFO per share, not FFO in total.
Credibility over time
Judge the team by behaviour, not by tone. Three episodes stand out.
First, guidance. In 2025 and 2026, management has met or raised its operating guidance, and the same-property NOI numbers have backed it up.23 That is a recent but genuine record.
Second, the funds. Management built a platform that generated wins and write-downs. The impairments were absorbed mostly by partners, and the 2026 exits at 1.9x show that the team can still harvest value. The record is mixed but explained.
Third, the pivot. Moving the core portfolio onto high streets after a decade of street-rent declines was a contrarian bet. So far, the timing looks right. Management has also said, in effect, that street-retail growth will moderate as leases reset, which is a useful self-limiting statement. A 15.6% same-property NOI growth rate is not a permanent run rate, and management's own framing points to normalisation.
The moat test
Now the full argument, once.
Cornered resource (Helmer). The strongest claim is scarcity. There is only so much frontage on Greene Street, Armitage Avenue or Fifth Avenue. Owning a cluster of storefronts on one corridor gives Acadia some ability to curate the street and set the tone of rents. But ownership is not exclusive. Private capital can buy the building next door, and frequently does. Scarcity raises asset value for every owner; it does not give Acadia a durable advantage over other buyers.
Scale economies. The fund platform offers some: the same team manages more capital and earns fees on outside money. That only works while Acadia keeps raising new funds and producing exits. With G&A at about 11% of revenue, scale economies are not visible yet.7
Switching costs. Tenants in good locations rarely move, because a flagship relocation is expensive and risky. But short street-retail leases mean the tenant can walk at expiry if rents rise too far. Switching costs exist, but they are lower than for a 20-year anchor lease.
Counter-positioning, network effects, brand, process power. None apply in a meaningful way. Tenants choose the street, not the landlord.
Porter's five forces. Buyer power: tenants are fragmented, so no single one dominates rent, though luxury tenants as a group can pull back at once. Supplier power: lenders and equity investors are the real suppliers, and at BBB− Acadia pays more for capital than peers. Threat of entry: low in the physical sense, high in the capital sense, since anyone with money can buy a building. Substitutes: e-commerce matters for the suburban remainder far more than for prime streets. Rivalry: intense for acquisitions, mild for tenants on the best blocks.
The verdict: Acadia does not have a moat in Helmer's sense. It has a good set of assets, bought at an attractive point in the rent cycle, and a team with a long record in this niche. That is an edge in execution and timing, not a structural advantage, and it is offset by a higher cost of capital than Federal Realty and Regency. What the story has taught so far can be compressed into a few lessons.
X. Playbook: Lessons
"Rent growth is not shareholder growth until you divide by the share count." Acadia's operating story is excellent: street-retail NOI up mid-teens and leasing spreads in double digits. Yet the weighted share count went from about 95m to about 131m in two years. The lesson for founders and investors is that a landlord can win every lease negotiation and still lose the per-share race. The only number that counts for an owner is the one with "per share" after it.
"A fee stream from your own funds is only as good as the next exit." The same funds that sold assets at about 1.9x in 2026 carried $37.2m of impairments in 2025. Management fees from a vehicle you control are related-party income, and promotes are earned only when markets cooperate. Investors should value fund income as an option on the cycle, not as an annuity.
"Move to unsecured and you've swapped a lender's collateral for a rating agency's opinion." Acadia cut secured debt by about $414m in six months and raised unsecured notes by about $234m. The structure is cleaner, cheaper and more flexible. It is also now hostage to one notch at S&P and Moody's. De-risking that depends on a rating is not the same as de-risking that depends on cash.
"A covered dividend is not a funded growth plan." Operating cash of $167m comfortably paid $101m of dividends. It did not come close to paying for $742m of acquisitions. In a REIT, the dividend tells you about the past year's cash. The equity calendar tells you about the strategy.
"Buy the sidewalk when everyone else is buying the screen, then prove it was cheap." Bernstein's pivot onto high streets came after years of retail-apocalypse headlines. The early evidence suggests the timing was good. The test of a contrarian bet is not whether it is popular in hindsight. It is whether the yield on the money still beats the cost of the money once the market agrees with you.
These lessons set up the debate that every investor in Acadia is having right now.
XI. Analysis: Bull vs. Bear & KPIs
Two analysts read the same Q2 2026 release. The first underlines same-property NOI up 8.7% and street retail up 15.6%.3 The second circles shares outstanding of 137.3m and the 17.8m forward shares still to come.1 Neither is wrong. The disagreement is about which number will matter more by 2028.
The bull case
The bull argues that Acadia bought the right streets at the bottom of a rent cycle. Street-retail NOI is compounding, leasing spreads are in double digits, and acquisitions like 129 Fifth Avenue yield above 9% against a borrowing cost around 5.5%.49 Leverage has fallen to 5.1x, there are no significant REIT-portfolio maturities until 2029, and FFO As Adjusted is guided up about 10% in 2026.3
At $18.63, the stock trades at about 14.9 times the 2026 FFO As Adjusted midpoint, near the bottom of its 52-week range and below its 50- and 200-day averages of about $20.51 and $20.84.63 Peers have also slid recently: Federal Realty, Regency, Kite and Brixmor all trade below their 50-day averages, so part of the decline is sector-wide, tied to rates and retail sentiment rather than to Acadia alone.6 To the bull, the market is pricing Acadia like a dilutive mid-cap strip-centre landlord, while its growth looks more like a premium urban portfolio.
The bear case
The bear argues that this has been the story before. GAAP per-share earnings have shrunk for a decade. The growth is being bought with equity and unsecured debt. The rating sits one notch from high yield. Fund income is lumpy and comes with an impairment history. The note book carries a reserve that looks thin for subordinated retail lending. And the street book rides on luxury and fashion tenants, whose spending can turn quickly.
The activist's question
A skeptical investor would ask a pointed question: if street-retail yields are as high as management says, why does Acadia need both a fund platform and continuous equity issuance? A simpler company could sell more suburban assets, stop issuing below its own estimate of value, and fund street retail from recycled capital. The counter-argument is that the fund platform gives Acadia access to deals and fee income a pure REIT could not get. The burden of proof sits with management: show the fund platform's share of FFO and its return on Acadia's invested capital.
Material risks
Three risks are material. Refinancing and cost of capital: at BBB−/Baa3, a downgrade would raise funding costs and could tighten bank terms. Tenant and luxury cyclicality: New York street rents fell sharply in the late 2010s, and short leases mean a downturn would reach income quickly. Fund execution: the next exits must match the recent 1.9x, or the promote story weakens. E-commerce and AI disruption matter mainly for the suburban remainder. Currency risk is not material, since the portfolio is in the United States.7
Three KPIs to track
1. FFO As Adjusted per share growth. The latest marker is the 2026 guidance of $1.24–1.26, about 10% growth at the midpoint.3 It is the single number that answers whether the pivot outruns the dilution.
2. Same-property NOI growth, with street retail shown separately. The latest reading is 8.7% total and 15.6% for street retail in Q2 2026, up from 5.9% in Q1.32 It is the cleanest measure of whether the rent engine is still running.
3. Net debt to EBITDA, read with the credit rating. The latest reading is 5.1x at Q2 2026, down from 5.5x at Q1, with ratings at BBB−/Baa3.32 It tells investors whether growth is being funded responsibly.
Put together, the picture is a credible operating story with an unproven per-share story. The next few months will add evidence to both sides.
XII. Epilogue
Tonight, Acadia stands at an awkward point. The rent engine is running faster than at any time in the past decade. The share price sits near its 52-week low. The balance sheet is cleaner than a year ago and more dependent on a rating. And roughly $352m of equity is still queued up under forward agreements.4
Several moments over the next year will decide the story.
The forward settlements and 2027 guidance. When Acadia settles the remaining forward shares and issues 2027 guidance, investors will see directly whether FFO As Adjusted per share outruns the share count. If 2027 guidance implies high-single-digit per-share growth on the larger base, the answer to the first question turns to yes. If growth slows to the low single digits as the shares arrive, the pivot will look like a bigger company, not a richer one per share.
2026 operating cash against dividends plus recurring capex. If CFO keeps rising faster than the dividend, the payout is secure on its own. If acquisitions and redevelopment push recurring capex up while dividends climb with the share count, the cushion shrinks.
Any rating-agency action. An upgrade to BBB at S&P or Baa2 at Moody's would lower Acadia's cost of capital and loosen the knife-edge. A negative outlook would put the whole unsecured structure under pressure. Either answers the second question decisively.
The next fund exit. A sale at or above the 1.9x benchmark would support the fund platform's value. Another round of impairments would confirm the bear's view that fund income is the weak link. That settles the third question.
Street-retail same-property NOI through a slowdown. Mid-teens growth will not last. The question is where it settles. If it stays clearly above the open-air peers as leases reset, the street thesis gains a durable edge. If it falls back toward the low single digits, Acadia becomes an ordinary landlord with higher-cost capital.
The tension that remains is simple: great streets, expensive money. Acadia has assembled a portfolio many investors would want. It has paid for it with a currency, its own shares, whose value has fallen while the strategy has worked.
XIII. Outro
Go back to Greene Street. The empty storefront that began this story will not stay empty for long. In the current market, a space like that fills in weeks, and the new tenant pays more than the last one. On the sidewalk, Acadia's bet is working.
The question was never whether the sidewalk is valuable. It was whether shareholders would end up owning more of it, or just more shares. Acadia tried to turn the sidewalk into an annuity. Now it has to prove the annuity is per share.
References
-
Acadia Realty Trust Form 10-Q, quarter ended 2026-06-30 — SEC EDGAR ↩↩↩↩↩↩↩↩↩↩↩↩
-
Acadia Q1 2026 results release (8-K Exhibit 99.1) — SEC EDGAR ↩↩↩↩↩↩
-
Acadia Q2 2026 results release (8-K Exhibit 99.1) — SEC EDGAR ↩↩↩↩↩↩↩↩↩↩↩↩↩↩↩↩↩↩↩↩↩
-
Acadia Realty Trust Provides Investment, Balance Sheet and Leasing Update — Yahoo Finance, 2026-09-14 ↩↩↩↩↩↩↩↩↩↩↩↩↩
-
Acadia Realty Shareholders Back Board, Auditor and Pay Plan — TipRanks, 2026-05 ↩
-
Acadia Realty Trust (AKR) quote, filings and transcripts — Yahoo Finance ↩↩↩↩↩↩↩↩
-
Acadia Realty Trust SEC filings (10-K, 10-Q, 8-K, DEF 14A) — SEC EDGAR ↩↩↩↩↩↩↩↩↩↩↩↩↩↩↩↩↩↩↩↩↩↩↩↩↩↩↩↩↩↩
-
Acadia Realty Trust — corporate website and investor relations ↩↩↩↩
 LinkedIn
 WhatsApp
 Reddit
 Hacker News
 Email
Email Kindle
 RSS Feed
 Spotify
 Apple Podcasts
 Amazon Music
 Audible
 YouTube