Asbury Automotive Group: The Engine of Auto Retail Consolidation
I. Introduction & Episode Roadmap
On a Wednesday morning in late July 2026, a man who had started his career selling cars off a lot in a management-trainee program opened his first earnings call as chief executive of an $18 billion company.
Daniel Clara joined Asbury Automotive Group in July 2002 as a client advisor — the industry's polite term for a salesperson — four months after the company listed on the New York Stock Exchange.1 Twenty-three years later, following the 2026 annual meeting, he succeeded David Hult as president and CEO, while Hult moved to executive chairman under an agreement running through the end of 2027.1 The handoff was orderly, telegraphed seven months in advance, and about as far from a crisis as succession gets.
What Clara inherited is one of the strangest compounding machines in American retail.
Asbury sells things almost nobody enjoys buying, in a format consumers routinely rank alongside dentistry for pleasantness, under contracts written by manufacturers who hold most of the cards. As of December 31, 2025, it owned and operated 223 new-vehicle franchises representing 36 brands at 171 dealership locations, plus 39 collision centers and an in-house finance-and-insurance underwriter, across 15 states.2 Fiscal 2025 revenue was $18.0 billion; net income was $492.0 million.2
And yet the stock trades at roughly seven and a half times last year's adjusted earnings per share, with a market capitalization under $4 billion — less than a twentieth of Carvana's, a company that sells fewer cars and has never matched Asbury's cash generation.
The auto retail paradox
Here is the paradox that makes this story worth two hours of your attention. The public dealership groups are hated by customers, squeezed by manufacturers, cyclically exposed to interest rates, and structurally threatened by electrification. They are also among the most reliable free-cash-flow producers in the S&P 400, and they have been for two decades.
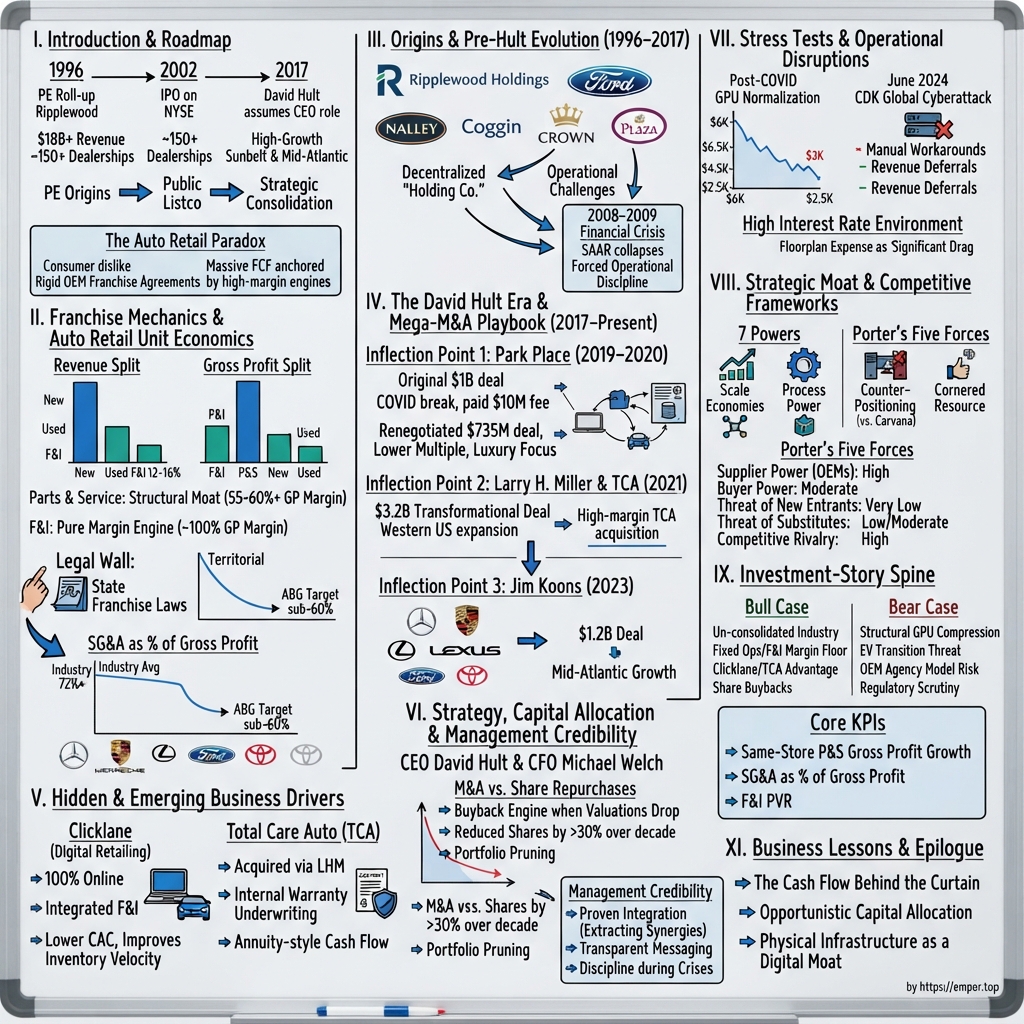
The reason is a piece of accounting arithmetic that almost nobody outside the industry internalizes. In 2025, new and used vehicles accounted for roughly 82% of Asbury's revenue but produced only about 29% of its gross profit. Parts and service plus finance and insurance — 18% of revenue — produced the other 71%.2 The cars are the customer-acquisition engine. The money is somewhere else entirely.
What this story covers
This piece traces how a mid-1990s private-equity roll-up assembled from founder-owned regional dealership groups became a national consolidator, and then asks the harder question: whether the machine still works.
We will walk through the unit economics and the legal architecture that protects them; the twenty-year slog from the Ripplewood era through a near-death experience in 2008 and a decade of unglamorous centralization; the Hult acquisition campaign that took the company from roughly $6 billion to $18 billion in revenue in six years; the two businesses management insisted were the future, one of which delivered and one of which quietly disappeared from the filings; the post-pandemic margin normalization that is still working through the P&L; the June 2024 cyberattack that shut off the company's nervous system for three weeks; and the enormous, expensive, self-inflicted software migration that is currently suppressing the company's reported earnings.
We will be skeptical where skepticism is earned. Asbury's management has a genuinely good record on some things — walking away from a billion-dollar deal in March 2020 took discipline that most acquirers lack — and a mixed record on others, including a five-year strategic plan that missed on both of its most-promoted pillars.
The place to start is not with the company. It is with the peculiar economics of the box itself.
 Subscribe on LinkedIn
II. Franchise Mechanics & Auto Retail Unit Economics
Walk into any Asbury store — a Nalley BMW in Atlanta, a Park Place Mercedes-Benz in Dallas, a Herb Chambers Lexus outside Boston — and you are standing in what looks like a showroom and is actually four businesses stacked on one piece of real estate, sharing a parking lot and a payroll.
Three of them are visible. The fourth, which pays the mortgage, is behind the building.
Four businesses, one roof
New vehicles are the marquee. They generated $9.5 billion of Asbury's 2025 revenue, 52.8% of the total, on 181,204 units.2 They are also the thinnest margin in the building: gross profit of $621.9 million, or 6.5% — down from 7.2% the prior year.2 Average gross profit per new vehicle sold was $3,432 in 2025, and management has repeatedly guided investors toward a long-run normalized figure of roughly $3,000.3 On the Q2 2026 call, CFO Michael Welch put it plainly: "we still think $3 thousand is probably the right long term number."4
Every new car on the lot is financed with floor-plan debt — a revolving credit line secured by the vehicle itself, repaid when the car sells. For most of the 2010s, manufacturer floor-plan assistance more than covered the interest, making inventory effectively free to carry. That stopped being true. Floor-plan interest expense was $91.2 million in 2025.2 Day supply, once a back-office statistic, became a board-level metric.
Used vehicles are the funnel. They contributed roughly 29% of 2025 revenue across retail and wholesale but only $259.1 million of gross profit — about 8.4% of the company total.2 Used is where trade-ins get recycled, where reconditioning hours get generated for the service department, and where customers who cannot afford a $52,406 average new vehicle transaction still walk out with something.
Finance and insurance is pure spread. Asbury reports F&I revenue net of cost, which is why its gross margin looks like an accounting error: $770.6 million of revenue produced $718.1 million of gross profit in 2025.2 This is the arranging of third-party financing, the sale of extended service contracts, guaranteed asset protection, prepaid maintenance, and paint-and-fabric plans. F&I profit per vehicle retailed ran $2,210 in the second quarter of 2026.4
Parts and service — "fixed operations," in the trade — is the business that matters most and gets discussed least. It produced $2.5 billion of revenue in 2025 and $1.47 billion of gross profit, a margin near 59%.2 That single line item is 47.9% of Asbury's total gross profit, generated on 13.9% of its revenue.2
Why fixed operations is the real company
The reason this matters is not that the margin is high. It is that the demand is non-discretionary and largely independent of the new-vehicle cycle.
The cleanest evidence is buried in the company's 2009 annual report. Between 2007 and 2009, industry SAAR — the seasonally adjusted annual rate of U.S. new-vehicle sales — collapsed from over 16 million units to approximately 10.4 million.5 Asbury's new-vehicle revenue fell 35%, from $3.09 billion to $2.01 billion. Its parts and service revenue over the same two years went from $622.0 million to $622.1 million.5
Flat. Through the worst automotive demand shock since the Depression.
That is the moat, and it is worth understanding mechanically. Cars break on a schedule set by physics and mileage, not by consumer confidence. Warranty work is paid by the manufacturer, not the customer. Franchised dealers hold a near-monopoly on warranty repair and on the diagnostic software and factory-trained technicians that increasingly complex vehicles require. On the Q1 2026 call, Clara noted that the average vehicle coming through Asbury's service drives carries roughly 70,000 miles — evidence that customers stay in the franchised channel well past the warranty period rather than defecting to independent garages.3
The regulatory wall
None of this survives without a legal structure that is genuinely unusual in American commerce.
State franchise laws — enacted across the mid-twentieth century, when manufacturers routinely terminated dealers who had sunk their savings into a store — prohibit automakers in most states from selling new vehicles directly to consumers, protect dealers' geographic territories from encroachment by same-brand competitors, and make termination of a dealer agreement legally difficult and expensive.
The practical effect is that a Toyota franchise in a growing suburb is a licensed local monopoly on a brand's new-vehicle sales and warranty work, and it trades in a private market at a premium to its tangible assets. The industry calls that premium "blue sky," and it is the reason dealership M&A is priced on multiples of normalized earnings rather than on book value.
Tesla and several EV startups have spent a decade litigating around these statutes with mixed success. But the incumbent manufacturers — the ones whose franchises Asbury actually owns — are contractually and legally bound to the dealer channel in most of the country. That is a legal moat, not an operational one, and it is worth remembering that legislatures grant it and legislatures can amend it.
The metric that decides who wins
Because gross profit is largely determined by brand mix, market, and manufacturer behavior, the variable a dealership group actually controls is cost. The industry's governing ratio is SG&A as a percentage of gross profit — how many cents of operating expense it takes to deliver a dollar of gross.
Asbury reported 64.7% for full-year 2025, up 66 basis points from 64.0% in 2024.2 During the pandemic supply squeeze, when gross profit per unit was inflated and expenses had been cut to the bone, the company hit 55.3% in a single quarter of 2021.6 That was never a steady state; it was a numerator problem disguised as an efficiency triumph.
The current management target is the "low 60% range by the end of 2027," which Clara tied explicitly to completing the technology migration we will get to shortly.4 Whether that number arrives is, in a real sense, the entire investment question — because at Asbury's scale, roughly 400 basis points of SG&A leverage on $3 billion of gross profit is more than $100 million of pre-tax income.
For investors, the takeaway from the unit economics is not that dealerships are good businesses. It is that they are two businesses wearing one costume: a low-margin, cyclical, capital-intensive vehicle distributor bolted onto a high-margin, recurring, capital-light service annuity. Every question about Asbury's future is really a question about whether the second one keeps subsidizing the first.
Which brings us to how this particular collection of stores got assembled in the first place.
III. Origins & Pre-Hult Evolution: The PE Roll-Up Era (1996–2017)
The 1990s produced a specific kind of financial idea, repeated across a dozen fragmented industries: find a business with thousands of aging family owners and no national player, buy them with debt, staple the logos together, take it public, arbitrage the multiple.
Funeral homes. Veterinary clinics. Office products. And car dealerships.
The Ripplewood thesis
Asbury's own account, filed with the SEC in its first annual report as a public company, is deadpan: "We were formed in 1994 by then-current management and Ripplewood Investments L.L.C."7 The founding executive was Tom Gibson, a former president of Subaru of America; the financial architect was Timothy Collins, who spun Ripplewood out of Onex in 1995. Freeman Spogli & Co. bought in during 1997, and after the IPO each firm held slightly over 25% of the company.8
The strategy was to buy whole regional groups rather than individual stores, and — critically — to leave the local names and the local families in place. Nalley Automotive Group in Atlanta came first, in September 1996. Plaza Motor Company in St. Louis followed in December 1997. The David McDavid Automotive Group in Dallas-Fort Worth arrived in April 1998, and with it, Florida's Coggin and Courtesy groups, Arkansas's McLarty operation, North Carolina's Crown, and Oregon's Thomason.78
By the time the eight platforms were legally combined on April 30, 2000, Asbury was a holding company sitting atop eight semi-autonomous businesses that shared a balance sheet and very little else.7
A public company that wasn't really a company
Brian Kendrick was hired to take it public in 1999; he died in September 2001, delaying the offering. Kenneth Gilman, formerly chief operating officer of The Limited, took the job in January 2002 and executed quickly. Asbury effected its IPO on March 13, 2002, listed on the NYSE under "ABG" the following day, and closed the offering on March 19 — 21% of the company at $16.50 a share, raising $127 million against total debt of $987.1 million.78
At year-end 2002 the company ran 131 franchises at 93 dealership locations across nine states, with $4.5 billion of revenue and 33.0 million shares outstanding.7
Hold that share count. It matters later.
What the market got was a decentralized federation. Nine "platforms," each with its own trade name, its own management, and — in practice — its own way of doing almost everything. There was no unified inventory system, no centralized back office of consequence, no common approach to F&I menu selling. The theoretical synergies of scale existed mostly in the pitch book. An experiment with "Price 1" no-haggle used-car stores near Houston Walmart Supercenters closed inside a year.8
For most of the 2000s, Asbury was a competent regional operator wearing a national company's cost structure. The stock did not reward it.
2008: the stress test
Then the floor gave out.
Revenue fell from $5.15 billion in 2007 to $4.40 billion in 2008 to $3.65 billion in 2009 — a 29% peak-to-trough decline.5 In 2008 the company took $528.7 million of impairment charges, principally writing down the goodwill and franchise rights it had paid up for during the roll-up, and reported a loss from operations of $413.2 million.5 Chrysler and General Motors entered bankruptcy in 2009 and terminated thousands of dealer agreements across the industry, demonstrating in the most vivid way possible that a "protected" franchise is only as durable as the manufacturer behind it.
Two lessons were burned into the public dealer groups in those eighteen months, and they still govern behavior today.
The first was about inventory. Floor-plan debt is cheap right up until vehicles stop moving, at which point it is a fixed charge against a shrinking gross profit. Every public dealer emerged from the crisis obsessed with days' supply.
The second was about the expense base. When gross profit fell 23% in a single year, SG&A had to follow or the company died. Asbury cut selling, general and administrative expenses from $581.5 million in 2008 to $494.7 million in 2009 and dragged itself back to $96.3 million of operating income.5 It survived. Barely, and with a permanently altered institutional memory.
The unglamorous decade
The 2010–2017 period is the least dramatic stretch in this story and arguably the most important. There were no transformational deals. What there was, instead, was the slow conversion of a holding company into an operating company: standardized store processes, centralized procurement and back-office functions, common performance benchmarking across platforms, and a serious effort to raise F&I product penetration toward the levels the best private groups were achieving.
David Hult joined as chief operating officer in 2014, arriving from a career built inside stores rather than inside spreadsheets. He became president and CEO in November 2017.
By then the company had roughly $6.5 billion of revenue and a coherent operating system for the first time in its history. It had also, crucially, learned to say no — a skill it would need almost immediately.
What it had not yet done was grow.
IV. The David Hult Era & The Mega-M&A Playbook (2017–Present)
David Hult did not look like the kind of CEO who would spend $7 billion buying companies.
He came up through stores. His public register was operational — day supply, technician hours, gross per employee, guest experience — and on earnings calls he would answer analyst questions about capital structure by handing them to his CFO and then volunteering an unprompted paragraph about how long it takes a service technician to develop muscle memory on new software. Over an eight-and-a-half-year tenure he did something the roll-up's original sponsors never managed: he made scale actually produce something.
Three deals define the era. Each reveals something different about how the company thinks.
Park Place: the walk-away
In December 2019, Asbury agreed to acquire Park Place Dealership, the dominant luxury group in Dallas-Fort Worth — 19 franchises, two collision centers, and an auto auction, for roughly a billion dollars.9 It was the largest transaction in Asbury's history and, in the pre-pandemic environment, an aggressive one.
Then COVID arrived.
On March 24, 2020 — with showrooms closing, SAAR in freefall, and credit markets seizing — Asbury delivered notice terminating the transaction agreements and paid $10.0 million in liquidated damages to walk away.9
This deserves more credit than it usually gets. The company had already arranged financing. It had announced the deal publicly, including in a Monday Night Football commercial. Reversing was embarrassing and expensive. Most acquirers in that position renegotiate, delay, or grind toward a close because the reputational cost of quitting feels worse than the financial cost of proceeding. Asbury paid a nine-figure deal's break fee and preserved its liquidity at precisely the moment liquidity was the only thing that mattered.
Four months later, it came back.
By July, after what the company described as "a strong May and June 2020 performance," Asbury reengaged on "more favorable pricing and more flexible financing terms," and — the detail that matters — limited the purchase "to those most aligned with the Company's core strategic business."9 The revised deal, signed July 6 and completed August 24, 2020, took 12 franchises rather than 19, plus the two collision centers and the auction, for $889.9 million.9 The company leased rather than bought the real property, and financed part of the price with seller notes at 4.00% that it refinanced within weeks through a bond offering.9
Fewer franchises. Better brands. Lower price. Less capital tied up in dirt.
The analytical conclusion is that Asbury's management demonstrated something rarer than deal-making skill, which is deal-abandonment skill — and then converted a crisis into pricing leverage. A year later, Hult told an analyst that if he could own only one dealership group in the United States, it would have been Park Place, and that the company was already "exceeding our year three targets."6 Self-assessments on calls are not evidence. But the terms of the renegotiation are.
Larry H. Miller: the transformation
If Park Place showed discipline, the next deal showed appetite.
On September 29, 2021, Asbury announced the acquisition of the Larry H. Miller Dealerships and Total Care Auto, Powered by Landcar. The transaction closed December 17, 2021, and the company's own accounting puts the total purchase price at $3.48 billion — for 54 new-vehicle dealerships, seven standalone used-car stores, 11 collision centers, a used-vehicle wholesale business, the associated real property, and the TCA insurance entities.10
The strategic logic was geographic and structural at once. Larry H. Miller was the dominant group across Utah, Arizona, Colorado, New Mexico and Idaho — high-growth Western markets where Asbury had almost no presence and where population inflows were running well ahead of the national average. It nearly doubled the company overnight.
The financial logic was more aggressive. Asbury funded the deal with a combination of senior notes, revolver borrowings, a real estate facility, floor-plan lines, and equity, taking net leverage from 1.2 times at the end of Q3 2021 to what Welch told analysts would be "the high 3s."6 Against a stated target of 3.0 times, this was a deliberate, temporary breach — justified on the call by the accretion math and by the free cash flow available to pay it back.
They did pay it back. Leverage was down to 2.7 times by mid-2024.11 On that specific promise, management delivered.
Hult's framing of TCA on the Q3 2021 call is worth quoting because it set an expectation investors could later grade: the business was making "above $50 million a year EBITDA on a 115,000 car sales," and Asbury was bringing more than 200,000 annual retail units into the funnel.6 The implication — roughly double the volume through the same underwriting engine — was left for the audience to compute.
Welch, three weeks into the CFO job, then delivered the caveat that would define the next five years of Asbury's reported earnings: because an insurance underwriter must defer revenue and amortize it over the life of the contract rather than book it on day one, moving Asbury's own F&I product sales into TCA would convert immediate profit into deferred profit. "It will take us a few years to be able to bring in Asbury at a measured clip," he said.6
That was an honest warning, given in advance. It has cost real reported EPS ever since — $0.66 per share in the second quarter of 2026 alone.4
Jim Koons: the Mid-Atlantic bridgehead
The third deal closed December 11, 2023: the Jim Koons Automotive Companies, a family-owned group anchored in the Washington-Baltimore corridor, for an aggregate purchase price of approximately $1.50 billion.2 It added roughly 20 dealerships across Virginia, Maryland and Delaware and about $3 billion in annual revenue.12
Koons was a different kind of asset from Miller. Where the West was about growth, the Mid-Atlantic was about density — high household incomes, constrained land supply, and a service population large enough to run fixed operations hard. The purchase price also included a substantial real-estate component, which Asbury bought rather than leased.
It is worth pausing on how much of Asbury's acquisition spend goes into land and buildings rather than into franchise rights. Owning the dirt reduces reported operating leverage and consumes capital, but it removes landlord risk from a business whose manufacturers periodically demand seven-figure facility renovations. It also means a meaningful share of the "multiple" Asbury pays for a dealership group is really a real-estate purchase at prevailing cap rates, not a bet on the operating business — a nuance that flatters headline blue-sky multiples and that investors should adjust for.
Herb Chambers: the deal the old outline missed
And then, in 2025, Asbury did it again — in a region it had never operated in.
On February 18, 2025, the company agreed to acquire The Herb Chambers Companies, the fourteenth-largest privately held dealership group in the United States, for an announced $1.34 billion.13 Herb Chambers himself, the group's founder, became a special advisor to Asbury while retaining ownership of Mercedes-Benz of Boston.13
The transaction closed on July 21, 2025. Asbury's 10-K puts the aggregate purchase price at approximately $1.76 billion — the gap between announcement and close reflecting real property and related businesses — covering 33 dealerships, 52 franchises and three collision centers, funded primarily with borrowings under the senior credit facility and a 2025 real estate facility.2 Herb Chambers had generated $2.9 billion of revenue in 2024.13
Asbury now had more than 50 stores in the Northeast, a region whose winters would show up in the following January's numbers with unpleasant clarity.14
The pattern, and its cost
Step back and the playbook is legible. Buy whole groups, not single points. Prefer markets with population and income growth or with density. Retain the local brand names — Nalley, Coggin, Crown, Plaza, Park Place, Koons, Chambers all still trade under their own signage.2 Keep the senior operating teams. Fund with debt, then de-lever with free cash flow. Prune relentlessly afterward.
That last item is real: during 2025 alone Asbury sold 24 franchises across seven manufacturers in seven states, recording an $80.2 million pre-tax gain, and in the first quarter of 2026 divested ten more dealerships and terminated seven franchises, exiting the Alfa Romeo and Maserati brands entirely — together roughly $625 million of annualized revenue.23
But there is a cost to acquisition-led growth that the revenue chart hides. Asbury recorded $141.0 million of asset impairments in 2025 and $149.5 million in 2024, arising from annual franchise-rights impairment tests and from reclassifying stores as held for sale.2 Those are non-cash, and management adjusts them out. They are also, in substance, the company marking down franchise rights it previously paid cash for. An investor tracking economic returns rather than adjusted EPS should treat roughly $290 million of impairment across two years as a real, if retrospective, statement about acquisition pricing.
The scoreboard from the outside is mixed in a specific way. Revenue tripled from roughly $6.5 billion to $18.0 billion. Adjusted EBITDA reached $1,005.6 million in 2025.15 And the shares, as of this writing, sit closer to their 52-week low than their high, at a mid-single-digit multiple of adjusted earnings. The market is not disputing that Asbury got bigger. It is disputing what the bigger version is worth.
Part of that dispute traces to two initiatives management spent years telling investors would change the business.
V. Hidden & Emerging Business Drivers: Clicklane & Total Care Auto
On December 2, 2020, in the middle of a pandemic that had pushed car buying online whether dealers liked it or not, Asbury unveiled a product and a promise.
The product was Clicklane, built with Gubagoo: a genuinely end-to-end online purchase flow. Penny-accurate trade-in valuation with loan payoff, real payments including local tax and fees, a marketplace of more than 30 lenders, VIN-specific F&I product selection, DocuSign execution, service scheduling — a complete transaction in roughly 15 minutes.16
The promise was bigger. Hult used the launch to unveil a five-year strategic vision: $20 billion of revenue by 2025, built from $2 billion of same-store growth, $5 billion of acquisitions, and $5 billion generated through Clicklane.16
It is now 2026. We can grade it.
Clicklane: the honest scorecard
The early data looked promising. In the third quarter of 2021 — the platform's second full quarter across all stores — Asbury sold 6,000 vehicles through Clicklane, 47% new and 53% used. Ninety-three percent of those transactions were with customers new to Asbury's dealership network. Average transaction time was eight minutes for cash and 14 minutes for financed deals, and average credit scores ran above the store average.6
Hult was candid about the caveat even then: conversion was running about two percentage points below plan, offset by higher traffic, and the inventory shortage made the whole thing hard to read.6
The tool also proved its worth in an emergency, which we will come to. And by mid-2025, Clicklane was still moving volume — roughly 9,500 units in a single quarter.
But the $5 billion revenue pillar did not arrive. Asbury's total 2025 revenue was $18.0 billion against a $20 billion target, and that $18 billion includes Larry H. Miller, Koons and Herb Chambers — acquisitions that vastly overshot the $5 billion acquisition pillar. Strip the arithmetic apart and the shortfall is concentrated in exactly the place management said would be transformational.
More telling than the number is the disclosure. Asbury's fiscal 2022 annual report devoted a paragraph in Item 1 to Clicklane, calling it "the automotive retail industry's first, end-to-end, 100% online vehicle retail tool" and asserting that it "creates a competitive advantage."10 The fiscal 2025 annual report does not mention Clicklane at all.2 Neither the Q4 2025, Q1 2026 nor Q2 2026 earnings call contains the word.1434
That is not a scandal. Products get absorbed into operations; a digital retailing layer that becomes standard plumbing does not need a proper noun. But investors should be precise about what happened: a capability that was marketed as a counter-positioning weapon against Carvana became, in practice, a competent transaction interface. It lowered friction. It did not change the company's competitive position, and management stopped claiming it had.
The strategic lesson generalizes beyond Asbury. The dealership groups' real answer to online-only retailers was never software. It was that reconditioning bays, trade-in appraisal, title work, delivery logistics and service capacity are physical, expensive, and locally distributed — and that a pure-play e-commerce entrant has to build all of it. Carvana's near-death experience in 2022 and 2023 made that case far more convincingly than any dealer's website ever did.
Total Care Auto: the one that worked
The other 2021 acquisition-within-an-acquisition has been quieter and more durable.
Total Care Auto is Asbury's captive F&I product underwriter — vehicle service contracts, debt-protection products, and vehicle protection plans — regulated by state insurance departments and subject to licensing and financial-responsibility requirements in each state where it operates.2 It is one of Asbury's two reportable segments.2
The economics are straightforward. When a dealership sells an extended service contract underwritten by a third party, it books a commission. When it sells one underwritten by its own subsidiary, it captures the underwriting margin and the investment income on the reserve float, and it retains the customer relationship that drives the vehicle back to its own service bays when a claim arises. Hult described the relationship between TCA and the Miller stores as "hand-in-glove," pointing to the group's unusually strong service retention.6
TCA generated $15 million of pre-tax income in the first quarter of 2026 and $5 million in the second.34 The rollout to Herb Chambers stores — the last remaining platform — was scheduled for completion in the back half of 2026, five years after the acquisition.4
Five years is slow, and that is the point worth understanding.
The deferral: an accounting feature that looks like a bug
Here is the mechanism, in plain terms.
If Asbury sells you a three-year service contract through an outside underwriter, it books its commission today. If it sells you the same contract through TCA, accounting rules require it to spread that revenue across the three years the contract is in force, because TCA — as the insurer — bears the obligation. The cash arrives the same. The reported earnings arrive later.
So every time Asbury migrates another platform onto TCA, it takes a visible, non-cash hit to current EPS in exchange for a larger, more durable stream later. That headwind was $0.26 per share in Q1 2026 and $0.66 per share in Q2 2026 — meaning adjusted EPS of $6.82 would have been $7.48 without it.34
To management's credit, they flag it every quarter, publish a slide of expected future deferrals, and reconcile it. To the skeptic's credit, it is also a recurring "adjustment" that has now run for five years, and forecasting it requires assumptions about future SAAR that management itself has revised repeatedly. When an analyst asked in Q2 2026 why the full-year deferral had flipped from a headwind to a benefit, Welch explained it as pure volume: lower SAAR and lower used-vehicle volume meant fewer contracts written, so less revenue got deferred.4
Read that again, because it is the honest version. The deferral improved because the business sold less. That is not a margin story; it is an arithmetic identity, and management said so rather than dressing it up.
For investors, the balance of evidence on these two initiatives is asymmetric. The digital platform was oversold and under-delivered against an explicit public target. The insurance business was undersold, has been integrated slowly and expensively, and is the one that structurally changes Asbury's economics — because it converts a commission into an annuity and ties the customer to the service drive. Management's own five-year plan got the emphasis exactly backwards.
Which raises the obvious question about how much weight to put on what they say next.
VI. Current Strategy, Capital Allocation & Management Credibility
"I want to begin my first earnings call as Asbury's CEO by thanking our team members across the country."
Daniel Clara's opening line on July 28, 2026 was conventional. What followed was not entirely conventional for a new chief executive: rather than announcing a strategic reset, he explicitly disclaimed one. His five priorities — new-vehicle market share, customer-pay gross profit growth, profitable used-vehicle volume, SG&A management, and technology leverage — were, in his words, "not a change in direction."4
That is either reassuring continuity or a sign that the incoming CEO inherited a transition too far along to redirect. Probably both.
The people
Clara, 45, is the product of a career entirely inside one company. He joined in July 2002 in a management-in-training program, spent five years as senior vice president of operations, became chief operating officer on February 17, 2025, and was named CEO-elect that December.1 His public register is granular and operational — units per salesperson, dollars per technician, days' supply, cycle time in the service drive. On calls he reaches for specific store-level metrics rather than strategic abstractions.
David Hult, 60, remains executive chairman under an amended employment agreement through December 31, 2027 with automatic annual renewals.1 A departing CEO staying on as executive chairman is a governance arrangement that deserves scrutiny — it can preserve institutional knowledge or it can leave a new CEO operating in a predecessor's shadow. There is no public evidence yet of which this is.
Michael Welch has been CFO since October 2021; Hult welcomed him to the Q3 2021 call by noting the two had worked together for years at a previous employer.6 His disclosure style is unusually direct for the role: he volunteers negative guidance, quantifies transition costs, and when asked in Q4 2025 whether he could size a specific cost, simply said the company had not quantified it and would do so next quarter.14 He then did.
How they get paid
The compensation structure is where stated priorities become enforceable ones, and Asbury's is narrower than its strategic rhetoric.
The 2025 annual cash incentive was weighted 80% to Adjusted EBITDA, with up to 40% available for strategic objectives — acquisition integration, technology implementation, operating margin relative to peers, and corporate responsibility — and up to 10% for committee review of other initiatives.15 EBITDA came in at 138% of target; the strategic component scored 27 of a possible 40; the final payout was 137% of target. The compensation committee did not exercise discretion to increase it.15
Long-term incentives run through performance share units scored on earnings per share: 70% on 2025 adjusted EPS measured against a target matrix that adjusts for actual industry SAAR, and 30% on adjusted EPS growth relative to an automotive peer group.15
Two observations follow.
First, the SAAR-adjusted matrix is a genuinely thoughtful design. It lowers the EPS bar when the industry cycle is weak and raises it when the cycle is strong, so executives are graded on execution rather than on the macro. Most cyclical-industry pay plans do not bother.
Second — and this is where an activist would push — there is no return-on-invested-capital metric and no total-shareholder-return metric anywhere in the plan. For a company whose entire strategy is deploying billions of dollars of shareholder capital into acquisitions and buybacks, an incentive scheme built on EBITDA and EPS rewards the numerator without policing the denominator. EPS can be manufactured with leverage and repurchases. EBITDA grows mechanically with every dealership purchased. Neither metric asks whether the capital earned its cost.
Executive equity ownership guidelines require the CEO to hold five times base salary in shares, the CFO and COO three times, and other named executives twice.15 Hedging and pledging are prohibited; a recoupment policy exists. Say-on-pay drew approximately 97.6% support at the 2025 annual meeting.15 These are competent governance mechanics. They are also, notably, not a substitute for a returns-based performance metric.
The buyback engine, and what it actually shows
Asbury's capital allocation story is usually told as disciplined countercyclical repurchase. The record is more textured.
In 2023 the company repurchased 1,316,167 shares for $258.1 million; in 2024, 830,297 shares for $183.0 million; in 2025, only 432,752 shares for $99.9 million, because cash was going into Herb Chambers.2 Then in the first half of 2026, with the stock depressed and store divestiture proceeds in hand, it bought 1.35 million shares for $278 million — approximately 7% of the year-end 2025 share count in six months.4
Welch was explicit about the trade-off on the Q2 2026 call: "it is kinda hard to justify an acquisition versus buying back your own shares. It is just that the price we are trading at."4 That is the correct framework, stated plainly. When your own equity yields more than the assets you would buy, buy your equity.
But note what else he said. The company "made the strategic decision to temporarily take on higher leverage given the valuation of our shares," pushing transaction-adjusted net leverage to 3.4 times at the end of Q2 2026 — up from 3.2 times at year-end 2025 and above the stated 3.0 times target, with the return to target now pushed to "early to mid-2027."414
This is the second time in five years that Asbury has deliberately breached its own leverage target. The first time — for Larry H. Miller — it delivered on the promise to de-lever. It has earned some benefit of the doubt. But an investor should recognize the pattern: management's leverage target is aspirational rather than binding, and it gets suspended whenever an opportunity looks compelling. That is a real risk in a cyclical business where the opportunity set looks most compelling precisely when the cycle is turning down.
The share-count myth
A claim that circulates about Asbury deserves correction, because it is half true in a misleading direction.
Weighted average diluted shares were 33.0 million in early 2003 and approximately 18.6 million as of the first quarter of 2026 — a reduction of roughly 44% over the full public history.73 That is genuine, substantial compounding.
But the path was not monotonic. Diluted shares were 19.3 million in 2020, rose to 22.4 million in 2022 as equity was issued to fund Larry H. Miller, then fell to 21.0 million in 2023, 20.0 million in 2024 and 19.5 million in 2025. Anyone who bought at the end of 2020 and held through 2025 saw the count go up before it came down. The buyback machine is real; it is also periodically interrupted by the acquisition machine, and the two compete for the same dollar.
Grading the narrative against the record
The fair assessment of this management team runs three ways.
Where they have been credible: the Park Place walk-away and renegotiation; the post-Miller deleveraging exactly as promised; the advance warning on TCA revenue deferral, given in 2021 and honored with quarterly disclosure ever since; and a consistent, unglamorous willingness to divest stores that do not earn their capital, including exiting two brands outright.
Where they have been less credible: the 2020 five-year plan, whose Clicklane pillar did not materialize and whose revenue target was missed despite acquisition spending far in excess of plan — and which was quietly retired rather than reconciled. Also the recurring pattern of "temporary" leverage excursions.
Where the jury is out: the Tekion migration, which is the single largest operational bet the company has made since Larry H. Miller, and which we are in the middle of right now.
Before we get there, we need to understand why they are doing it.
VII. Stress Tests & Operational Disruptions
On June 19, 2024, CDK Global — the software backbone of thousands of American car dealerships — went dark.
By the following morning, sales managers across the country were writing deals on paper. Service advisors were logging repair orders in notebooks. Nobody could look up a parts price, check a customer's history, run a credit application, or tell a manufacturer that a car had been delivered.
The June 2024 cyberattack
Asbury's account, given on its August 2 earnings call, is the clearest public description of what a dealer management system outage actually does to a business.
Every Asbury store was affected except the Koons dealerships, which happened to run a different platform. Initial DMS access was restored on July 1; full CDK functionality did not return until July 8, with bolt-on applications trickling back for weeks after. Because the outage lasted three weeks, the recovery — manually re-entering everything that had happened offline — took roughly twelve additional days. In parts and service alone, Asbury re-keyed nearly 100,000 repair orders.11
The financial estimate was $0.95 to $1.15 per diluted share for the quarter, from lost new and used sales, the F&I income attached to those sales, reduced parts and service volume, and one-time recovery costs.11 Insurance recovery, Hult said, was "difficult to predict" and excluded from the estimate.11
The operating detail beneath the headline is more instructive. Same-store parts and service gross profit had been pacing at 8% growth through May and finished the quarter at 4%.11 Customer-pay repair order revenue was tracking up 10% and ended up 4%. Warranty revenue was up 17% and finished up 7%. The wholesale parts business — flat through May — ended down 7%, with June alone down 21%.11 Used-vehicle volume was pacing up 1% into June and finished down 2%.
Two things stand out.
First, Clicklane earned its keep. Because it ran independently of CDK and could print and execute documents, Asbury retailed more than 15,200 vehicles through it in the quarter, over 8,000 of them in June.11 The tool that had underdelivered as a growth engine turned out to be a functioning business-continuity system — a use case nobody underwrote in 2020.
Second, Hult's assessment of the recovery was unsentimental in a way that is worth respecting. Asked whether lost sales would come back, he said no: "Parts and services, you miss those opportunities, sell the hours, you don't get those hours back."11 Over half of Asbury's local competitors were not on CDK and operated normally through the outage. A service bay hour that goes unsold is gone forever.
That answer told investors something real about the business. Fixed operations is a capacity business, and capacity does not bank.
From victim to migrant
The strategic consequence was larger than the quarter.
Asbury had already begun piloting Tekion — a cloud-native, single-architecture dealer management system — before the attack, with four stores and a shared service center scheduled to go live in October 2024.11 Asked in the immediate aftermath whether the outage changed his thinking, Hult was measured: every dealership needs a DMS, every industry is exposed to cyberattack, and Tekion would mean "more all eggs in one basket" because there would be far fewer bolt-on applications.11 He described being comfortable with Tekion's security posture while acknowledging that comfort is not immunity.
The migration became a full replacement. It has been brutal.
The self-inflicted wound
By December 31, 2025, Asbury had transitioned 38 stores from CDK to Tekion.2 By the Q2 2026 call, more than 70% of the store base was live, with completion targeted for October 2026.4 The company has been running two dealer management systems simultaneously for over a year.2
The cost shows up everywhere. Q2 2026 adjusted net income excluded $4 million of Tekion implementation expense and $1 million of duplicate DMS cost.4 Q1 2026 excluded $5 million and $1 million respectively.3 But the adjusted-out costs are the smaller problem. The larger one is what Welch calls "frictional" — the productivity a store loses while its people learn a new system.
Clara's description of the mechanics is the most useful public explanation of why enterprise software migrations destroy value before they create it. Conversion happens over a weekend; stores close entirely on the following Monday.3 Then, for four to six months, technicians and advisors and F&I managers who had years of muscle memory in one interface work slowly in another. Sales recovers faster than service, Clara noted, because salespeople adapt more quickly than technicians.4
The Q1 2026 results show the aggregate effect, compounded by severe winter weather across the newly acquired Northeast: same-store new-vehicle revenue down 9%, parts and service gross profit down slightly, adjusted same-store SG&A at 66.9% of gross profit.3 Management estimated weather alone hit gross profit by $19 million and EPS by $0.56.3
Q2 2026 was cleaner but still weak: revenue $4.4 billion, adjusted EPS $6.82, net income $115 million versus $153 million a year earlier.4 Same-store new units down 6%, used units down 14%, parts and service gross profit slightly down.4
Is it working?
This is where an investor has to weigh management's evidence carefully, because the company has an obvious interest in the answer.
The bull evidence is specific and checkable. The former Koons stores, converted in summer 2025 and the most seasoned on the platform, showed gross dollars per technician up 21% year-over-year and service advisor productivity up 16% in March 2026, with in-store support costs down 5%.3 By Q2, Koons showed units per sales manager up 14.2% sequentially and units per F&I manager up 15.2%.4 Across all markets at least five months post-conversion — Koons, Georgia, Florida — June 2026 delivered units per salesperson up 12% and dollars per technician up 10%.4 Total same-store fixed operations gross profit grew 4% in June, and Clara said July tracked similarly.4
The bear reading is equally available. These are cherry-picked cohorts with small denominators, disclosed selectively, in months chosen by management. Sequential comparisons flatter a business recovering from its own disruption. And the promised endpoint keeps arriving later: mid-60s SG&A "after we get the Tekion efficiencies running through" in Q1, then "low 60% range by the end of 2027" in Q2.34
The single most useful discipline for an investor here is to ignore the anecdotes and watch the consolidated ratio. If SG&A as a percentage of gross profit is not falling meaningfully through 2027 with the migration complete and duplicate costs eliminated, the thesis failed regardless of how good the Koons numbers looked.
The interest rate and margin backdrop
Two other pressures deserve brief mention because they shape everything above.
Post-pandemic gross profit normalization is largely, though not entirely, done. New-vehicle GPU peaked well above $4,800 in the supply-starved third quarter of 2021.6 It was $3,432 for full-year 2025 and $2,900 same-store in Q2 2026, with management calling sequential declines "flattening" and pointing to a 53-day supply as supportive.24 The remaining gap to a $3,000 normalized level is now small.
Floor-plan interest, meanwhile, has become a permanent cost line rather than a manufacturer-subsidized rounding error, running $91.2 million in 2025 against $89.9 million in 2024.2 Combined with other interest expense of $187.5 million, Asbury paid roughly $279 million in interest in 2025 against $860.6 million of operating income.2 That is the real price of the acquisition strategy, and it is why the leverage target matters more than it would at an unlevered peer.
The question is whether the moat underneath all this is strong enough to justify the structure.
VIII. Strategic Moat & Competitive Frameworks
There is a war-game worth running before deciding what Asbury is worth: if you had unlimited capital and wanted to destroy it, how would you do it?
You could not simply undercut it on price — the manufacturers set most of the new-vehicle economics. You could not open competing stores nearby — state franchise law and manufacturer allocation would stop you. You could build an online used-car retailer, which several people did, at a combined cost of tens of billions of dollars and one near-bankruptcy. Or you could persuade the manufacturers to abandon the franchise system entirely, which requires changing statutes in fifty state legislatures where dealer associations are among the most effective lobbies in American politics.
None of these is easy. All of them are being attempted. Let us be precise about which parts of Asbury's position are durable and which are borrowed.
Applying the 7 Powers
Scale economies — real, but narrower than advertised. Asbury spreads corporate overhead, IT, procurement, insurance, and increasingly a captive underwriter across 171 locations.2 The evidence that this converts into a cost advantage is partial: Asbury's adjusted operating margin of 5.6% in 2025 was, per its own compensation disclosure, the highest among its automotive peer group.15 That is a meaningful, externally-benchmarked claim. But the scale advantage does not extend to the store level, where a well-run single-point dealer with no corporate cost allocation can match or beat a public group on SG&A. Roughly 90% of U.S. dealerships remain independent, and they have not been driven out of business by scale — they simply eventually sell to it.
Process power — plausible, currently unproven. The claim is a repeatable integration playbook: acquire, retain the local brand and leadership, install standard processes and technology, extract synergies. Larry H. Miller and Koons integrated without visible operational damage, which is not trivial at that scale. But the current Tekion migration is precisely a test of whether process power exists, and mid-test the answer is that it is expensive and slow. The Herb Chambers integration required pausing DMS conversions for all of May 2026 because the group was simultaneously absorbing Asbury's standard processes and shared service center.4 Process power that requires a month of downtime is process power with an asterisk.
Counter-positioning — not Asbury's; the industry's. The physical infrastructure argument is sound: reconditioning capacity, trade-in appraisal, title work, delivery and service bays are locally distributed and expensive, and an online-only entrant must build all of it. But this advantage belongs to every franchised dealer in America equally. It is a category defense, not a company one, and it does not explain why an investor should prefer Asbury to Penske, Group 1, Lithia or Sonic.
Cornered resource — the franchise itself. The genuinely non-replicable asset is 223 franchise agreements in specific geographies, protected by state law, that cannot be purchased at any price without a willing seller and manufacturer consent.2 This is real and it is the reason blue-sky value exists. It is also entirely dependent on a statutory regime that the company does not control.
The other three powers — branding, network economies, switching costs — are largely absent. Consumers do not choose a dealer by parent company. There is no network effect. Switching costs exist only to the extent service relationships create habit, which is a modest, local form of stickiness rather than a structural lock-in.
Porter's Five Forces, honestly scored
Supplier power: high, and the most underrated risk in the story. Manufacturers control inventory allocation, set the margin structure, mandate multimillion-dollar facility upgrades, impose EV certification and charging investments, and hold termination and non-renewal rights under dealer agreements — rights that Asbury's own risk disclosures enumerate in detail, including for "impairment of the reputation or financial condition of the dealership" and "failure to complete facility upgrades."5 The 2021 Mercedes-Benz decision to cut dealer margin by 50 basis points to help fund electrification is a small instance of a large pattern; Hult's response was to call it a partnership investment.6 Brand concentration compounds it: Stellantis stores were roughly 15% of Asbury's rooftops in 2024, and when that portfolio underperformed, it drove the entirety of the company's domestic unit decline.11 In Q2 2026, Stellantis volume was still down 28% sequentially.4
Buyer power: moderate and rising. Price transparency online has compressed new-vehicle margin permanently — the four-year slide from over $4,800 GPU to roughly $3,000 is partly supply normalization and partly information. Affordability is now a genuine constraint: Asbury's average new-vehicle transaction exceeded $52,000 in 2025, and Hult called that "a stretch" that "tends to put pressure on margins."214 Buyer power is much weaker in service, where convenience, warranty coverage and manufacturer-specific diagnostics limit choice.
Threat of new entrants: very low. Inventory, real estate, licensing and franchise availability create a capital and legal barrier that has not been breached at scale by anyone except direct-sale EV manufacturers operating under a different legal theory.
Threat of substitutes: low to moderate, and slow-moving. Ride-hailing and transit substitute at the margin in dense cities. The more serious substitute is the electric vehicle, which we treat as a bear-case item rather than a competitive force, because its threat is to the service annuity rather than to the sale.
Rivalry: high, and consolidating. AutoNation, Penske, Group 1, Lithia, Sonic and Asbury compete for the same acquisition targets, which sets the price of blue sky. Lithia and Penske both carry substantially larger market capitalizations than Asbury. In the acquisition market, rivalry shows up not as price competition for customers but as multiple expansion for sellers — which is precisely why Asbury's decision to buy its own shares instead is defensible.
What the frameworks actually conclude
Strip the vocabulary away and the position is this: Asbury operates inside a legally protected industry structure with genuinely attractive aggregate economics, and holds a modest, contestable position within it. The industry moat is deep. The company moat is shallow.
That is not a criticism. It is a statement about where returns come from. An investor in Asbury is primarily underwriting two things: that the franchised dealer model retains its legal and economic privileges, and that this particular management team allocates capital better than the alternatives available at the price. The second is the differentiator, and it is a capital allocation judgment rather than a competitive advantage.
Which is exactly the shape of the bull and bear cases.
IX. Investment-Story Spine: Bull vs. Bear Case & Core KPIs
Every investment case has a load-bearing wall. Find it, then push on it.
Why Asbury wins from here
The gross profit floor is real and has been stress-tested. The 2007–2009 evidence — parts and service revenue dead flat while new-vehicle revenue fell 35% — is the single most persuasive data point in the entire bull case, because it is out-of-sample.5 It was not a management projection; it was what happened during the worst automotive downturn in living memory. With fixed operations plus F&I now producing roughly 71% of gross profit, the earnings floor beneath a cyclical downturn is materially higher today than it was then.2
The addressable consolidation runway is genuinely long. The overwhelming majority of U.S. dealerships remain family-owned, held by a generation now reaching retirement, facing succession taxes and escalating manufacturer facility requirements. That is a structurally motivated seller base. Asbury has bought four groups of consequence in six years and integrated all of them without a visible operational failure.
The service annuity is strengthening, not weakening, on current evidence. Vehicles on U.S. roads are older than at any point in modern history, and their complexity — advanced driver assistance systems, multiple control modules, sensor-laden bumpers — increasingly requires franchise-level diagnostic tools. Average repair-order dollars for internal combustion vehicles exceeded $550, and Clara reported that plug-in hybrid and battery-electric repair orders were running roughly $350 higher than the average internal-combustion ticket, at comparable margins.144
That last data point deserves emphasis, because it directly contradicts the standard bear thesis, and we will return to it.
Capital allocation optionality is unusually clean. A company generating $465 million of adjusted free cash flow in 2025, with a market capitalization under $4 billion, can meaningfully shrink itself.14 Buying 7% of the share count in two quarters is not a gesture.4 When the stock is cheap, retiring it is a higher-return use of capital than buying dealerships at seven times earnings, and management has demonstrated it will make that switch.
Why the case could break
GPU normalization may not stop where management says. Every guide-down since 2022 has been framed as approaching a floor. The floor has moved from $4,000 to $3,500 to "$2,500 to $3,000" to "closer to about 3,000."143 If global production stays fully supplied and affordability forces manufacturers into incentive wars, new-vehicle gross could compress below the assumed floor. Asbury's mix helps — divestitures are pushing luxury from roughly 32% toward 36% of the portfolio — but mix improvement is a one-time benefit, not a recurring one.14
The EV threat to fixed operations is real, deferred, and currently mismeasured. Battery-electric vehicles have no oil changes, no spark plugs, no transmission fluid, no exhaust, and regenerative braking that extends pad life dramatically. Over a full ownership cycle, routine maintenance demand falls substantially. Asbury's counter-evidence — higher current dollars per repair order on EVs — is real but has an obvious alternate explanation that Clara himself supplied: "there is lots of early stage repairs that have to be done because of this new technology," and he expects those to converge with internal combustion over time.4 In other words, today's high EV repair orders reflect an immature product, not a durable revenue stream. Meanwhile Asbury's own EV exposure fell from about 5% of sales in 2024 to about 2% in 2025 following incentive removal, which delays the problem without solving it.14
Manufacturer encroachment on the economics. Agency-model experiments, direct online pricing control, captive finance arms competing for the F&I customer, and margin reallocation to fund electrification all move economics from dealer to manufacturer without requiring any change in law. This is the erosion that happens quietly.
Regulatory overhang is smaller than commonly assumed — for now. The FTC's Combating Auto Retail Scams Rule, finalized in December 2023 and often cited as an existential threat to F&I economics, was vacated by the Fifth Circuit on January 27, 2025, before its effective date, on the procedural ground that the FTC failed to issue an advance notice of proposed rulemaking.[^17]17 It is not in effect and the agency would have to restart rulemaking. Dealers remain exposed to state consumer-protection enforcement and to the Consumer Financial Protection Bureau's indirect authority over auto finance.2 Asked about it in Q2 2026, Clara's answer was notably free of relief — he said Asbury had "always conducted business the legal and ethical way" and welcomed a level playing field.4 Investors should treat this as a suspended risk, not a resolved one.
Execution risk on the migration is the near-term binding constraint. The company is voluntarily suppressing its own earnings to change its operating system, mid-cycle, having just absorbed a $1.76 billion acquisition, under a first-time CEO. Any one of those is manageable. All four at once is why the shares trade where they do.
The activist stress test
What would a skeptical investor put in the letter?
They would start with pay. An acquisition-driven company with no ROIC and no relative TSR metric in its incentive plan is paying management to get bigger and to engineer EPS, and it paid out 137% of target in a year when adjusted EPS grew 3.2% and the equity did not perform.15 Adding an invested-capital return hurdle would cost nothing and align a great deal.
They would attack the adjustments. Asbury has excluded $290.5 million of asset impairments across 2024 and 2025 from adjusted results, plus acquisition costs, Tekion implementation, weather losses, divestiture gains, and — inconsistently — some but not all duplicate software costs.214 A company that impairs franchise rights at that scale every year while presenting adjusted EPS as the operating truth invites the question of whether the adjustments have become the earnings.
They would question the leverage cadence. Two target breaches in five years, both explained as opportunistic, is a pattern rather than an exception.
They would note the executive chairman arrangement and ask whether a new CEO inheriting a predecessor's strategy, with that predecessor chairing the board through 2027, has the standing to change course if the Tekion economics disappoint.
And they would observe the ownership register: Eminence Capital held approximately 972,405 shares as of a November 2025 filing — roughly 5% of the company — alongside index holders.15 Concentrated positions in a company with a shrinking float and a depressed multiple tend to become vocal if operating results do not turn.
The counterargument to all of it is simple and not weak: the stock is cheap, the cash flow is real, and management is retiring shares aggressively. That combination has historically been enough.
The three KPIs that matter
Ignore almost everything else. Three numbers carry the case.
1. Same-store parts and service gross profit growth. This is the health of the annuity. Management's stated normalized rate is mid-single digits, and customer-pay is the sub-line that matters most, because warranty is outside the company's control and driven by manufacturer recall activity.3 It was flat in Q2 2026 due to the migration; a return to consistent mid-single-digit growth once conversions are complete confirms the moat. Persistent sub-2% growth in a normalized environment falsifies it.
2. SG&A as a percentage of gross profit. This is the entire technology and scale thesis expressed as one number. It was 64.7% for 2025 and 66% on an all-store basis in Q2 2026, and management has committed to the "low 60% range by the end of 2027."24 The migration ends in October 2026. There will be no excuses left.
3. F&I profit per vehicle retailed, adjusted for the TCA deferral. This measures cross-sell execution and the payoff from bringing underwriting in-house. Q2 2026 was $2,210 reported.4 The deferral distorts it in both directions, so the useful figure is the one management discloses before the non-cash adjustment — and the useful test is whether it holds up as the last platform migrates onto TCA and the deferral drag peaks.
Do not compute these. Read them off the quarterly release and the investor deck. They are all disclosed.
X. Primary Evidence & Conference Call Roadmap for Writers
Most of what has been argued here is checkable, and the checking is not hard. Asbury discloses more than most mid-cap industrials, and its earnings calls are unusually substantive — analysts push, and management answers with numbers rather than adjectives.
For a reader who wants to form an independent view, the following is where the evidence lives.
Start with the annual report. The Form 10-K carries the franchise-by-brand table, the revenue and gross profit mix by line of business, the divestiture schedule with manufacturers and states, the impairment disclosures, and the risk factors — including the dealer-agreement termination provisions that quantify manufacturer power more honestly than any strategy deck.2 The full filing history is available through the SEC's EDGAR database.18
The Q3 2021 call is the origin document for the current company. It contains Hult's rationale for Larry H. Miller, his framing of Total Care Auto's economics, Welch's advance warning about revenue deferral, and — usefully for grading purposes — the most bullish contemporaneous statements about Clicklane's trajectory.6 It also captures the peak of the pandemic margin environment, with SG&A at 55.3% of gross profit and new-vehicle gross profit per unit near $4,800, which is the baseline against which every subsequent "normalization" should be measured.
The Q2 2024 call is the best public account of operational fragility in auto retail. Read the prepared remarks for the CDK outage timeline and the segment-by-segment pacing data, then read the Q&A for Hult's answer on whether lost service hours come back. His answer was no.11
The Q4 2025 call marks the strategic handoff. It contains Hult's final full-year framing, the divestiture pipeline, the leverage trajectory, the SAAR assumptions embedded in the TCA deferral forecast, and Welch's honest admission that he had not yet quantified duplicate DMS costs.14 It is also where Hult, asked whether he would be on future calls, said he expected to do one more.
The Q1 and Q2 2026 calls are the live experiment. Read them together. Q1 has the weather quantification, the divestiture-funded buyback, the Koons productivity data, and Hult's handoff to Clara.3 Q2 has Clara's first outing as CEO, the five-pillar framing, the SG&A trajectory to "low 60s by the end of 2027," the used-vehicle strategy shift from margin maximization toward volume, and the direct statement that share repurchases currently beat acquisitions on expected return.4 Full transcripts and analyst Q&A for all of these are publicly available.19
The proxy statement is where the incentives are. Read the annual incentive weighting table and the performance share unit matrix rather than the summary compensation table. The absence of a returns-based metric tells you more about how this company will behave than any strategy section.15
Two outside sources are worth adding. The Fifth Circuit's vacatur of the FTC's CARS Rule is the most important regulatory development for F&I economics in a decade, and the rule's original text is worth reading precisely because it may return in amended form.[^17]17 And for the Tekion migration, trade coverage carries store-level detail that the filings do not.12
What none of these will tell you is how the story ends. But between them, they will tell you whether the three KPIs are moving.
XI. Business Lessons & Epilogue
There is a version of this story that is entirely about cars, and it is the wrong version.
The cash flow behind the curtain
The first lesson is the one that generalizes furthest. In many retail and distribution businesses, the transaction everyone photographs is not the transaction that generates economic profit. Asbury moves roughly $14.7 billion of vehicles a year to produce $881 million of vehicle gross profit, and roughly $3.3 billion of service and financing to produce $2.19 billion of gross profit.2
The vehicles are a customer-acquisition mechanism with a working-capital cost. The service bay and the F&I desk are the business. Any analyst reading a top-line revenue chart for a dealership group — or a supermarket, or an airline, or a printer manufacturer — is reading the least informative number available.
Opportunistic allocation beats consistent allocation
The second lesson concerns capital. Asbury has spent the last six years switching between two uses of cash: buying other people's dealerships and buying its own shares. The switch has been governed by relative price, and management has said so out loud.
That flexibility is worth more than a policy. A company that commits to a fixed dividend or a fixed acquisition cadence surrenders the option to act when one asset class becomes cheap relative to the other. Asbury has kept the option and exercised it in both directions — aggressively in 2021 toward acquisitions, aggressively in 2026 toward its own stock.
The discipline required is the willingness to look inconsistent. Walking away from Park Place in March 2020 and returning in July at a lower price for a better collection of assets is the purest example in the record. So is pausing acquisitions in 2026 to buy back 7% of the company in six months.
The cost of that flexibility is the leverage target that keeps getting suspended. Optionality and discipline are in tension, and this management team has consistently resolved the tension toward optionality.
Physical infrastructure is a moat, but not the one anyone advertised
The third lesson is the one that surprised everyone, including Asbury.
In December 2020, the company told investors that its digital platform would generate $5 billion of revenue and counter-position it against online disruptors. That did not happen. What happened instead is that the online disruptors discovered how hard, capital-intensive and locally distributed the physical side of automotive retail actually is — and that the franchised dealers' service bays, reconditioning capacity, appraisal expertise, title operations and manufacturer relationships were the durable asset all along.
The digital layer turned out to matter most on a June morning in 2024 when everything else went dark, as a business-continuity tool nobody had underwritten.11
There is a broader point here about incumbents facing technological disruption. The instinct is to build the disruptor's product. The more reliable strategy is usually to identify which part of the existing infrastructure is genuinely hard to replicate and invest there — which, in Asbury's case, is exactly what the Total Care Auto acquisition did and what the Tekion migration is now attempting.
Where this leaves things
As of August 2026, Asbury Automotive Group is a company in the middle of a sentence.
It has a first-time chief executive who has worked nowhere else and who describes his strategy as deliberate continuity. It has a predecessor as executive chairman through 2027. It has 30% of its stores still to convert to a new operating platform, with completion promised for October. It has leverage above target and a promise to fix that by early-to-mid 2027. It has a portfolio that is being actively pruned — brands exited, stores sold, luxury mix rising. And it has a stock price that implies the market expects the promised efficiency gains not to arrive.
The honest analytical position is that the case is unresolved and the resolution date is knowable. By the end of 2027, Asbury will either be operating at low-60s SG&A to gross profit with same-store fixed operations compounding at mid-single digits, or it will not. Almost nothing else about the company will have changed materially in that window — the franchise laws will still be there, the service annuity will still be there, the manufacturers will still hold the leverage they hold today.
What makes this a genuinely interesting business story rather than a spreadsheet exercise is that the company chose this exposure. Nobody forced Asbury to rip out its dealer management system in the middle of a demand slowdown, immediately after its largest-ever regional expansion, during a CEO transition. Management looked at a business that was working adequately, concluded that its technology architecture capped how good it could ever get, and voluntarily took a multi-year earnings hit to change it.
That is either the most consequential decision the company has made since Larry H. Miller, or an expensive detour. The evidence to distinguish between them will arrive quarterly, in three numbers, starting almost immediately.
References
-
Asbury Automotive promotes Dan Clara to CEO — WardsAuto, 2025-12-08 ↩↩↩↩
-
Asbury Automotive Group Form 10-K for Fiscal Year Ended Dec 31, 2025 — SEC EDGAR, 2026-02-20 ↩↩↩↩↩↩↩↩↩↩↩↩↩↩↩↩↩↩↩↩↩↩↩↩↩↩↩↩↩↩↩↩↩↩
-
Asbury Automotive Group Q1 2026 Earnings Call Transcript — Seeking Alpha, 2026-04-28 ↩↩↩↩↩↩↩↩↩↩↩↩↩↩↩↩
-
Asbury Automotive Group Q2 2026 Earnings Call Transcript — Seeking Alpha, 2026-07-28 ↩↩↩↩↩↩↩↩↩↩↩↩↩↩↩↩↩↩↩↩↩↩↩↩↩↩↩↩↩↩↩↩
-
Asbury Automotive Group Form 10-K for Fiscal Year Ended Dec 31, 2009 — SEC EDGAR, 2010-03-01 ↩↩↩↩↩↩↩
-
Asbury Automotive Group Q3 2021 Earnings Call Transcript — Seeking Alpha, 2021-10-26 ↩↩↩↩↩↩↩↩↩↩↩↩
-
Asbury Automotive Group Form 10-K for Fiscal Year Ended Dec 31, 2002 — SEC EDGAR, 2003-03-14 ↩↩↩↩↩↩
-
History of Asbury Automotive Group Inc. — FundingUniverse ↩↩↩↩
-
Asbury Automotive Group Form 10-K for Fiscal Year Ended Dec 31, 2020 — SEC EDGAR, 2021-03-01 ↩↩↩↩↩
-
Asbury Automotive Group Form 10-K for Fiscal Year Ended Dec 31, 2022 — SEC EDGAR, 2023-03-01 ↩↩
-
Asbury Automotive Group Q2 2024 Earnings Call Transcript — Seeking Alpha, 2024-08-02 ↩↩↩↩↩↩↩↩↩↩↩↩↩
-
Asbury Automotive's big DMS switch hits the home stretch — WardsAuto, 2026 ↩↩
-
Herb Chambers Companies to be Acquired by Asbury Automotive Group for $1.34B — WilmerHale, 2025-02-21 ↩↩↩
-
Asbury Automotive Group Q4 2025 Earnings Call Transcript — Seeking Alpha, 2026-02-05 ↩↩↩↩↩↩↩↩↩↩↩↩
-
Asbury Automotive Group Definitive Proxy Statement (DEF 14A) — SEC EDGAR, 2026-03-24 ↩↩↩↩↩↩↩↩↩↩
-
Asbury Automotive Group Launches Clicklane and Unveils Its Five-Year Strategic Vision — PR Newswire, 2020-12-02 ↩↩
-
Fifth Circuit Strikes Down FTC's Auto Retail Scam Rule: Key Implications for Dealers — Holland & Knight, 2025-02 ↩↩
-
Asbury Automotive Group SEC EDGAR Filings Database — SEC.gov ↩
-
Asbury Automotive Group Earnings Call Transcripts & Q&A — Seeking Alpha ↩
 LinkedIn
 WhatsApp
 Reddit
 Hacker News
 Email
Email Kindle
 RSS Feed
 Spotify
 Apple Podcasts
 Amazon Music
 Audible
 YouTube