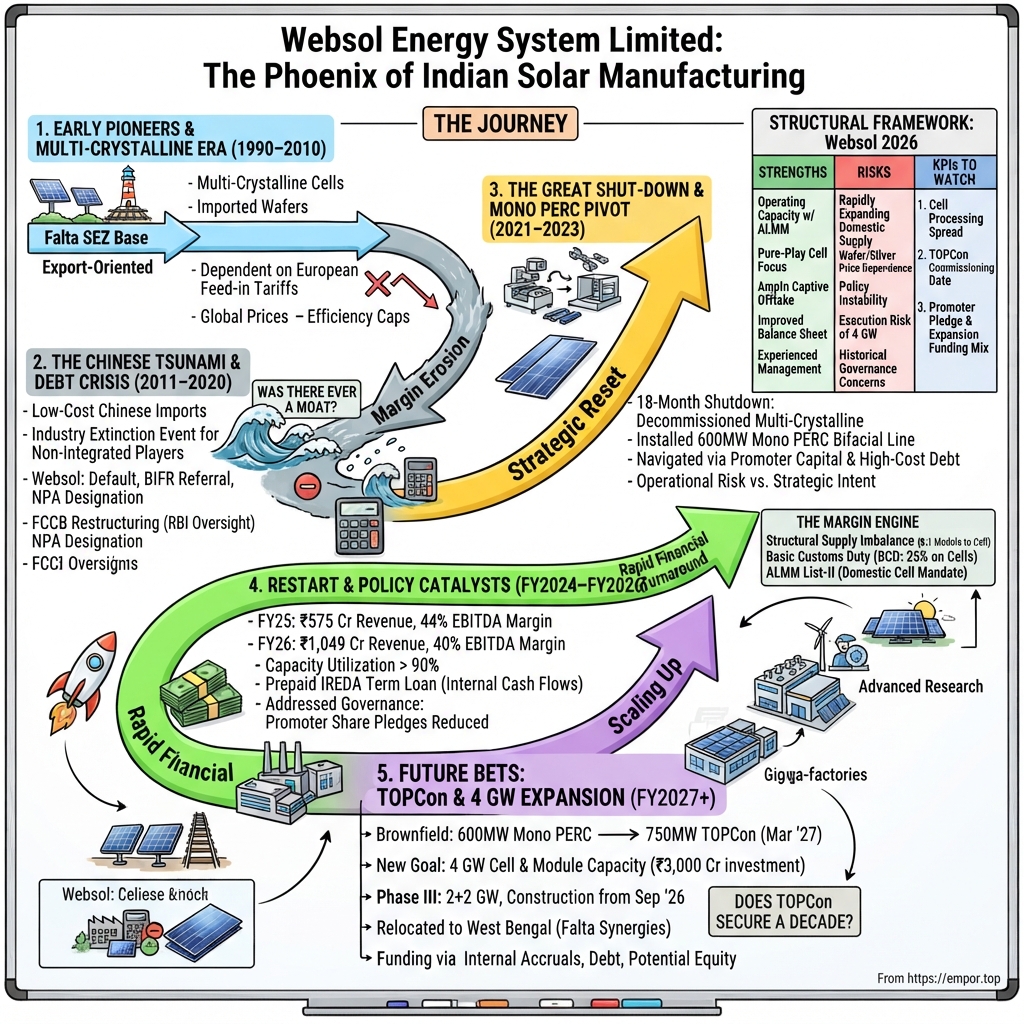
Websol Energy System Limited: The Phoenix of Indian Solar Manufacturing
I. Introduction & Episode Roadmap (0:00 – 0:12)
There is a stretch of road south of Kolkata where the Hooghly River widens toward the Bay of Bengal, the air turns salty, and the landscape flattens into brackish fields and shrimp ponds. At the end of it sits Falta — a Special Economic Zone carved out of West Bengal's coastal delta in the mid-1980s, back when "export processing zone" was still a novel phrase in Indian industrial policy. For most of the last two decades, Falta was rarely visited by institutional investors; it was predominantly a site where capital became trapped in underperforming assets.
Inside that zone sits a solar cell factory that, for eighteen months across FY2023 and FY2024, produced virtually nothing. The assembly lines were idle, and the clean rooms were disassembled. Diffusion furnaces that once processed imported silicon wafers into multi-crystalline solar cells were decommissioned and sold as scrap. The parent entity, Websol Energy System Limited, had spent the preceding decade navigating debt restructuring, default notices, a non-performing asset designation, a referral to the Board for Industrial and Financial Reconstruction, and foreign currency convertible bonds renegotiated at a discount under Reserve Bank of India oversight.1 In FY2024, revenue from operations dropped to ₹25.9 crore — comparable to a mid-sized regional distributor — alongside a net loss exceeding ₹100 crore.2
Two financial years later, the overhauled facility generated ₹1,049 crore in revenue and ₹303 crore in profit after tax, delivering an EBITDA margin above 40%.3 For the June 2026 quarter (Q1 FY27), Websol reported ₹372.6 crore in revenue and ₹78 crore in profit after tax, with cell manufacturing lines running at 92% capacity utilization.4 In early August 2026, the company prepaid its full ₹110 crore term loan from the Indian Renewable Energy Development Agency out of internal cash flows and initiated the process of unwinding promoter share pledges, addressing a persistent governance risk.5
The central operational narrative centers on a 35-year-old manufacturer that halted operations to replace obsolete multi-crystalline equipment, re-emerging as one of India's few pure-play solar cell producers precisely as federal trade policies tightened protection for domestic cell manufacturing.
Macroeconomic conditions represent a major catalyst driving these financial results. India entered 2026 with approximately 210 GW of solar module assembly capacity but only about 27 GW of operational cell manufacturing capacity.6 This represents an eight-to-one structural imbalance between low-barrier module assembly and capital-intensive cell production. To address this gap, the government deployed two primary regulatory levers: a Basic Customs Duty structure enacted in April 2022 levying a 40% tariff on imported modules and 25% on imported cells, and the Approved List of Models and Manufacturers (ALMM) List-II, which took effect on June 1, 2026, requiring government-assisted solar projects to source cells exclusively from listed domestic producers.7 Consequently, enlisted domestic cell capacity currently commands a policy-enforced market premium.
This setup highlights the key analytical tension facing the company. While Websol's FY25 and FY26 operational earnings reflect audited volume growth, they remain heavily reliant on policy-driven supply deficits designed to narrow as national capacity expands. As competing cell facilities come online, high market margins are expected to normalize. Management acknowledges this dynamic, leaving long-term investment outcomes dependent on whether the company can leverage its current cash flows to establish durable advantages in scale, upstream supply integration, and cell efficiency before domestic supply catches up.
The narrative unfolds across several distinct phases. It begins in the 1990s, when a Kolkata-based promoter partnered with a West Bengal state electronics corporation to manufacture solar cells for an early-stage domestic market. It tracks the influx of low-cost Chinese solar components during the 2010s, which eroded Websol's operating margins and strained its capital structure. It analyzes the eighteen-month plant shutdown — the company's most critical strategic risk — and details how a joint venture with AmpIn Energy de-risked the facility restart. The analysis then dissects the unit economics of cell versus module manufacturing under current tariff frameworks, evaluates the company's TOPCon technology conversion and ₹3,000 crore, 4 GW expansion plan, audits corporate governance developments including promoter pledge reductions, and concludes with a structural competitive framework to monitor ongoing operating performance.
 Subscribe on LinkedIn
II. The Eastern Pioneer: Early Days & The Multi-Crystalline Era (1990–2010) (0:12 – 0:28)
In 1990, India's total installed solar photovoltaic capacity was a rounding error. Solar panels in the country were restricted to lighthouses, railway signaling, remote telecom repeaters, and the occasional donor-funded village electrification pilot. Global demand ran in the tens of megawatts annually and was served by a handful of specialists in Germany, Japan, and the United States. Grid-parity solar was not a realistic debate.
Into that nascent market walked Sohan Lal Agarwal, establishing a partnership with the West Bengal Electronics Industry Development Corporation — Webel — the state government's electronics promotion arm. The company was born as Webel Solar, a name it carried for years and that still survives in its NSE ticker, WEBELSOLAR, long after the state connection faded from the equity story.8 The choice of Falta SEZ was deliberate and durable: zone status conferred duty-free imports of capital equipment and raw materials alongside an export-oriented fiscal framework. This structure was critical for a business whose primary input — silicon wafers — was sourced entirely from abroad.
The early trajectory followed a familiar first-generation industrial arc: start small, prove the manufacturing process, and gradually add production lines. Capacity expanded in stages from tens of megawatts to a nameplate capacity of roughly 250 MW of multi-crystalline cells, operating alongside a smaller module assembly line.9 For a period in the late 2000s, Websol ranked among the larger manufacturers of photovoltaic multi-crystalline cells in India, though the broader domestic sector remained small.
Understanding multi-crystalline technology clarifies why this initial choice became the strategic pivot point for the next two decades. A solar cell starts as ultra-pure polysilicon, which is melted into an ingot and sliced into thin wafers. If the melt cools into multiple small crystal grains, it forms a multi-crystalline wafer: inexpensive and fast to produce, but constrained by grain boundaries that scatter electrons and cap conversion efficiency in the mid-to-high teens. If a single continuous crystal is pulled out of the melt via the Czochralski process, it yields a monocrystalline wafer: more expensive and slower to manufacture, but materially more efficient. In 1995, multi-crystalline represented the practical commercial standard. By 2018, it was obsolete.
Websol's business model in this era was export-oriented by necessity. Domestic utility-scale solar demand remained minimal until the launch of the Jawaharlal Nehru National Solar Mission in 2010. Consequently, initial customers were European off-grid integrators and utility-scale developers benefiting from feed-in tariffs in Germany, Spain, and Italy. The SEZ location fit this workflow: the company imported wafers, processed them into cells, and exported the finished units — executing a cost arbitrage by applying Indian labor and overhead to imported inputs and foreign end-markets.
The falsification pass: was there ever a moat here?
A common narrative suggests that early entry into a emerging industry built a durable technical moat through process knowledge, a trained workforce, and established customer relationships. That framing, however, is not supported by the operational record.
Websol did not pull ingots or cut wafers. The company purchased wafers from overseas suppliers and processed them using equipment bought from global toolmakers. Core chemical steps — texturing, phosphorus diffusion, edge isolation, anti-reflective coating, and screen-printed metallization — were standardized across the industry and embedded directly in the machinery. Websol held no proprietary intellectual property, possessed no cost advantage beyond basic location and scale, and lacked upstream supply integration. Consequently, gross margins depended on the spread between imported wafer costs and prevailing cell market prices, both of which were determined by global market dynamics.
This structural vulnerability showed in asset productivity metrics. Net fixed asset turnover — the revenue generated per rupee of plant investment — declined steadily through the 2010s rather than improving with cumulative production experience.1 An operation possessing a genuine process moat typically generates higher capital productivity over time; Websol's capital productivity dropped.
The early history demonstrates a company establishing an operational footprint rather than building a defensive economic moat. Websol acquired three pragmatic assets: a licensed and operating industrial site within an SEZ, an experienced cell-line workforce, and institutional familiarity with cell manufacturing. These capabilities provided the foundation that enabled the company to restart operations in 2024 once capital and policy conditions aligned. However, they did not constitute a permanent competitive advantage, nor did they shield the business from impending structural shifts in global manufacturing.
What followed was the rapid expansion of Chinese solar manufacturing.
III. The Chinese Solar Tsunami & The Corporate Debt Restructuring Crisis (2011–2020) (0:28 – 0:48)
The numbers that broke Websol were not generated in India. They were generated in Wuxi, Baoding, Changzhou, and Shangrao, by companies whose scale Indian manufacturers learned to dread: 尚德电力 Suntech Power, 英利绿色能源 Yingli Green Energy, 天合光能 Trina Solar, and 晶科能源 JinkoSolar.
The mechanism was straightforward and, from a policy standpoint, brutally effective. Chinese provincial governments, state banks, and the central government treated solar manufacturing as strategic infrastructure rather than as a commercial venture required to earn its cost of capital. Land came cheap or free. Credit arrived at policy rates with policy patience. Capacity was added far in excess of immediate demand, and the resulting glut was exported. Between 2008 and the middle of the 2010s, global module prices collapsed by roughly 80%, dragging wafer and cell prices down with them.
For the global economy, this surge created one of the great deflationary shifts in modern industrial history: solar transitioned from a subsidized curiosity to the cheapest source of new electricity on the planet in roughly fifteen years. For non-Chinese manufacturers operating without a protected domestic market, it proved to be an extinction event. German and American cell makers went bankrupt in waves. Suntech and Yingli themselves eventually collapsed under their own debt burdens, underscoring the fragile economics of the strategy that disrupted the global market.
India, at that juncture, made a strategic choice to prioritize cheap solar electricity over domestic manufacturing capacity. The National Solar Mission's reverse-auction framework rewarded developers who bid the lowest tariffs, which were consistently achieved using the lowest-cost Chinese modules. Early attempts at domestic content requirements were challenged at the World Trade Organization and largely neutered. Indian developers imported at scale, and by the late 2010s, the vast majority of solar modules deployed across India were foreign-sourced.
Websol was caught on the wrong side of every structural shift simultaneously. Its production was concentrated in multi-crystalline technology while global demand migrated toward monocrystalline architectures. Cell efficiency lagged behind moving benchmarks. Its manufacturing capacity remained a fraction of Chinese competitors adding gigawatts of scale annually. Crucially, its primary input—silicon wafers—was imported from China, meaning cost deflation reached Websol far more slowly than price deflation hit its end products. Compounding these operational disadvantages, the company had financed its earlier expansion with debt.
The operational fallout followed predictably. The company defaulted on its debt obligations in FY2012 and entered debt restructuring. In FY2013, it was classified as a non-performing asset and referred to the Board for Industrial and Financial Reconstruction, India's then-operative regime for distressed companies.1 Plant capacity utilization plummeted, forcing lenders to accept write-downs and liquidate collateral. In September 2016, the Reserve Bank of India approved a restructuring of Websol's outstanding foreign currency convertible bonds: shareholders approved settling a principal of US$16.8 million at US$12 million, alongside a complete waiver of roughly US$11.7 million in accrued and penal interest.10 This restructuring imposed a substantial haircut on foreign bondholders—a historical precedent that remains essential context when evaluating the company's current balance sheet metrics and promoter track record.
The falsification pass: did past capital deployment build anything durable?
Evaluating this period requires examining whether past capital deployment yielded durable assets. While economic moats can be debated, capital write-downs provide an objective metric.
The initial investment thesis held that Websol's multi-decade presence built a resilient manufacturing base capable of navigating cyclical downturns. However, the financial record demonstrates that between 2011 and 2022, the company burned cash, defaulted on debt, operated as a non-performing asset, renegotiated obligations at a discount, and lacked the capital to fund internal research or upgrade to monocrystalline PERC technology. Ultimately, the entire 250 MW multi-crystalline asset base—representing two decades of accumulated capital allocation—was decommissioned and scrapped. Websol recorded a substantial asset impairment in the December 2023 quarter, reporting a net loss of ₹54 crore for the period.11
In economic terms, the residual value of a decade of solar manufacturing capital expenditure approached zero. The company retained only its real estate, building structure, operating licenses, and core workforce.
This outcome represents a critical baseline for evaluating the company's current ₹3,000 crore expansion plan. It establishes an empirical track record: the management team previously lost an entire generation of capital by holding legacy technology past its market viability. While this historical context does not guarantee a repeat outcome, it raises the analytical burden of proof for the current capital expenditure cycle. The primary strategic question regarding TOPCon technology is not whether it improves upon PERC, but how many years of cash flow it will generate before next-generation architectures render it obsolete.
A subtle aspect of the restructuring era warrants note: Websol did not liquidate. Across a decade when exiting the business might have seemed rational, the promoter group maintained the corporate entity, preserved the SEZ site, retained licenses, and kept a core operational team in place. Whether driven by conviction, sunk-cost persistence, or an absence of buyers, this continuity made the subsequent turnaround possible. That recovery began with a counterintuitive operational decision: shutting down the entire manufacturing facility.
IV. The Great Shut-Down: Dismantling Legacy Lines & The Mono PERC Pivot (2021–2023) (0:48 – 1:08)
Consider the board discussion in 2021. The company was barely solvent, its lenders had already endured one restructuring, its equity traded as a penny stock, and its legacy product was uncompetitive. Yet management proposed halting production entirely — not for a routine maintenance shutdown, but for as long as it would take to dismantle every furnace and printer, rebuilding the facility around an entirely different technology.
Beginning in FY2023, Websol suspended manufacturing for roughly eighteen months, dismantling its legacy multi-crystalline lines to install a fully automated 600 MW Mono PERC bifacial cell line and a 550 MW module line at Falta.2
The technology logic was straightforward. Passivated Emitter and Rear Cell (PERC) technology adds a dielectric passivation layer to the back of the silicon wafer. In a conventional cell, light passing unabsorbed through the silicon escapes into the rear metal contact as heat. The passivation layer reflects unabsorbed light back through the wafer for a second pass while reducing charge carrier recombination at the rear surface. Paired with monocrystalline wafers — single continuous crystal lattices rather than mosaics of grains — cell efficiency increases from the high teens to roughly 22.5–23%. A bifacial design replaces the solid rear contact with a metal grid, allowing the cell to capture reflected light from the ground beneath it, boosting annual energy yields in utility-scale solar fields at minimal incremental cost.
This upgrade was not incremental. It represented the difference between a product obsolete in modern utility tenders and one capable of competing for commercial supply contracts.
The financial cost of the transition reflected the severe reality of voluntarily halting production. In FY2024, revenue from operations collapsed to ₹25.9 crore, and the company posted a net loss of approximately ₹121 crore as asset write-downs were recognized alongside fixed overhead.2 With operating cash flows suspended, working capital drained rapidly. Websol navigated the shutdown through promoter infusions and high-cost credit facilities, emerging from the transition carrying debt that included an IREDA term loan.
The falsification pass: was this a planned, seamless reset?
Management has consistently framed the shutdown as a deliberate strategic reset designed to position the company for an impending policy shift. While the strategic rationale proved sound, describing the execution as seamless does not — a distinction critical for evaluating current management guidance.
The transition timeline stretched significantly beyond initial expectations. An eighteen-month revenue blackout represents strategic intent compounded by execution slippage. Structurally unable to service debt or overhead from operations, Websol relied on promoter capital and high-cost borrowing to survive. Furthermore, because the Basic Customs Duty framework was enacted in April 2022, the company spent the initial two years of a protected domestic market with an offline facility. Competitors that re-tooled iteratively without a complete operational freeze captured early tariff-sheltered demand, while Websol remained sidelined.
The strategic conclusion is clear: the direction of the pivot was vindicated by subsequent operating performance, but the execution was sluggish, capital-destructive in the interim, and dependent on stopgap financing. This pattern of sound strategic positioning paired with extended execution timelines provides an essential baseline for evaluating management's timeline commitments for its TOPCon upgrades and 4 GW expansion.
While manufacturing remained suspended, the policy environment shifted decisively in Websol's favor. The Basic Customs Duty structure introduced in April 2022 imposed tariffs of 40% on imported modules and 25% on imported cells.7 Concurrently, the government expanded the Approved List of Models and Manufacturers (ALMM), creating a mandatory non-tariff barrier. While List-I restricted imported modules, List-II applied to solar cells — becoming compulsory for eligible projects commissioned on or after June 1, 2026.12
This regulatory shift was amplified by a structural bottleneck: India had built substantial module assembly capacity but negligible cell manufacturing. Module assembly involves laminating pre-fabricated cells into glass and aluminum frames, whereas cell manufacturing requires semiconductor-adjacent process engineering. Capital had overwhelmingly favored low-barrier module assembly, leaving hundreds of gigawatts of assembly capacity competing for scarce domestic cells once ALMM List-II took effect.13
Websol restarted into that supply deficit — though it did not undertake the restart alone.
V. The AmpIn Energy Alliance & The FY25 Operational Turnaround (1:08 – 1:28)
Restarting a distressed manufacturer presents a dual challenge: securing capital for equipment and securing customers to absorb output. A company emerging from debt restructuring faces tight credit access and limited commercial credibility. Utility-scale solar developers rarely place bankable supply orders with a factory that was offline for eighteen months.
To resolve both financing and off-take constraints, Websol formed a joint venture in September 2022 with Amp Energy India (subsequently AmpIn Energy Transition), a major commercial-and-industrial renewable power producer. The agreement established a framework to manufacture up to 1.2 GW of mono PERC cells and modules at the Falta site across two 600 MW phases, financed with debt and equity, with Websol holding 51% and AmpIn 49%.14
The critical commercial element was off-take: AmpIn agreed to purchase up to 50% of production for its own project pipeline, with the balance sold into the open market.15
This structure substantially reduced operational risk. Securing a captive customer for up to half of output converted a speculative merchant bet into a partially de-risked asset, providing predictable cash flows for lenders. Furthermore, AmpIn's 49% equity stake served as a strong quality signal to prospective buyers.
However, the agreement contains notable limitations. An off-take capped at "up to 50%" provides no guaranteed volume floor or price protection; buying at market prices removes volume risk, not price risk. Additionally, because AmpIn holds 49% of the operating joint venture, nearly half of the cash flow generated by this capacity does not accrue to Websol's public shareholders.
Financial results following the restart were swift and substantial.
In FY2025—the first full year with the rebuilt line running—operating revenue rose to ₹575.5 crore from ₹25.9 crore in FY2024, driving a turnaround from a net loss of ₹121 crore to a profit after tax of ₹154.7 crore.2 The company reported an EBITDA margin of 44.2% and a net profit margin of 26.9%.2 Equity markets reacted promptly to the Q4 results in May 2025, triggering a sharp share price re-rating.16
These operating margins require careful interpretation. A 44% EBITDA margin is unusual for a high-volume manufacturing business processing standardized inputs into commodity solar cells. In competitive global markets, cell manufacturing operates at single-digit to low-double-digit EBITDA margins, and frequently at a loss. Websol's margin reflected an acute domestic supply shortage behind protective tariffs rather than superior manufacturing efficiency. In FY2025, domestic cell availability commanded a distinct policy premium.
In FY2026, Websol scaled output while maintaining strong margins. Full-year revenue reached ₹1,049 crore, with EBITDA of ₹429 crore at a 40.8% margin and net profit of ₹303 crore.3 The fourth quarter contributed ₹401 crore in revenue and ₹125 crore in profit after tax.3 Cell line utilization exceeded 90%, while module utilization reached 74%, supported by the September 2025 commissioning of Cell Line-2, which expanded total cell capacity to 1.2 GW.317 The order book closed the financial year at ₹1,161 crore.3
Performance remained robust in the June 2026 quarter (Q1 FY27), with revenue rising 70% year-over-year to ₹372.6 crore and profit after tax reaching ₹78 crore.4 Cell production doubled year-over-year to 259 MW, module production reached 103 MW, and the order book expanded to ₹1,278 crore.4
However, Q1 FY27 results also revealed early signs of margin normalization. Although EBITDA grew 21% year-over-year to ₹126 crore, the EBITDA margin contracted by approximately 1,300 basis points, dropping from roughly 47% to 34%.4 Generating 70% revenue growth alongside 21% EBITDA expansion indicates that volume was added at lower unit economics.
Management attributed this margin compression to product mix, specifically a higher share of lower-margin module sales relative to cells. This explanation is plausible given that module output more than doubled and module assembly carries lower gross margins than cell manufacturing. However, rapidly expanding domestic cell capacity across India suggests that narrowing cell spreads may also have played a role. Because Websol does not report cell-level realizations separately, tracking margin trends remains an essential analytical metric for coming quarters.
Balance sheet strength improved alongside operating results. FY2026 closed with gross debt of ₹118 crore offset by ₹152 crore in cash, creating a net cash surplus of ₹34 crore.3 On August 4, 2026, Websol prepaid its entire ₹110 crore IREDA term loan using internal accruals, eliminating term debt without raising equity or deferring capital expenditures.5
This loan payoff demonstrated improved capital discipline, prioritizing debt reduction over rapid cash deployment. It also cleared the way for addressing promoter share pledges, setting up the broader governance narrative.
VI. Industry Structure & Economic Mechanics: Cell vs. Module Dynamics Under BCD & ALMM (1:28 – 1:52)
The solar value chain runs in one direction, with manufacturing complexity and capital intensity increasing at each upstream stage:
$$\text{Polysilicon} \longrightarrow \text{Ingot/Wafer} \longrightarrow \text{Solar Cell} \longrightarrow \text{Module Assembly} \longrightarrow \text{EPC / Project}$$
Websol sits primarily at step three, maintains a secondary footprint in step four, and has stated ambitions to expand upstream into step two.
Module assembly takes finished solar cells, strings them together with soldered ribbon, laminates them between glass and a polymer backsheet using encapsulants, frames the structure in aluminum, and attaches a junction box. While precision quality control is required to ensure a 25-year operational lifespan, the assembly process is standardized, equipment is available off the shelf, lines can be commissioned within months, and capital intensity per gigawatt is modest. As a result, India built roughly 210 GW of module capacity by the end of 2025, adding about 119 GW in that single year.13 With low barriers to entry and rapid capacity growth, module assembly margins compressed to mid-single digits in EBITDA terms, turning assembly into a low-margin conversion service.
Cell manufacturing presents far higher technical and capital barriers. A silicon wafer undergoes chemical texturing to trap light, high-temperature dopant diffusion to create p-n junctions that separate electrical charge, edge isolation, deposition of passivation and anti-reflective coatings, and screen-printed metallization using silver paste. This process requires semiconductor-grade clean rooms, high-temperature furnaces, and strict process engineering to maintain yields. Capital intensity reaches several hundred crore rupees per gigawatt, commissioning takes a year or more, and scaling production requires specialized technical personnel who remain scarce in India. Consequently, India added only about 9 GW of cell capacity in 2025 against 119 GW of module capacity,13 leaving cumulative domestic cell capacity at roughly 27 GW by December 2025.6
This structural imbalance—an eight-to-one ratio of module assembly to cell manufacturing—drives current domestic solar economics. With federal regulations requiring eligible projects to source cells domestically, pricing power shifts to cell producers. Under a 25% Basic Customs Duty on imported cells, domestic cell makers can price up to the landed cost of imports plus the tariff. Approved List of Models and Manufacturers (ALMM) List-II imposes an even stricter barrier: foreign cells lacking listing are legally excluded from government-assisted projects. This combination of tariff protection and regulatory exclusion allows cell manufacturers to capture wide processing spreads—the margin earned per watt for turning an imported wafer into a domestic cell. That policy-enforced spread, rather than raw volume growth, generated Websol's 40%-plus EBITDA margins.
However, every element of this margin engine depends on conditions outside the company's direct control.
The falsification pass: is domestic cell capacity actually a moat?
Three operational and regulatory mechanisms threaten this margin umbrella.
First, domestic supply is rapidly catching up. ALMM List-II enlisted cell capacity crossed 30 GW by the April 2026 revision, up from roughly 29.3 GW in the prior update, and continues to climb.18 Market competitors including Premier Energies, Waaree Energies, Adani's Mundra complex, Tata Power's Tamil Nadu facility, Vikram Solar, and Goldi Solar are expanding cell capacity, while Reliance Industries has announced giga-scale build-outs. Because enlisted cell capacity is growing faster in percentage terms than module assembly, the supply deficit driving high processing spreads will narrow over a three-to-five-year horizon. The margin compression observed in Q1 FY27 is consistent with the early stages of this capacity rebalancing.
Second, domestic cell producers rely heavily on imported raw materials. Websol and its domestic peers import virtually all silicon wafers, predominantly from China and Chinese-owned facilities in Vietnam, Malaysia, and Laos. This leaves input costs exposed to foreign suppliers who also compete in downstream global markets. If wafer prices increase or export restrictions tighten, cell spreads compress immediately. Silver paste represents another key cost variable, as TOPCon technology consumes more silver than legacy PERC cells. Websol reduced silver consumption by 20% during FY2026, targets a further 10% reduction, and is evaluating alternative metallization techniques to manage material costs.19
To mitigate wafer dependence, Websol signed a memorandum of understanding with Linton Crystal Technologies to support a prospective Indian ingot and wafer manufacturing facility.17 Because an equipment partnership MoU represents an initial exploratory step without disclosed capital commitments or firm commissioning dates, it functions as an option to monitor rather than completed integration. However, policy trends reinforce its strategic relevance: the government has proposed mandating domestic wafers under ALMM starting June 1, 2028, subject to at least three independent domestic manufacturers achieving a combined 15 GW of capacity.13 If enacted on schedule, cell producers lacking upstream wafer supply could face operational bottlenecks.
Third, tariff structures and certification lists remain vulnerable to policy adjustments. Solar project developers face higher equipment costs when cell processing spreads expand. With India installing a record 15.3 GW of solar capacity in the first quarter of 2026 alone,20 supply bottlenecks or elevated cell prices that slow project execution could generate political pressure to grant exemptions, ease implementation timelines, or lower tariffs. The ALMM order already contains exemptions for projects bid before its issuance,12 and market commentators have highlighted domestic cell shortages alongside financial stress among standalone module assemblers.21
These dynamics indicate that domestic cell capacity does not constitute an unassailable economic moat. Instead, Websol operates within a regulatory window supported by temporary supply deficits and tariff protections. As domestic supply expands, cell margins are expected to normalize toward historical industry averages.
Websol retains distinct regional advantages as a pure-play cell manufacturer in Eastern India, benefiting from Falta SEZ fiscal terms, port access at Kolkata and Haldia, and a captive off-take arrangement with AmpIn Energy. However, the company remains significantly smaller than industry leaders such as Premier Energies and Waaree Energies, which operate at multiples of Websol's capacity, possess larger balance sheets, and are pursuing aggressive vertical integration. This scale disparity underpins management's rationale for its proposed ₹3,000 crore capital expenditure program.
VII. Future Bets: TOPCon Expansion, Capital Deployment, & The 4 GW Vision (1:52 – 2:15)
There is a striking operational symmetry to Websol's actions in 2026. Flush with cash for the first time in two decades, the company is dismantling a fully functional 600 MW Mono PERC line — commissioned during the rebuild that rescued the business — and converting it to a newer cell architecture. When Websol previously decommissioned a working cell line, it did so after waiting too long. This time, management is acting early, upgrading an asset that is roughly three years old — a move that demonstrates how rapidly capital equipment depreciates in economic terms within solar manufacturing.
The upgrade converts a 600 MW PERC line into a 750 MW TOPCon line, lifting total cell capacity to 1.35 GW, with TOPCon representing roughly 55% of the total mix.17 The estimated investment is approximately ₹270 crore, with completion targeted for March 2027 and expected cell conversion efficiency exceeding 25%.1719
TOPCon — Tunnel Oxide Passivated Contact — addresses a key physics bottleneck inherent to PERC technology. In a standard silicon cell, the interface where metal contacts silicon creates high charge-carrier recombination, causing efficiency losses. PERC mitigated this by covering most of the rear surface with a dielectric passivation layer and making contact only through localized microscopic openings. TOPCon inserts an ultra-thin silicon oxide layer — roughly one nanometer thick, allowing electrons to quantum-mechanically tunnel through — between the silicon wafer and a thin layer of doped polysilicon. Electrons pass freely, while carrier recombination at the contact point is largely suppressed. This architecture yields higher conversion efficiency — around 25% compared to 22.5–23% for PERC — along with a lower temperature coefficient that reduces power loss in high-ambient heat and improves long-term cell degradation profiles.
The economic rationale for converting a three-year-old line rests on total project balance-of-system dynamics. Because utility developers purchase modules on a per-watt basis while fixed system costs — including land, mounting structures, cabling, and installation labor — remain constant per module, higher-efficiency cells lower overall project cost per watt. Consequently, TOPCon commands a market price premium, accelerating the global phase-out of PERC lines. Retaining PERC capacity past its economic window risks repeating the technology obsolescence that crippled the company in the 2010s.
Beyond the TOPCon conversion lies a significantly larger capital commitment. In early September 2025, Websol's board approved an expansion plan to add 4 GW of solar cell and 4 GW of solar module capacity in two phases through a wholly owned subsidiary, representing an estimated investment of ₹3,000 crore, alongside a 1:10 stock split.2223 Funding was framed as a combination of internal cash flows, debt facilities, and potential equity or warrant issuances.22 The company initially executed a memorandum of understanding with the Andhra Pradesh Economic Development Board for the project before reversing course in 2026 to relocate the expansion to West Bengal, adjacent to its existing Falta site.24
Executive Director Sanjana Khaitan explained the strategic pivot during the Q1 FY27 earnings call in terms of operational efficiency: "We felt that doing it here we will be able to get the requisite synergies on account of supply chain, manpower, and just be able to execute faster," citing lower land costs relative to Andhra Pradesh and declining global equipment prices.24 The disclosed timeline indicates construction starting in mid-September 2026 under a nine-month build plan, with equipment ordering targeted for December 2026 and delivery expected in April–May 2027.24 Total capacity targets and funding structures remain unchanged, with Phase III adding 2 GW of cells and 2 GW of modules, bringing total planned capacity toward 5.2 GW of cells and 4.5 GW of modules by the end of the decade.2522
This capital allocation strategy presents two key analytical considerations.
First, relocating the expansion adjacent to Falta leverages existing infrastructure and workforce experience, reducing execution risks compared to a greenfield development in a new state. Conversely, walking back a publicized state MoU within a year indicates that initial expansion plans were announced before site selection and logistics were fully finalized.
Second, the operational scale of these two investments differs dramatically. The existing core operation — 1.2 GW of cell capacity and the module line — is proven, fully operational, and generates current cash flow. The ₹270 crore TOPCon conversion represents a localized brownfield project managed by the current team on familiar terrain. By contrast, the ₹3,000 crore, 4 GW expansion represents a tenfold increase over recent capital expenditures, requiring unraised debt or equity financing, regulatory land clearances, sustained long-term tariff protections into the 2030s, and unfulfilled equipment orders. Consequently, the 4 GW program functions analytical as a long-term growth option rather than an assured operational baseline.
The falsification pass: does TOPCon secure a decade?
Empirical industry trends suggest it does not.
Photovoltaic technology cycles operate on five-to-seven-year turnover windows, and processing shifts continue to accelerate. Heterojunction (HJT) cells — which layer amorphous silicon onto crystalline wafers to achieve higher conversion efficiencies and superior temperature performance than TOPCon — are already in commercial production among tier-one global manufacturers, constrained primarily by higher capital expenditure per gigawatt and precious metal consumption. Concurrently, perovskite-silicon tandem cells have surpassed 33% efficiency in laboratory conditions, with commercial viability dependent on resolving moisture and thermal degradation challenges. Back-contact cell designs represent another competing architecture gaining market traction.
Websol previously decommissioned its multi-crystalline assets after holding obsolete technology past its economic viability. The current transition into TOPCon positions the company as an industry adopter rather than a technological pioneer, as TOPCon has already become the prevailing global standard. If executed on schedule, the 4 GW expansion will bring online substantial TOPCon capacity between 2027 and 2029, a window when competing HJT capital costs are projected to approach parity.
Asserting that TOPCon guarantees a decade of market leadership is unsupported by technical trends. TOPCon represents an effective commercial choice for capacity deploying in 2027, backed by domestic policy protection that offers strong near-term cash generation. However, realizing full long-term returns will depend on management's agility in re-tooling lines when next-generation architectures reach scale. The key empirical indicator to track will be the emergence of large-scale domestic project awards won by HJT or tandem technologies at price points that TOPCon lines cannot match.
Evaluating whether management can successfully navigate these technology transitions requires shifting focus from plant economics to corporate governance and leadership track record.
VIII. Management Quality, Governance, & Promoter Shareholding Audit (2:15 – 2:32)
Sohan Lal Agarwal has led Websol for over 35 years, steering the business through a state-sector partnership, an export boom, a Chinese supply surge, bank defaults, non-performing asset designations, debt restructuring, a complete plant shutdown, and an operational turnaround. Few Indian industrial promoters have navigated such a prolonged sequence of financial distress while remaining at the helm. In April 2026, shareholders approved a three-year extension of his tenure as managing director.26
Management's public communications remain measured relative to small-cap peers in the renewable sector. During the Q1 FY27 earnings commentary, Agarwal focused strictly on operational metrics: "Revenue is up 70% over the same quarter last year and both our lines are running close to the levels we had planned for, with cell utilisation at 92% and module utilisation at 81%."17 Executive Director Sanjana Khaitan has assumed an expanding role in strategic communications, explaining the decision to relocate the expansion project to West Bengal based on operational synergies, supply chain access, and execution speed rather than promotional capacity targets.24
Set against this operational continuity, the company's governance profile reveals a structural vulnerability alongside a recently resolved risk factor.
The primary structural weakness is low promoter shareholding. At approximately 29.72%, the promoter group owns less than a third of the company's equity—a low level for an Indian family-controlled manufacturer, where promoter stakes typically range between 50% and 75%.27 A modest promoter holding carries dual implications. While it limits promoter control and reduces potential risks of minority shareholder expropriation, it also dilutes alignment, as the promoter receives under 30 paise of every rupee of equity value generated. Furthermore, a low ownership base increases vulnerability to hostile control actions and heightens equity dilution risks. Given the proposed ₹3,000 crore capital expenditure program—with equity or warrants identified as potential funding mechanisms—dilution remains a central analytical concern for public shareholders.
The improving factor is the rapid reduction in promoter share pledges.
For years, the overwhelming majority of promoter shares were pledged to secure company borrowings, serving as collateral for credit facilities during the shutdown and for the IREDA project loan. Public filings as recently as June 2026 showed pledge levels near 89% of total promoter holdings.27 Disclosures during that period also recorded fresh pledges by promoter entities—including SL Industries pledging 6 million shares, Websol Green Projects pledging 5 million shares, and Sohan Lal Agarwal personally pledging 1 million shares—against loans from private corporate lenders such as Merlin Projects and Ellenbarrie Industrial Gases.
The risk associated with share pledges is mechanical rather than administrative. Pledged shares function as financial collateral. If the equity price declines sharply, lenders issue margin calls; if unfulfilled, lenders can liquidate the shares into the open market. This mechanism can transform an ordinary share price decline into forced market selling, driving prices down further and triggering additional calls. At an 89% pledge ratio, this dynamic represented the single largest non-operational risk to Websol's equity structure.
The August 4, 2026 prepayment of the ₹110 crore IREDA term loan using internal accruals functioned primarily as a collateral release event rather than a deleveraging milestone, given that Websol was already in a net cash position. Following the prepayment, the pledged portion of promoter shareholding dropped from roughly 80% to 16%, with all collateral securities under the facility slated for release.5 Subsequent public records in September 2026 confirmed that promoters released 9.51 crore pledged shares, representing approximately 21.92% of total equity capital.27
This release represents a significant governance improvement, funded entirely by operating cash flows rather than equity dilution. However, two analytical caveats remain. First, releasing pledged shares resolves a vulnerability created by previous capital structure decisions rather than constituting an affirmative governance enhancement; the standard benchmark remains peer companies that avoid high pledge levels entirely. Second, because pledges were also extended to secure loans from non-bank corporate entities, tracking residual pledges and loan covenants remains necessary in upcoming quarterly disclosures.
Credibility, weighed.
On the positive side, management preserved the corporate entity through extended restructuring, structured the AmpIn joint venture to share capital risk, delivered FY25 and FY26 operating results that exceeded distress-turnaround expectations, prioritized debt reduction over rapid cash deployment, and demonstrated a willingness to decommission functioning lines rather than operate obsolete technology.
On the negative side, the FY23–24 technology transition experienced execution slippage beyond initial projections; the Andhra Pradesh state MoU was publicly announced and subsequently abandoned within a year; disclosure regarding long-term wafer supply contracts remains limited despite wafers representing the primary cost and supply risk; and historical promoter willingness to pledge shares to near-total levels reflects a high tolerance for balance-sheet risk.
On earnings calls, analyst inquiries have focused on three operational friction points. Inquiries regarding pledge reductions were initially met with general statements of intent until the IREDA prepayment provided cash verification. Questions regarding wafer price pass-through mechanisms continue to yield qualitative explanations regarding product mix and contract structures rather than disclosed pricing terms. Finally, commitments regarding the March 2027 TOPCon commissioning timeline represent verifiable benchmarks against which management's execution track record will be evaluated.
This interplay—an experienced management team, strong near-term operating cash flows, and a governance profile undergoing active remediation—defines the core analytical evaluation for investors.
IX. Playbook: Key Business & Investing Lessons (2:32 – 2:48)
1. Policy protection can manufacture a cash machine overnight — and can unmake it just as fast.
The Websol case functions almost as a controlled experiment. Same industrial site, same promoter group, and a broadly similar position relative to the global technological frontier, yet a radically different outcome — because the policy regime shifted. Import duties on solar cells and a mandatory certification list excluding foreign components transformed an unviable manufacturer into a business generating EBITDA margins above 40% within two years. The investment takeaway is not to avoid policy-dependent businesses; government-created profit pools can be exceptionally lucrative. Rather, it is that a regulatory moat is borrowed, not owned. Granted by policymakers balancing industrial employment against clean energy costs, that protection remains subject to ongoing recalibration. Valuing such businesses requires analyzing the duration and stability of policy support rather than extrapolating peak margins into perpetuity.
2. In a fragmented value chain, own the bottleneck, not the popular step.
Hundreds of Indian entrepreneurs established module assembly lines because assembly required modest capital and short setup times. They collectively constructed roughly 210 GW of assembly capacity characterized by thin margins, only to become dependent on a 27 GW domestic cell industry for a legally mandated component. The broader principle: when policy or market shocks hit a multi-step value chain, economic rents accrue to the step that is hardest to replicate — typically defined by high capital intensity, complex process engineering, long commissioning timelines, and scarce technical talent. The corollary for incumbents, however, is that bottlenecks are obvious, attracting the very capital that ultimately erodes those outsized returns.
3. In hardware, technological depreciation outruns accounting depreciation — often by years.
Websol's multi-crystalline lines remained on the balance sheet long after becoming economically obsolete. Standard accounting depreciation schedules span decades, whereas solar technology cycles turn over every five to seven years. For capital-intensive hardware sectors — solar, batteries, semiconductors, and displays — book value is secondary to operational lifespan: how many years of cash flow can a plant generate before a newer architecture renders its output uncompetitive? That window is almost always shorter than accounting schedules assume, requiring managers and investors to accept early asset write-downs while equipment remains physically functional.
4. Captive offtake is how a distressed manufacturer buys its way back to bankability.
Selling a 49% stake in an operating joint venture to a customer committed to purchasing up to half its output addressed the twin hurdles facing a distressed manufacturer: capital access and commercial credibility. The power producer secured domestic supply, while Websol gained a validated customer base and operational cash flows. This joint-venture model is applicable across capital-constrained supply chains. However, the trade-off is structural: the partner retains a permanent claim on joint-venture cash flows, while an off-take agreement framed as "up to 50%" at prevailing market rates mitigates volume risk without protecting against price volatility.
5. Survival has option value, and the market prices it at almost nothing.
The most durable asset Websol maintained through a decade of financial distress was not its machinery. It was a licensed industrial site inside a Special Economic Zone, a trained cell-line workforce, and an operating framework preserved by promoter continuity. When trade policy and capital availability aligned, that foundation enabled the company to restart production far faster than a greenfield project could obtain regulatory approvals. Distressed industrial assets in strategic locations carry embedded option value on regulatory shifts — though realizing that value depends entirely on favorable policy alignment rather than guaranteed operational recovery.
X. Strategic Position, Hamilton's 7 Powers & Skeptical-Investor Stress Test (2:48 – 3:08)
Stripping away narrative to address the structural core reveals a fundamental question: does Websol possess structural advantages that will allow it to earn returns above its cost of capital once competitors fully respond? Hamilton Helmer's 7 Powers framework provides an objective model for evaluating this long-term outlook.
Cornered Resource — weak, with one qualification. Websol holds List-II enlistment under the Approved List of Models and Manufacturers (ALMM), an operating site within the Falta Special Economic Zone, and an established presence in Eastern India that no direct competitor replicates. However, ALMM enlistment is accessible to any manufacturer building a compliant plant, with over 30 GW of capacity already enlisted.18 The sole qualification is timing: process-qualified cell capacity with a trained technical workforce cannot be built overnight. During the 2026–2028 window of policy-enforced domestic sourcing, operating an established facility provides a valuable, albeit temporary, speed advantage rather than a cornered resource.
Scale Economies — weak today, but the primary target of expansion. Operating at 1.2 GW of cell capacity—rising to 1.35 GW—Websol remains a mid-tier producer domestically and a minor player globally, where tier-one Chinese manufacturers command 30 to 80 GW of capacity. Global scale yields equipment discounts, wafer procurement leverage, and research-and-development absorption, capabilities Websol currently lacks. The proposed 4 GW expansion represents an effort to build scale power, confirming that such economies do not yet exist.
Process Power — weak. Cell manufacturing lines are supplied as turnkey solutions by a concentrated group of equipment vendors, meaning underlying process recipes are broadly accessible. Websol's 20% reduction in silver consumption during FY2026 represents operational progress, yet it aligns with efficiency initiatives pursued across the industry.19 Similarly, maintaining cell line utilization above 90% reflects operational consistency rather than proprietary process power.
Counter-Positioning — none. Websol follows a standard capital-intensive manufacturing model operating behind protective tariffs. There is no structural element in its business model that deters established competitors from replicating its strategy.
Switching Costs — low. Solar cells are standardized industrial components evaluated on conversion efficiency, physical format, bankability, and price per watt. Module assemblers routinely qualify multiple cell vendors and purchase based on prevailing spreads. While the AmpIn joint venture offers partial off-take alignment, it represents a contractual arrangement rather than an inherent switching cost.
Network Economies — absent. Additional customer adoption provides no network benefits that enhance product value for other buyers.
Branding — negligible in intermediate goods. Long-term bankability and warranty assurances matter primarily for finished modules over a 25-year lifecycle, where past corporate distress offers no commercial advantage. Cells remain intermediate industrial inputs sold on price and technical specifications.
In summary, Websol currently holds no permanent economic powers, relying instead on a major temporary advantage: qualified, operating capacity operating inside a protected regulatory window. This assessment does not dismiss the business—substantial value can be generated harvesting temporary market deficits—but it indicates that investment thesis performance depends on duration and capital reinvestment rather than permanent moats.
Porter's Five Forces reinforce this structural outlook.
Threat of new entrants: high and rising. Competitors including Reliance, Adani, Tata Power, Premier Energies, Waaree Energies, Vikram Solar, and Goldi Solar are deploying large-scale cell capacity. Entering the market requires capital and execution time rather than regulatory permission, with policy-protected margins serving as the primary incentive.
Supplier power: very high. Domestic producers import virtually all silicon wafers from a concentrated, foreign-controlled supply base that also competes downstream. Silver adds raw material price volatility with no domestic hedging mechanism. The equipment memorandum of understanding with Linton Crystal to explore domestic ingot and wafer production represents the company's only structural response, though it remains at an early stage.17
Buyer power: moderate today, rising. Module assemblers currently face a deficit of ALMM-compliant cells, giving cell manufacturers temporary pricing leverage. The AmpIn off-take agreement further stabilizes output for one line. However, as domestic cell production expands, bargaining power will shift back to buyers, particularly Indian project developers competing in cost-sensitive reverse auctions.
Threat of substitutes: low for solar photovoltaics overall; moderate to high at the cell level. Solar photovoltaics faces no immediate substitute for utility-scale deployment this decade, but competing architectures could rapidly displace TOPCon technology.
Rivalry: intensifying. New domestic cell capacity commissioning between 2026 and 2028 is projected to move the domestic market from deficit toward balance and potentially into oversupply.
The stress test: key analytical vulnerabilities.
A skeptical investment case does not rely on extraordinary events, requiring only that standard industrial economics assert themselves over time.
Margin trajectories present the initial friction point. In the June 2026 quarter (Q1 FY27), Websol reported 70% year-over-year revenue growth alongside 21% EBITDA growth, reflecting a 1,300 basis point margin contraction.4 Management attributed this decline to product mix. If the contraction instead signals narrowing cell spreads from expanding domestic supply, current valuation multiples may rest on peak earnings margins. A cautious perspective notes that a manufacturer lacking proprietary technology or cost leadership is reporting operating margins well above larger global peers—a disparity unlikely to persist indefinitely.
Upstream dependencies present additional operational risks. Wafer price increases pass directly into processing spreads, while long-term supply agreements buffering price swings remain undisclosed. Policy protections are also vulnerable: any reduction in Basic Customs Duty rates or expansion of ALMM exemptions to alleviate developer cost pressures would compress cell margins. On execution, managing a ₹3,000 crore capital program represents a major step-up for a team whose prior manufacturing overhaul involved an extended shutdown and stopgap financing. Furthermore, proposed equity or warrant funding could dilute public shareholders, particularly given a promoter stake below 30%, while the 49% joint-venture partner retains a permanent claim on JV earnings.
Finally, governance history warrants ongoing monitoring. Although promoter share pledges have dropped significantly, the past practice of pledging shares to near-total levels against non-bank corporate loans underscores a high historical tolerance for balance-sheet risk.
The bull case, evaluated at strength.
India's solar deployment continues to expand, with a record 15.3 GW added in the first quarter of 2026 alone, while ALMM List-II regulations enforced from June 1, 2026 mandate domestic cells across government-assisted projects against a national cell capacity base of roughly 27 to 30 GW.20618 Websol enters this regulatory window with operational cell lines running at 92% utilization and an order book of ₹1,278 crore against trailing annual revenue of ₹1,049 crore.43 Cash generation has strengthened the balance sheet, enabling full prepayment of the ₹110 crore IREDA term loan from internal accruals while maintaining a net cash surplus.53 The ₹270 crore TOPCon conversion offers a cost-effective path to upgrade cell efficiency above 25%, aligning output with prevailing global standards.17 Capital efficiency metrics on the current operational base remain elevated.27 Should the government mandate domestic wafers by June 2028, early positioning in ingot and wafer partnerships could offer long-term supply security.13
Weighing the evidence. The bullish perspective focuses on near-term cash generation supported by audited financial results over the next two to three years. The bear case focuses on medium-term structural risks driven by expanding industry capacity, raw material dependencies, and margin normalization. Both dynamics can unfold sequentially: near-term earnings strength followed by long-term margin compression. The central analytical question is how effectively management can convert temporary policy-driven cash flows into durable scale, upstream integration, and technological resilience before domestic supply catches up.
XI. Key KPIs & Epilogue (3:08 – 3:15)
Three metrics carry nearly all the analytical weight in this story. Everything else is commentary.
1. The cell processing spread — realized cell price per watt minus wafer cost per watt. This is the core operating engine. It differs from reported EBITDA margin, which blends cell and module economics and shifts with product mix. Investors should track this metric through cell-segment disclosures and management commentary on realizations and wafer costs, specifically evaluating it against the expansion of ALMM List-II enlisted capacity. If processing spreads hold firm as enlisted capacity expands, it would provide evidence of a company-specific advantage. Conversely, if spreads compress in line with capacity additions, it would confirm that high processing margins represent a temporary policy window being competed away on schedule. The 1,300 basis point margin decline in the June 2026 quarter serves as the first data point in this series; several more quarters are required to establish a definitive trend.
2. Cell capacity utilization, and the TOPCon commissioning date. Utilization above 90% signals that demand exceeds internal supply and operations are executing well; a sustained fall below the mid-80s would indicate softening demand or market share loss as domestic supply expands. The March 2027 TOPCon commissioning deadline offers a direct test of management's execution discipline against a historical record that includes an extended 18-month shutdown. Delivering on schedule would strengthen management's credibility ahead of the much larger 4 GW expansion program, whereas delays would reinforce execution concerns.
3. Promoter share pledges, and the funding mix of the ₹3,000 crore expansion. The promoter share pledge fell from roughly 80% to 16% following the August 2026 loan prepayment; the central question is whether it remains low throughout the upcoming expansion cycle.5 Alongside pledge levels, the financing structure of the expansion requires monitoring: funding via internal accruals would confirm the capital discipline suggested by the IREDA prepayment, whereas heavy debt or equity issuance from a promoter base below 30% would reintroduce equity dilution and balance-sheet risk.
Three and a half decades after a small Kolkata promoter partnered with a West Bengal state corporation to manufacture solar cells for a market that barely existed, the factory at Falta is running at 92% utilization, generating over ₹1,000 crore in annual revenue, holding a net cash surplus, and preparing to replace a production line built three years ago because a superior cell architecture arrived.
That sequence encapsulates the corporate journey. Websol's recovery was not a triumph of proprietary technology or an unassailable economic moat. It was the product of a shifting regulatory regime, a joint-venture partner that absorbed operational risk, and a management team willing to decommission legacy assets rather than run them into obsolescence a second time. Those factors generated two extraordinary financial years. Whether they yield a durable enterprise depends on unresolved factors: whether cell processing spreads withstand more than 30 GW of enlisted domestic capacity, whether ₹3,000 crore in capital expenditures is deployed with greater discipline than the company's historical record indicates, and whether a manufacturer caught twice by technological shifts can anticipate the next industry cycle before it arrives.
The available evidence supports operational confidence over the next several quarters alongside structural uncertainty across the next several years. In an industry that has bankrupted far more companies than it has enriched, that distinction is not a criticism. It defines the core risk profile of the business.
References
-
Websol Energy System Ltd: Fundamental Analysis — Dr Vijay Malik ↩↩↩
-
Websol posts INR 154.70 crore profit in FY 2025 — pv magazine India, 2025-05-16 ↩↩↩↩↩
-
Websol Energy Reports Strong Q4FY26 Results with 132 percent Revenue Growth — Saur Energy International ↩↩↩↩↩↩↩↩
-
Websol Energy's Q1 FY27 Revenue Soars 70% to Rs 373 Cr; Debt Reduced — Whalesbook ↩↩↩↩↩↩
-
Websol Energy Q1FY27 Revenue up 70% YoY at Rs 373 crore; Company Prepays Entire IREDA Term Loan — Saur Energy International ↩↩↩↩↩
-
India's cumulative solar module capacity reaches 210GW, cell capacity hits 27GW — Mercom via PV Tech ↩↩↩
-
ALMM/RLMM Compliance: A Regulatory Deep Dive — AZB & Partners ↩↩
-
Websol Energy — Solar Cells & Modules Manufacturer in India — Websol Energy System Limited ↩
-
Amp Energy India, Websol Energy Systems create JV for 1.2GW of solar cell and module capacity — PV Tech, 2022 ↩
-
Websol Energy System up 20% on RBI nod for restructuring of FCCBs — Business Standard, 2016-09-23 ↩
-
Websol Energy System Q3 results: Net loss at Rs 54 cr on asset impairment — Business Standard, 2024-01-25 ↩
-
India Brings ALMM List-II For Solar Cells Into Force — TaiyangNews, 2026 ↩↩
-
India adds 119 GW of solar module, 9 GW of cell manufacturing capacity in 2025 — pv magazine India, 2026-03-18 ↩↩↩↩↩
-
Amp Energy India to Form JV with Websol Energy to Make 1.2 GW of Solar Cells and Modules — Energetica India, 2022 ↩
-
Amp Energy India Forays Into Manufacturing Of Solar Cells And Modules — SolarQuarter, 2022-09-09 ↩
-
Websol Energy sizzles on turnaround Q4 numbers — Business Standard, 2025-05-16 ↩
-
Websol to upgrade 600MW PERC cell line to TOPCon, lifting total cell capacity to 1.35GW — PV Tech ↩↩↩↩↩↩↩
-
Solar Cell Capacity Under ALMM List-II Nears 30 GW — Mercom India ↩↩↩
-
Websol expands TOPCon module capacity, further reduces silver use — pv magazine, 2026-08-21 ↩↩↩
-
India added record 15.3 GW solar capacity in Q1 2026: Mercom — pv magazine India, 2026-05-14 ↩↩
-
India's ALMM List-II Solar Rules Expose Domestic Cell Shortage, Threaten Standalone Module Makers — Down To Earth ↩
-
Websol Energy System approves capacity expansion with investment of Rs 3,000 cr — Business Standard, 2025-09-02 ↩↩↩
-
Websol to expand solar cell, module capacity by 4 GW — pv magazine India, 2025-09-03 ↩
-
Websol Drops Andhra Pradesh for Its Proposed Cell & Module Plant, Bets On Bengal — Saur Energy International ↩↩↩↩
-
Can Expansion & 'Beyond Bengal' Move Spur New Growth For Websol? — Saur Energy International ↩
-
Websol Energy System Limited — Corporate announcements and investor information ↩
 LinkedIn
 WhatsApp
 Reddit
 Hacker News
 Email
Email Kindle
 RSS Feed
 Spotify
 Apple Podcasts
 Amazon Music
 Audible
 YouTube