V.S.T. Tillers Tractors: The Story of the Company That Owns India's Small Farm
I. Introduction & Episode Roadmap (5 min)
Picture a paddy plot somewhere in the Godavari delta or the Konkan coast. It is an acre, maybe less, cut into terraces by low mud bunds. A tractor would sink here, or fail to turn, or cost more than the plot earns in a decade. A farmer walks behind a machine instead. It looks like a cross between a lawnmower and a small motorbike with its seat torn off: a single-cylinder diesel engine, two handlebars, and a set of rotating blades churning the wet soil into the slurry that rice seedlings need. The farmer steers it the way you would steer a wheelbarrow, and the engine does the work that a pair of bullocks once did.
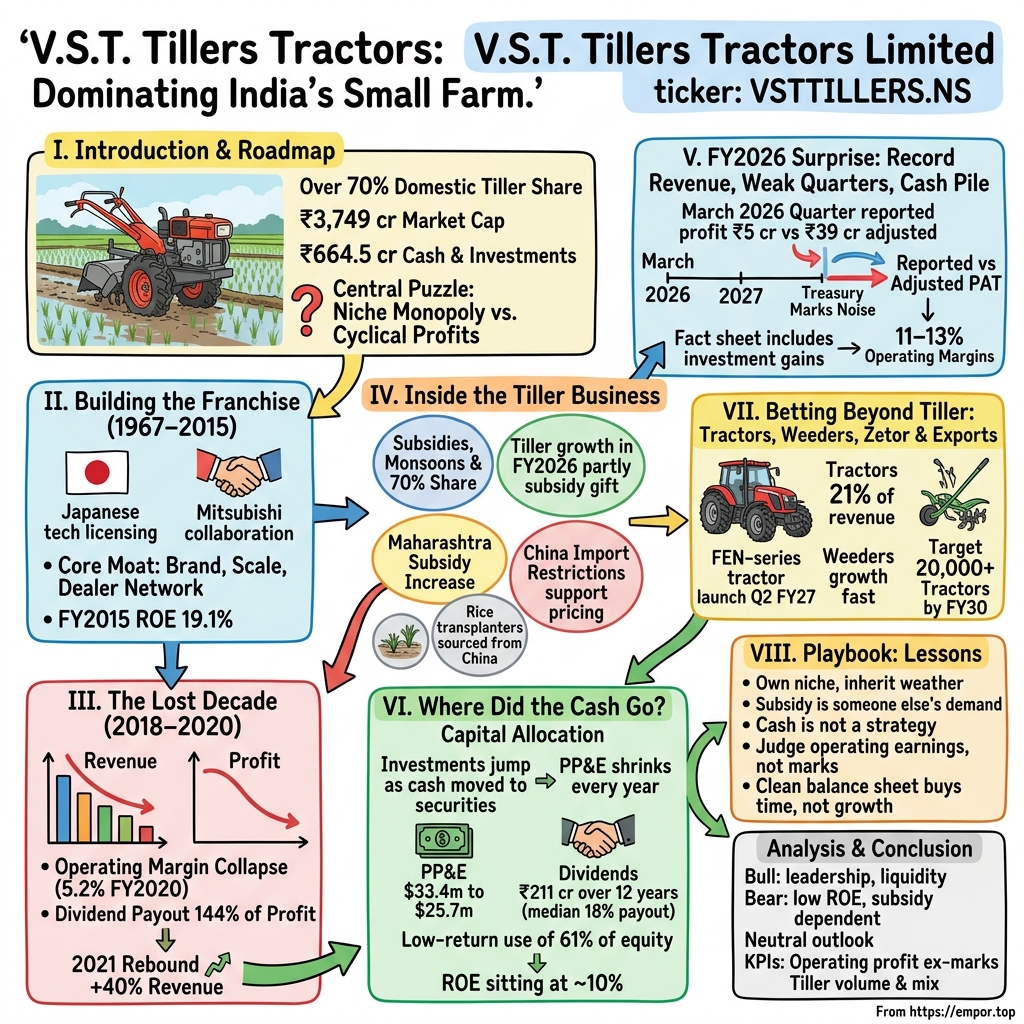
That machine is a power tiller. In India, one company makes most of them. V.S.T. Tillers Tractors, based in Bengaluru, holds more than 70% of the domestic power-tiller market1. In the year to March 2026, it sold more than 50,000 of them for the first time in its history1. Almost nobody outside rural India, and very few people on Dalal Street, has ever stood behind one.
On 5 October 2026 the stock market valued the company at about ₹3,749 crore2. Inside that number sits something unusual for an Indian manufacturer: ₹664.5 crore of cash and liquid investments, with no debt at all1. Roughly one rupee in every five and a half that an investor pays for VST buys a slice of a treasury portfolio rather than a factory.
So here is the puzzle. A company that owns its niche outright, has never needed a bank, and has a cash cushion most mid-caps would envy should be a compounding machine. Yet over the decade to FY2026, VST's net profit grew by only about 3–4% a year2. The share price says "compounder". The earnings record says "cyclical". This story tries to work out which one is telling the truth.
Four questions will run through everything that follows, and each is treated as a clue to be followed rather than a box to be ticked.
First, is the record year that ended in March 2026 a new base, or simply a year when the monsoon was kind and a state government raised its subsidy? Second, how much of the profit that VST reports actually comes from selling farm machines, and how much comes from the movement of its investment portfolio? Third, can a business earning roughly 10% on its equity justify a price of about 34 times earnings and three times book value? And fourth, will the newer bets (tractors, power weeders, exports) ever loosen the grip that subsidised tillers and the monsoon have on the company's fortunes?
The company is promoter-controlled: the Indian founding family and Mitsubishi together hold 55.55%1. About 90% of revenue is domestic1. It has been listed for decades and has not, on the record of the past dozen years, needed outside capital. That combination of stability and stagnation is the heart of the story.
To understand why a company can dominate a market and still struggle to grow, you have to start with where the dominance came from: a Japanese licence, signed when Indian agriculture was only beginning to mechanise.
 Subscribe on LinkedIn
II. Mitsubishi, Tillers & Tractors: How a Niche Became a Monopoly-Like Franchise (1967–2015) (10 min)
In the late 1960s, India's Green Revolution was transforming wheat in Punjab and Haryana, and the tractor was becoming its symbol. But most Indian farms were not Punjabi wheat fields. They were tiny, fragmented holdings in the rice-growing south and east, often waterlogged, often terraced, often reached by footpath. A 35-horsepower tractor was the wrong tool for them.
The VST group, a Bengaluru family business with roots in automobile dealing, saw that gap. It signed technical collaborations with Mitsubishi for walk-behind power tillers in 1967 and 1970, and later for tractors in 19841. Japan was the natural teacher. Its own rice agriculture had been mechanised on plots just as small, and Japanese manufacturers had spent decades refining the walk-behind tiller for exactly this terrain.
Why does the tiller fit India so well? Think of it as the two-wheeler of farm machinery. A tractor is a car: powerful, expensive, and in need of space. A tiller is a scooter: cheaper, narrower, easier to repair, and able to go where the bigger machine cannot. For a smallholder with one or two acres of paddy, it replaces animal draught without forcing the farmer to rent or buy a machine built for a farm ten times the size.
Over the following decades VST turned that fit into a franchise. It built a dealer network that today runs to more than 1,000 outlets1, put its name on machines across the rice belt, and accumulated the spares business that keeps those machines running. Mitsubishi's collaborations have since expired1, and the Japanese group now holds a small 2.93% stake as part of the promoter group1.
That expiry matters more than it first appears. Whatever technical moat came from an exclusive Mitsubishi licence is gone. What remains is a brand that farmers and dealers know, a distribution network that a newcomer would take years to replicate, manufacturing scale in a niche product, and long familiarity with the state subsidy schemes through which most tillers are bought. These are real advantages. They are also softer ones than an exclusive technology, and Section IV will test them properly.
By the middle of the last decade, the franchise was producing excellent returns. In FY2015 the company earned about 19% on its shareholders' equity, with an operating margin of about 18%23. Few Indian industrial companies of its size were doing better.
The peak came in FY2018. Net profit reached about $17.3 million, roughly ₹110 crore at the exchange rates of the time, and return on equity was close to 19%2. It was the best year in the company's modern history.
It is worth fixing that number in mind, because it is the high-water mark. In rupee terms, reported profit in FY2026, eight years later, was ₹106 crore1. In dollar terms it was about a third lower. A franchise that had looked like it was compounding at 15–20% a year had, in effect, run in place for the better part of a decade.
What happened next was not a slow fade. It was a sudden fall, and the way the company handled it says a lot about the people who run it.
III. The Lost Decade: 2018–2020 and the Margin Collapse (8 min)
Fast-forward to the spring of 2020. The country is going into lockdown. VST has just closed a year in which its operating margin, the share of each rupee of sales left after running the business, has fallen to about 5%2. Two years earlier it had been close to 15%. Net profit for the year is about $2.5 million, perhaps ₹18 crore, a sliver of the FY2018 peak2.
And then the board does something that tells you a great deal about this company. It pays out dividends worth about 144% of that year's profit2. It paid more than it earned.
How did the company get there? The mechanics are simple and brutal. Revenue fell by about a fifth in FY2019 and by another tenth in FY20202. Net profit fell by roughly 60% in each of those two years2. A rural slowdown, uneven monsoons and the stop-start timing of state subsidy payments hit demand at the same moment. Dealers stopped ordering. Machines piled up: by FY2019, VST was holding about 110 days' worth of inventory, almost double the 57 days of the year before2.
For a manufacturer, that is the worst combination. Factories have fixed costs whether they build 30,000 tillers or 50,000, so when volumes drop, margins drop faster. The tiller business turned out to have a lot of operating leverage, and leverage works in both directions.
The company had no debt throughout2. Nobody was going to foreclose on VST, and it never had to raise money. That is a real strength, and it is why the "financial strength" part of the bull case survives this episode intact.
The "steady compounder" part does not survive. Revenue has fallen in three of the last eight years: FY2019, FY2020 and FY20242. That is the strongest evidence in the company's own record against the idea that its market leadership translates into smooth earnings. Leadership tells you who wins the share of the market. It tells you nothing about how big the market will be this year.
Now back to that 144% payout. A generous reading is that the board was signalling confidence: the balance sheet was strong enough to keep paying while profits recovered. A harsher reading is that dividends at VST are not tightly linked to anything. Over twelve years the payout has ranged from zero (FY2017 and FY2021) to 144%, with a median of about 18%2. When a company pays nothing in a decent year and more than everything in a terrible one, it is hard to infer a policy. Section VI returns to this.
FY2021 brought the bounce. Revenue rose about 40%2 as rural India, relatively insulated from the pandemic and helped by a good monsoon, spent money. Profit multiplied several times from the depressed base. For a moment it looked like the old VST was back.
One good year is not a trend, though, and the next five showed that. Profit drifted, revenue fell again in FY2024, and return on equity never returned to the high teens. To understand why, you have to look closely at the product that still makes up most of the company: the tiller, and the government money that pays for it.
IV. Inside the Tiller Business: Subsidies, Monsoons & 70% Share (14 min)
Two scenes, two years apart.
In the spring of 2024, India is heading into a general election. Across several states, subsidy payments for farm machinery slow or stop as the election code of conduct takes hold and new spending is put on hold. Tiller buyers who were waiting for their subsidy wait longer. VST's revenue falls about 4% that year1.
In FY2026, the government of Maharashtra raises its subsidy for power tillers. Demand jumps. VST's tiller volumes rise about 35% for the year, and it sells more than 50,000 tillers for the first time1.
Same company, same product, same dealers. The difference between a bad year and a record one was largely a decision made in a state secretariat.
The product and the money
Tillers made up about 60% of VST's revenue in FY2026, and tractors about 21%1. The remainder came from power weeders, brush cutters, electric pumps, engines, components and spares1. So when you ask what VST is, the honest answer is still: a power-tiller company with a tractor business attached.
The economics are those of a unit seller. VST builds a machine, ships it to one of its 1,000-plus dealers, and is paid per unit1. There are no contracts, no subscriptions and no minimum commitments. The only recurring revenue is spare parts: tines, belts, filters and the other components that a machine working in wet mud wears out. That spares stream is valuable because the installed base is large and VST is the natural supplier for its own machines, but it is not large enough to smooth out the swings in new-machine sales.
On the cost side, VST is a metal-bender. Steel, castings, forgings, aluminium, copper and rubber are its main inputs1. When commodity prices rise, the company has to decide whether to pass the increase to farmers, who are price-sensitive and often waiting on a subsidy fixed in rupees, or absorb it. In the June 2026 quarter, raw-material inflation trimmed its operating margin by about 45 basis points to 12.85%5. That is a small move, but it shows the direction of the pressure.
The government as the real buyer
Here is the uncomfortable centre of the tiller story. ICRA, the credit rating agency, puts it plainly: power-tiller sales are driven largely by state government subsidies1. A farmer may sign the purchase, but a state scheme often pays a large part of the price, and the scheme's budget, timing and rules set the size of the market in any given year.
That makes the government the most important customer VST has, even though it never appears on an invoice. And a dominant buyer has bargaining power. States decide which models qualify, what the subsidy is worth, and when the money flows. A state could, in principle, widen its list of approved vendors, tighten specifications, cap the subsidised price, or simply let the budget run dry. VST does not disclose how its sales split by state or scheme, so investors cannot see how exposed it is to any single government's choices. What the record does show is the size of the swings: an election year cut volumes, and a single state's subsidy increase helped deliver a record.
A second policy lever helps VST rather than hurts it. India restricts imports from China, and ICRA notes that this supports VST's pricing1. Chinese manufacturers make tillers at enormous scale, and in an open market they would be a natural low-cost competitor. That protection is valuable, but it is also another policy dependency. A trade decision in Delhi could change it.
There is a small irony on the other side of the ledger. VST itself sources rice transplanters from China and sells them as a trading line1. It is a sensible way to offer dealers a fuller range for paddy farmers, but it is a reminder that the company is not purely a manufacturer.
A newer, slower lever: retail finance
One development points the other way. Finance-backed tiller sales rose to about 10–12% of the total in FY2026, from 6–7% before1. Every farmer who buys on a loan from a bank or finance company rather than waiting on a subsidy is a sale that depends a little less on the state. It is still a small slice, but if it keeps rising it is the most direct way for VST to own more of its own demand.
Is the 70% share a moat?
The share is real and independently confirmed1. The question is what it protects.
Take the strengths first. Scale matters in a niche product: VST can spread tooling, engineering and dealer support across far more units than any rival, and that makes its cost per tiller lower. Brand matters in rural India, where a farmer buying a machine that will run for a decade relies on what his neighbours and his dealer trust. The dealer network is hard to copy; building 1,000 outlets across the rice belt, each with a mechanic who knows the machine, takes years.
Now the weaknesses. Switching costs for a farmer are low: a tiller from another maker does the same job, and the subsidy often applies to any approved model. The buyer that matters most, the state, is price-conscious and can change the rules. The original technology edge expired with the Mitsubishi licence. And the import restrictions that keep Chinese competition out are a gift of policy, not something VST built.
The verdict from the company's own record: the moat protects VST's share of the tiller market, and there is no evidence that share has been eroded. It does not protect the size of the market, and it has not delivered pricing power. If it had, margins would not have collapsed in FY2020 and the input-cost squeeze in the latest quarter would have been passed on. The claim of a moat is narrowed, not rejected: VST has a moat around its share, not around its profits.
The test of FY2026 is simple to state. Tiller volume growth of 35% in a year cannot be extrapolated. If tiller sales hold up in the second half of FY2027 without any further subsidy increases, the step-up is partly durable. If they fall back, FY2026 was a subsidy year.
That test is still months away. In the meantime, the FY2026 results themselves contain a second puzzle, one that has nothing to do with farmers at all.
V. The FY2026 Surprise: Record Revenue, Weak Quarters, and the Cash Pile (12 min)
In May 2026, VST reported the best year in its history. Revenue was ₹1,240 crore, up about 25%41. Tiller volumes were at a record. And yet the profit for the March 2026 quarter, the last quarter of that record year, was about ₹5 crore4. Not ₹50 crore. Five.
Something other than tillers was moving the numbers. On an adjusted basis, stripping out the effect of the investment portfolio, the quarter's profit was about ₹39 crore4. The gap between those two numbers was the treasury.
Where the noise comes from
Recall the ₹664.5 crore of cash and liquid investments1. A large part of it sits in financial instruments that are marked to market every quarter, which means that any rise or fall in their value runs straight through the profit and loss account, whether or not anything is sold.
When markets fall, VST reports a loss on those holdings; when they rise, a gain. Quarterly other income swung from roughly minus ₹31 crore in the March 2026 quarter to roughly plus ₹28 crore in the June 2026 quarter2. For a company whose quarterly operating profit from farm machines is in the range of ₹35–45 crore, those swings are as large as the business itself.
For the full year, the distortion was smaller but still real: reported profit was ₹106 crore against an adjusted ₹113 crore4. The adjusted figure rose by about 61%4. That is the number that tells you how the farm-equipment business actually did, and it did well.
Why the headline margins mislead
This has a direct consequence for how anyone reads VST's history. Standard financial databases appear to include investment gains in their measure of operating profit. That is why the data shows an operating margin of about 20% in FY2025 and 22.5% in the March 2025 quarter, but just 1.6% in the December 2023 quarter2. Those are not swings in the profitability of tiller-making. They are swings in the stock and bond markets.
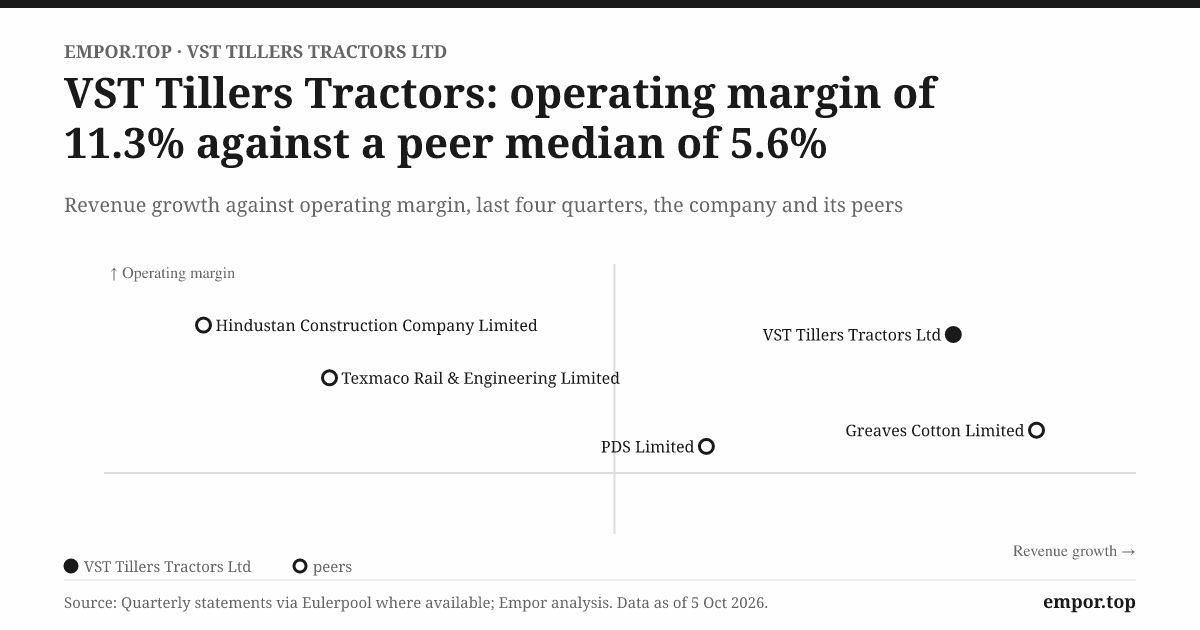
ICRA, which calculates margins from operations alone, tells a calmer story: an operating margin of about 11.4% in FY2025 and 13.4% in FY20261. Those are the clean numbers. On that basis, FY2026 was a genuine improvement of about two percentage points. The 20% margin of FY2025 was never real.
A related trap is lurking in press coverage. In the June 2026 quarter, standalone fair-value gains on investments were about ₹26 crore, up from about ₹24 crore a year earlier5. One widely circulated summary printed these as ₹261.5 crore and ₹237.9 crore5, a decimal-point slip that would make the treasury gain five times the quarter's entire profit. It was not. Profit for that quarter was about ₹49 crore5.
The latest quarter
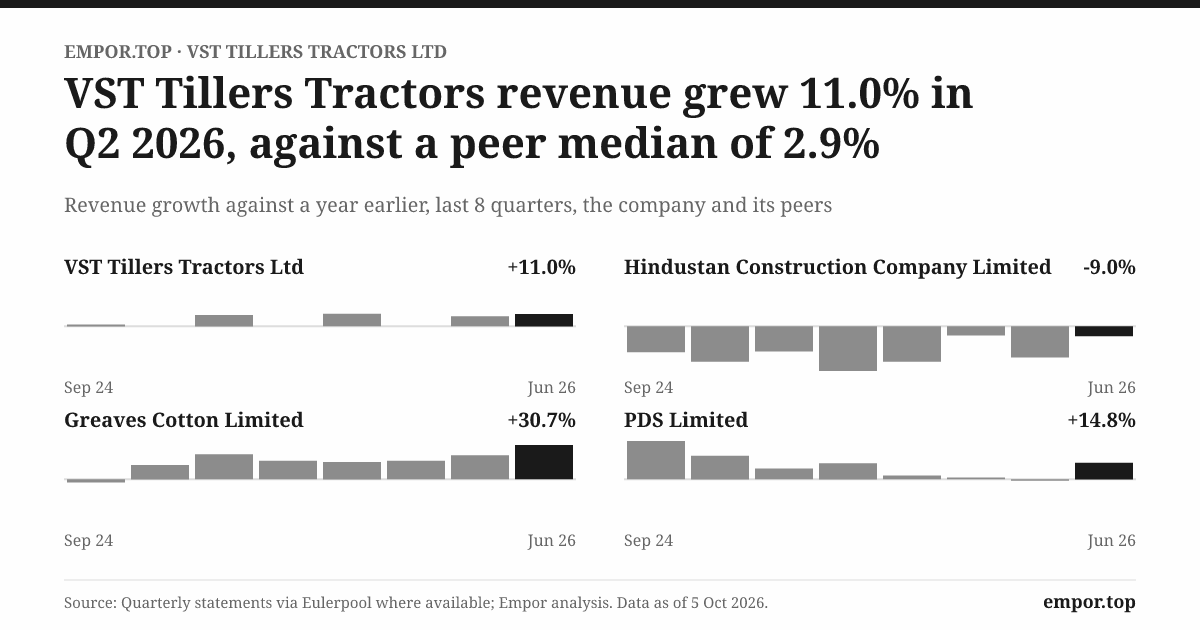
The June 2026 quarter, the first of FY2027, looked like a normalisation rather than a continuation. Revenue rose about 11% and profit about 9%5. Tiller volumes grew about 18%, weeders about 56%, and total unit sales about 22.5%5. Input costs pinched the operating margin, as noted earlier. Against a weak June 2025 base, those are respectable numbers. They are also much closer to the company's ten-year revenue growth rate of about 7% a year2 than to FY2026's 25%.
Does profit turn into cash?
One reassuring finding sits under all this noise. Over the twelve years from FY2015 to FY2026, VST reported about ₹992 crore of net profit and generated about ₹920 crore of cash from operations, or about 93%2. Over the long run, this is a company whose profits are real money.
Year by year, though, the conversion swings wildly: from about 20% of EBITDA in FY2018 to about 184% in FY20202. In FY2026 operating cash flow was about ₹132 crore, up from about ₹76 crore4. Two things drive those swings. Working capital moves with subsidy payments and inventory builds. And because reported EBITDA includes unrealised investment gains, which are not cash, conversion looks poor when markets rise and excellent when they fall. Judge it over several years, never one.
Who owes VST money?
Receivables tell the same story of timing rather than stress. Debtor days, the average time customers take to pay, peaked at about 92 in FY2018, dropped to about 29 in FY2022, rose to about 76 in FY2025 and fell back to about 51 in FY20262. Those moves most plausibly track when state subsidy money arrives. The allowance for credit losses was about ₹8.4 crore at FY20246, small against the receivables base. There is no sign of a bad-debt problem. The item to watch is subsidy-linked receivables, because a state that delays payment turns VST's dealers into lenders to the government, and eventually VST too.
The conclusion on the second question is clear. In any single quarter, the investment portfolio can account for most of the movement in reported profit. Over a full year it matters less, and the underlying farm-equipment business earns a margin of about 11–13%. Investors who value VST on reported earnings are partly valuing a fund manager.
Which raises the obvious next question. How did a tiller company end up running a ₹660 crore portfolio in the first place?
VI. Where Did the Cash Go? Capital Allocation Under the Promoter Family (12 min)
Look at VST's balance sheet at the end of FY2023, and then a year later, and something dramatic happens on one line. Investments jump from about $11 million to about $58 million in a single year2. The company had decided to move a large part of its cash out of bank deposits and into securities. Meanwhile, the line for property, plant and equipment, the factories and machines that actually make tillers, has been shrinking every year since FY2022, from about $33 million to about $26 million2.
Fewer factories, more securities. That is the shape of capital allocation at VST.
The money trail
Over the twelve years to FY2026, VST generated about ₹569 crore of free cash flow, the cash left after running the business and paying for capital spending2. It paid about ₹211 crore of that out as dividends, or about 37%2. Most of the rest stayed inside the company. Cash and short-term investments rose from about ₹125 crore to about ₹664 crore over the same period2.
Capital spending has been light, about 2% of revenue in FY20262. There have been no acquisitions of any scale. There has been no equity raise, no buyback and no debt21. The one joint venture, VST Zetor, a tie-up with the Czech tractor maker, is too small to judge as a deployment of capital; it lost about ₹30 lakh in the June 2026 quarter5.
The best description of this pattern is a harvester. Management runs the existing franchise for cash, spends little to maintain it, pays a modest dividend, and parks the surplus.
Safe, but at what cost?
The upside is safety. A company with no debt and a cash pile equal to about 61% of its equity1 cannot be pushed into a distressed sale, cannot be forced to dilute shareholders, and can ride out a terrible monsoon. ICRA rates its credit AA- and its liquidity "strong"1.
The downside is arithmetic. If 61% of your equity earns a treasury return of perhaps 7–8% before tax, it drags down the return on the whole. That is the single biggest reason return on equity has fallen from about 19% in FY2015 to about 10% today2. The operating business, measured on the capital it actually uses, still earns well; return on invested capital, which nets out the cash, was about 25% over the twelve months to June 20262. Shareholders, though, own the cash as well as the factories, and the cash is not earning factory-level returns.
The people
The company is run by a mix of family and professionals. V.T. Ravindra is Managing Director, Antony Cherukara is CEO, and Nitin Agrawal became CFO in May 2023 after his predecessor resigned that April6. Arun V Surendra took over as Chairman in February 2024 when V K Surendra, the largest individual promoter holder, stepped down from the role; the Vice Chairman, V P Mahendra, had died in May 20236. That is a lot of change at the top in a short span, though it reads as generational succession inside a family business rather than upheaval.
Promoter ownership has been remarkably steady at 54–56% since 20172. The family is not selling, and it is not buying.
What would a skeptical shareholder ask?
Imagine an activist investor walking into the boardroom. The questions would be blunt.
Why hold ₹664 crore of cash when the business spends a few percent of revenue on capex? Either there is a plan to deploy it, in which case what is it, or there is not, in which case why not return a larger share to shareholders?
Why pay 144% of profit in FY2020 and nothing at all in FY2017 and FY2021? What is the dividend policy?
The company does have an answer to the first question, at least in part. ICRA expects capex of about ₹100 crore in FY2027 and ₹50–60 crore a year after that, all from internal cash1. That is a genuine step up from the recent run-rate. But even at that pace, it would take years to deploy a meaningful fraction of the surplus.
Promises versus results
On credibility, the evidence is mixed in an instructive way. On capital discipline, management's behaviour has been consistent for a decade: no debt, no dilution, no splashy deals. On growth, the record is of stated aims rather than delivered results. The first Zetor-series tractor launched in 20221. A new FEN tractor series was scheduled for the second quarter of FY20271. Management has talked of selling 20,000-plus tractors by FY20301. None of these has yet changed the shape of the group's revenue.
Smaller items, kept in proportion
VST does business with a ring of promoter-linked companies, including VST & Sons, VST Motors, Bangalore Motors and Mitsubishi Heavy Industries-VST Diesel Engines, covering rent, job work, engines and services6. In FY2024 the listed items added up to perhaps 1–2% of revenue, and the largest was a ₹12.2 crore transfer of product development6. The directors stated that there were no material related-party transactions and none outside arm's length6. This is worth watching, not worth headlining.
One legal item is larger. In FY2024 VST disclosed a GST demand of about ₹110 crore covering FY2018 to FY2020, including about ₹25 crore of interest and about ₹43 crore of penalty, relating to mismatches between returns and input-credit claims6. The company appealed and said it was confident of its position6. Against ₹664 crore of cash it would not threaten the company even in the worst case, but it is about a year's profit, and its resolution matters.
A harvester can only harvest what is planted. The next question is whether VST is planting anything that will grow.
VII. Betting Beyond the Tiller: Tractors, Weeders, Zetor & Exports (10 min)
In 2022, VST launched its first tractor developed with Zetor, a Czech brand with nearly a century of history in European farming1. The idea was to take VST beyond the small, low-horsepower tractors it had long built and into the bigger machines where most of India's tractor money is spent. Four years later, in the June 2026 quarter, VST exported 275 tractors5, and its tractor business as a whole was still about a fifth of revenue1.
That gap between ambition and scale is the theme of this section.
The portfolio
VST's product range today runs from power tillers and tractors to power weeders, brush cutters, electric pumps, engines and spares1. Of these, three lines carry the diversification hopes: tractors, weeders and exports.
Weeders are the cleanest story. A power weeder is a smaller cousin of the tiller, used to cut weeds between crop rows, and it sells partly in horticulture and plantation crops where subsidy exposure is lower. Weeder volumes rose about 52% in FY2026 and about 56% in the June 2026 quarter15. The base is small, so the effect on group revenue is still limited, but this is the one new line where growth is visible in the numbers rather than in press releases.
Tractors are the bigger prize and the harder fight. Domestic tractor volumes rose about 18% in FY2026, but exports fell, bringing total tractor growth to about 12%1. In the June 2026 quarter, domestic tractor volumes rose only about 4.5%5. Management's targets are ambitious: more than 20,000 tractors by FY2030 and more than 30 new variants over three years, with a push into Europe and Africa1. Those are aims, and the FEN series, scheduled for the second quarter of FY20271, is the next test.
Exports remain weak. ICRA describes incremental revenue from the new products as "a monitorable"1, rating-agency language for "we will believe it when we see it".
The tension: no 70% share here
In tillers, VST is the incumbent with the dealer network, the brand and the scale. In tractors, it is a small player in a market dominated by giants like Mahindra & Mahindra and Escorts Kubota, which have far larger dealer networks, much bigger engineering budgets and established finance arms. The advantages that protect VST's tiller share do not transfer automatically. A farmer buying a 45-horsepower tractor is not choosing between VST and a cheaper Chinese import; he is choosing between VST and the brand his father and his neighbours have owned for thirty years.
That is the strategic bind. Diversification means leaving the niche where VST is the leader and entering markets where it is a challenger.
Technical launches are not revenue
The historical test of optionality is simple: how quickly has VST turned new products into revenue before? The answer from the Zetor experience is: slowly. Four years after the first model, tractors are still about 21% of revenue1, and the joint venture is still small enough to post losses measured in lakhs5. The claim that new products will reduce VST's dependence on tillers is not rejected by this record, but it is unproven.
One regulatory risk is lower than it might appear. India has been tightening emission norms for higher-horsepower tractors. ICRA rates this risk as low for VST because most of its revenue comes from tillers and low-horsepower tractors1. The flip side is that the push into bigger tractors will bring VST more firmly into the scope of those rules.
The falsifier is the revenue mix. In FY2026, tillers were 60% and tractors 21%1. If the share of revenue from tractors, weeders and exports rises meaningfully in FY2027, the diversification story gains evidence. If tillers still dominate, it remains a plan.
With that, the story has everything it needs to draw its lessons.
VIII. Playbook: Business & Investing Lessons (6 min)
Own the niche, and you inherit its weather. VST controls more than 70% of India's power-tiller market, and that control has never protected it from the monsoon. Revenue fell in FY2019, FY2020 and FY2024. Market share is a measure of who wins the game; it says nothing about how many games are played. For founders, a dominant share of a small, volatile market can be a trap that feels like a fortress. For investors, the question is never only "who leads?" but "what decides the size of the thing they lead?"
A subsidy is someone else's demand. In FY2026 a decision in Maharashtra lifted VST to a record. In FY2024 an election pause cut it back. When the government pays a large share of the price, the government is the customer, and it has never signed a contract with VST. A business built on subsidised demand is renting its growth from a budget it does not control.
Cash is not a strategy. VST turned a decade of free cash into ₹664 crore of securities. It is the safest balance sheet in its industry, and it is the main reason its return on equity halved from 19% to 10%. Hoarding protects the downside and quietly taxes the upside. At some point, unspent cash needs a reason to stay.
Judge the machine, not the marks. VST's 20% operating margin in FY2025 was a stock-market reading, not a tiller reading, and its ₹5 crore March 2026 quarter was the same illusion in reverse. When a company's treasury is large enough to swing its quarterly profit, reported earnings stop describing the business. Find the operating number and read that.
A clean balance sheet buys time, not growth. VST survived its worst years without a rupee of debt. That time was valuable, but time is only worth what you do with it. Four years after its Zetor tractor launched, the company's revenue still leans on the same machine it was selling in 1970.
IX. Analysis & Bear vs. Bull Case (13 min)
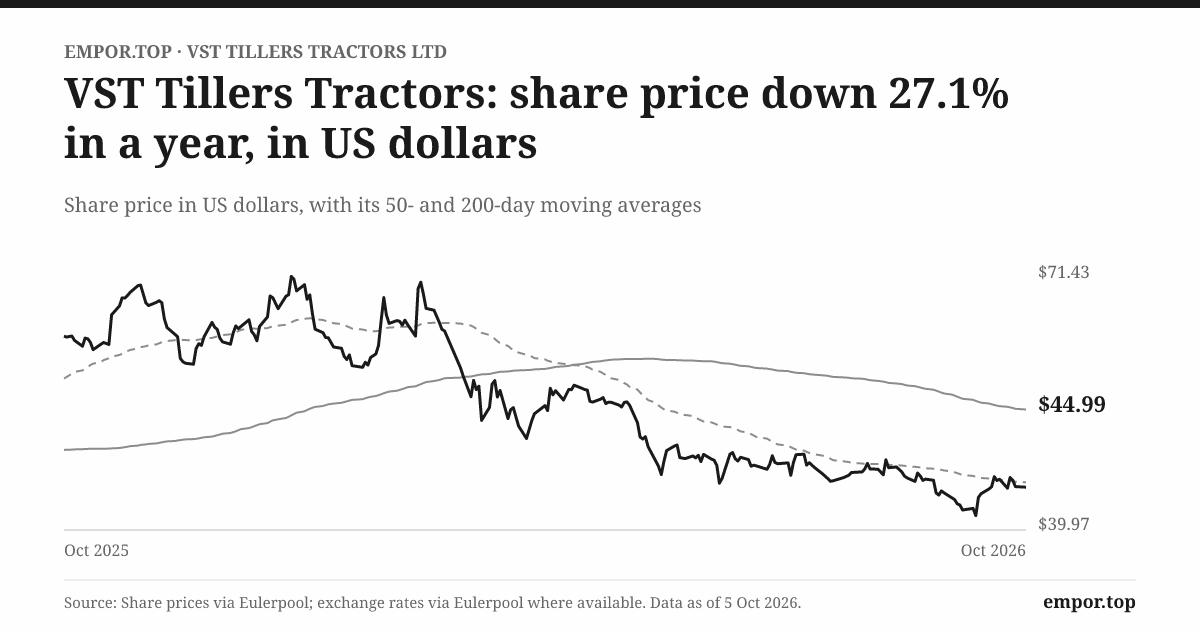
On 5 October 2026, VST's shares closed at about ₹4,332, roughly 31% below their 52-week high of ₹6,2702. Over the preceding eighteen months foreign institutional investors had steadily left: their stake fell from about 6% at its peak to about 1.2% by June 2026, and from about 2.5% as recently as March 20252. Domestic institutions had taken their place, rising to about 20%2. The market was in the middle of an argument about what this company is worth.
What the price assumes
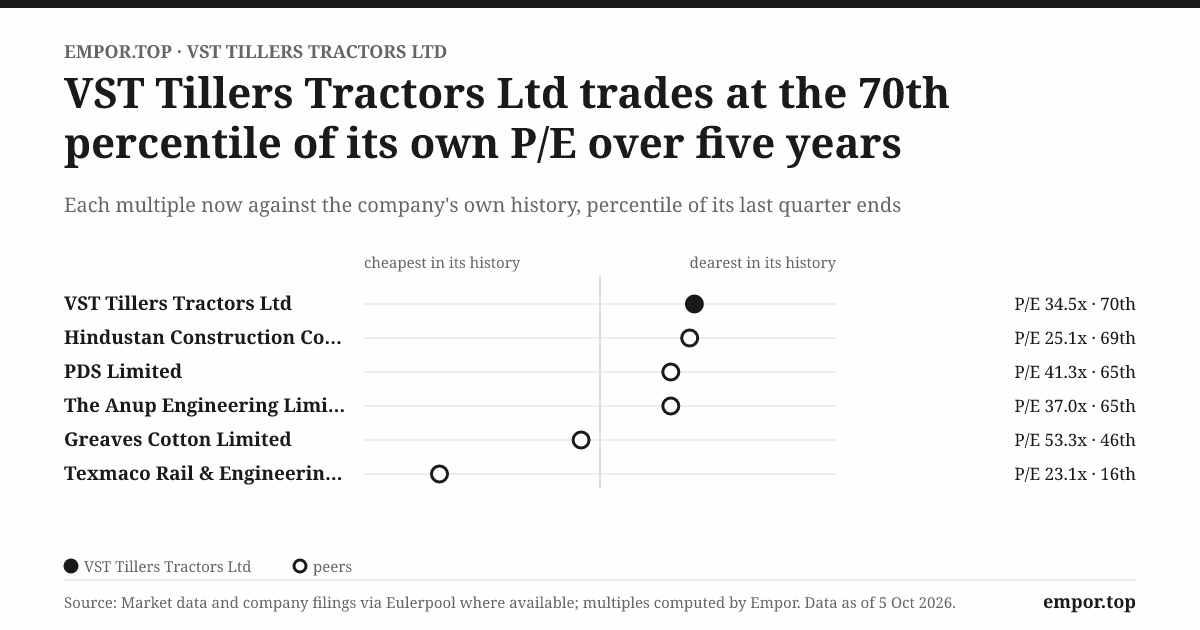
At that price, VST trades at about 34.5 times its last twelve months of earnings, above its own five-year median of about 30 times2. It trades at about 3.3 times book value and about 21 times EV/EBITDA2. Its free-cash-flow yield is about 1.3%2. Its PEG ratio, which divides the P/E by the growth rate, is about 82; a figure near 1 is usually read as fair for a growing company, so this one says the multiple is far ahead of the recent growth record.
Does the cash change the picture? Partly. Strip out the net cash and the enterprise value falls to about ₹3,085 crore2, and the operating business is valued at about 21 times its operating profit2. That is cheaper than the headline P/E, but still demanding for a business whose net profit has grown about 3% a year over five years2. Put simply: even after giving full credit for the cash, the market is paying for growth the company has not yet delivered for any sustained period.
For context, the large listed tractor makers such as Mahindra & Mahindra and Escorts Kubota trade on different multiples reflecting different scale and mix; the relevant point is that VST's premium rests on a niche franchise plus cash, not on a growth record comparable to theirs.
The moat, argued once in full
Through Michael Porter's five forces lens:
- Rivalry within tillers is limited. VST's share is above 70%1 and has not visibly eroded. In tractors, rivalry is intense and VST is small.
- Threat of new entrants is moderated by the dealer network and, critically, by restrictions on Chinese imports1. That second barrier is policy, not structure.
- Buyer power is high. The effective buyer is a state government setting subsidy rules, and the end-user is a price-sensitive farmer.
- Supplier power is moderate. Steel and other metals are commodities, but VST has shown limited ability to pass on cost rises quickly5.
- Threat of substitutes is real: small tractors, custom-hiring of machinery, and manual or animal labour where cheaper.
Through Hamilton Helmer's 7 Powers lens, the evidence supports scale economies in tiller manufacturing and a degree of branding with farmers and dealers. It also supports a form of cornered resource in the dealer network, though that is replicable with time and money. It does not support switching costs (a farmer can buy another tiller), network effects (none), counter-positioning (none apparent) or process power distinct from scale. The verdict, as Section IV argued: a moat around share, not around price.
Bull case
The bull case is real. VST is the undisputed leader in its niche1, rated AA- with interest cover of about 87 times1, with strong liquidity and no debt. Its operating margin improved to about 13.4% in FY20261. Retail finance is reducing its dependence on subsidies at the margin1. Weeders are growing fast. New tractor launches are scheduled. The June 2026 quarter grew revenue about 11%5. And the cash pile means that if management ever chooses to deploy it well, or return it, the effect on returns could be large.
Bear case
The bear case is equally concrete. Return on equity has fallen from about 19% to under 10%2. Five-year profit growth is about 3% a year2. Demand depends on subsidies and monsoons that VST does not control. Input costs are rising. Foreign investors have largely left. The P/E is above its own history, and part of the earnings it is applied to is treasury income, which the market does not usually reward with a 34-times multiple.
Risk radar
Four risks are material, each through a specific mechanism. Subsidy policy and the monsoon act on volume. Steel and commodity inflation act on margin. Chinese import policy acts on price. And execution on the ₹100 crore capex and new tractor launches acts on whether diversification ever shows up.
What would change ICRA's mind
The rating agency's own triggers are a useful summary. An upgrade would need sustained growth in scale and earnings along with diversification. A downgrade would follow a sharp decline in earnings or a large debt-funded capex or acquisition1. Neither looks imminent.
The two numbers to watch
- Operating profit excluding treasury marks. The cleanest reading is ICRA's operating margin of about 13.4% for FY2026, up from 11.4%, and about 12.85% in the June 2026 quarter on input costs15. Direction: up over the year, slipping slightly in the latest quarter.
- Tiller volume without fresh subsidy support, alongside the revenue mix. Tiller volumes rose about 35% in FY2026 and about 18% in the June 2026 quarter15; tillers were 60% of revenue1. Direction: growth slowing from a high base, mix still dominated by tillers.
On the third question, the verdict leans neutral. The balance sheet is high-quality. The economics are mid-quality. The price requires double-digit growth in operating profit, excluding treasury gains, through FY2027 and FY2028. That growth is plausible, given FY2026's improvement and the new products, but it has not yet been shown for more than a year at a time.
X. Epilogue (6 min)
On 23 September 2026, shareholders gathered for VST's 58th annual general meeting and approved a final dividend of ₹25 per share1. With about 86 lakh shares in issue, that is roughly ₹22 crore, about a fifth of the year's profit and a few percent of the cash on the balance sheet. It was a quiet, orderly meeting for a quiet, orderly company. It was also the clearest expression of the harvester model: a steady trickle out, the reservoir left full.
Tonight, VST stands at a point where the next twelve months will settle most of what this story has asked.
The first moment is the second half of FY2027. Tiller volumes have to be judged against a record year that had a Maharashtra subsidy behind it. If volumes and operating margins hold close to FY2026 levels without new subsidy increases, the case that FY2026 was a new base gets real evidence. If volumes fall back, FY2026 joins FY2021 as a year when the weather and the budget were kind.
The second is the FEN tractor launch and, with it, the first full-year revenue mix for FY2027. If tractors, weeders and exports gain a few points of share from tillers, the diversification story begins to move from slideware into the accounts. If the mix barely shifts, investors will have another year of evidence that VST is a tiller company with a tractor side business.
The third is capex. ICRA expects about ₹100 crore this year1. Whether the company actually spends it, and on what, will be the first sign of whether the cash pile is starting to work.
The fourth is the next quarter when markets move sharply. Each quarterly result will show how much of reported profit comes from the treasury, and how much the market chooses to look through it.
The fifth is the GST demand. When its resolution appears in the company's filings, a roughly ₹110 crore question6 will be answered one way or another.
Each outcome feeds back into the four questions. Durable volumes answer the first. Cleaner reporting and a smaller treasury answer the second. Double-digit operating growth answers the third. A changing mix answers the fourth. Until then the tension is plain: the market is pricing a company that has already solved these problems, and the company has not yet shown that it has.
XI. Outro (3 min)
Go back to that paddy plot, and that farmer walking behind a machine with an orange VST badge on the engine cover. He bought it, most likely, with help from a state scheme. He will use it for a decade, and he will need spares from a VST dealer the whole time. His harvest, and his next purchase, will depend on rain he cannot predict and on a subsidy budget he cannot influence.
VST is in the same position. It built one of the most durable franchises in Indian manufacturing on a machine most investors will never see, and then it stacked a fortress of cash behind it. But the weather and the government still set the harvest. VST owns its niche, and it owns its cash. It does not yet own the next niche.
References
-
V.S.T. Tillers Tractors Limited: Ratings reaffirmed, [ICRA]AA- (Stable)/[ICRA]A1+ — ICRA, 2026-07-29 ↩↩↩↩↩↩↩↩↩↩↩↩↩↩↩↩↩↩↩↩↩↩↩↩↩↩↩↩↩↩↩↩↩↩↩↩↩↩↩↩↩↩↩↩↩↩↩↩↩↩↩↩↩↩
-
VST Tillers Tractors Ltd share price and financials — Screener ↩↩↩↩↩↩↩↩↩↩↩↩↩↩↩↩↩↩↩↩↩↩↩↩↩↩↩↩↩↩↩↩↩↩↩↩↩↩↩↩↩↩
-
VST Tillers Posts Record ₹1,240 Cr Revenue in FY26; Adjusted PAT Surges 61% — Tradebrains, 2026 ↩↩↩↩↩↩
-
VST Tillers Q1 FY27 results: net profit rises 9% YoY — Scanx, 2026 ↩↩↩↩↩↩↩↩↩↩↩↩↩↩↩
-
VST Annual Report 2023-24 — V.S.T. Tillers Tractors Ltd ↩↩↩↩↩↩↩↩↩
 LinkedIn
 WhatsApp
 Reddit
 Hacker News
 Email
Email Kindle
 RSS Feed
 Spotify
 Apple Podcasts
 Amazon Music
 Audible
 YouTube