Viyash Scientific: Two Companies, One Ticker, and the Question of What Was Actually Built
I. Cold Open & Roadmap (5 min)
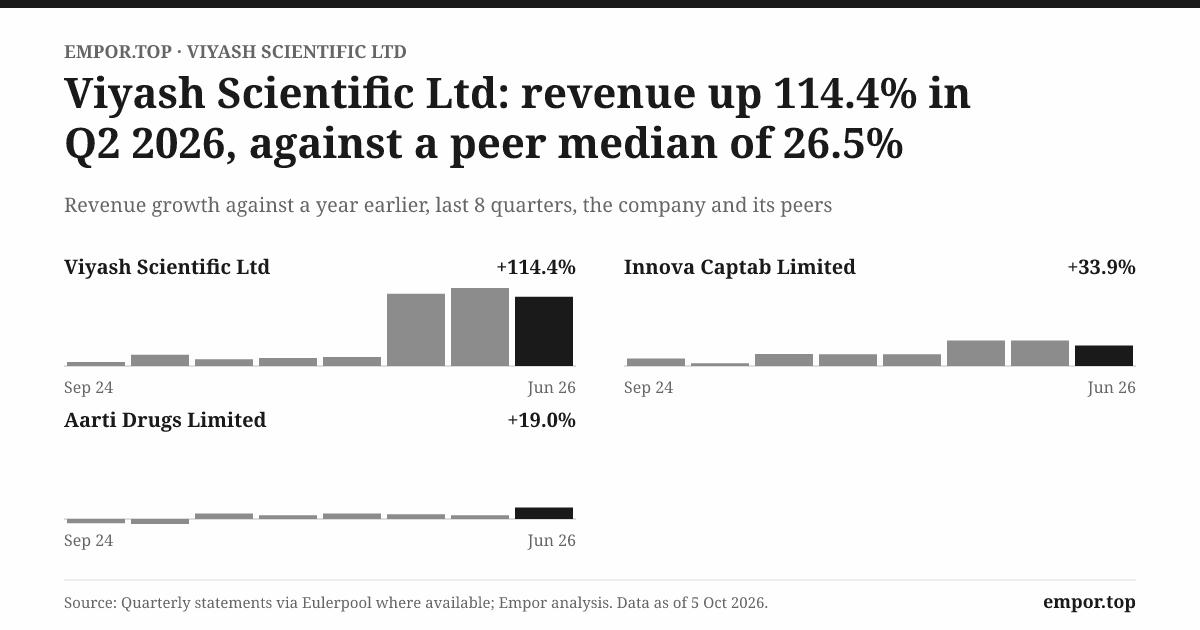
Picture the quarterly results table as a row of bars. For three years they barely move. A quarter brings in about $40 million, the next about $44 million, then $46 million, then $48.5 million in the September 2025 quarter6. It looks like a mid-sized Indian pharmaceutical company plodding through a hard cycle: some growth, some setbacks, small profits and occasional losses.
Then the December 2025 bar arrives and it is twice as tall: $96.5 million6. The next two quarters hold at about $100 million each6. The year-on-year growth line jumps from the teens to well over 100%. A screener reading the chart would flag a breakout.
Nothing in the business doubled overnight. No blockbuster launched, no plant came online, and no competitor collapsed. What happened was paperwork: a merger. The company that used to be called SeQuent Scientific, a Carlyle-backed maker of animal-health medicines, absorbed Viyash Life Sciences, a Hyderabad-based maker of human-health drug ingredients, and took its name14. The ticker changed to VIYASH. The bar doubled because two companies now report as one.
This sounds obvious, and it is. It is also the most important fact about the stock. On 5 October 2026 Viyash Scientific is worth about ₹10,112 crore, roughly $1.1 billion, and trades at about 242 times trailing earnings6. Every long-run number a screener shows (the ten-year revenue growth, the return on equity history, the five-year median valuation) describes the smaller animal-health company that existed before the merger, not the business being bought today. Most of the growth on the chart is arithmetic. The investment case depends on what is left once that arithmetic is removed.
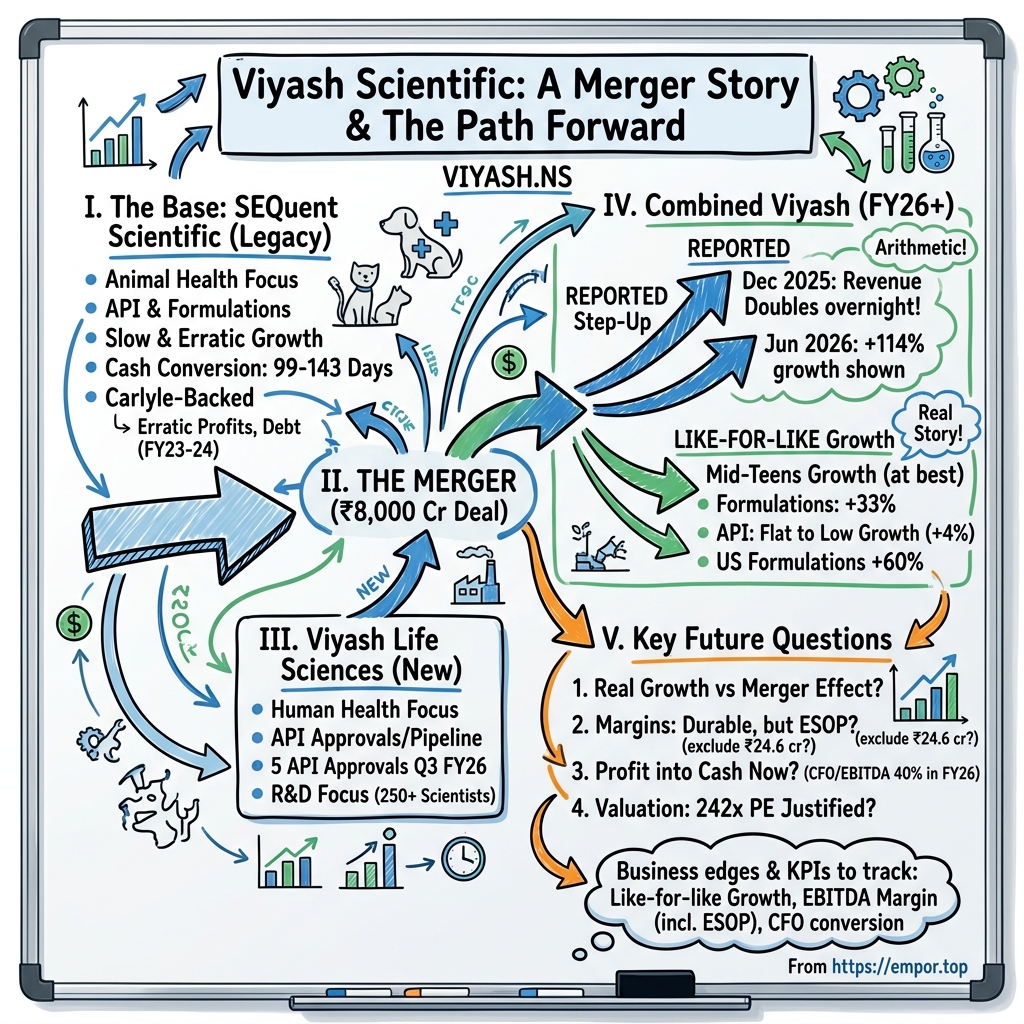
This story is built around four questions. Is the 2026 step-up real growth, or just the merger? Are the higher margins durable, and how much do employee stock option costs hide? Does profit now turn into cash, now that debt has been repaid? And does combining two quite different businesses create value at a price of 242 times earnings?
The order of play is straightforward. First the legacy business, SeQuent, and what its record says about the base rate. Then the human-health company it married, and the deal itself: the exchange ratio, the timing, and who gained. Then the combined numbers stripped of merger effects: growth, moat, margins and cash. Then the people in charge and the valuation. The thread through all of it is one discipline: measure the business behind the bar, not the bar.
To do that, start with the half of the company that has a public record: a decade of animal-health ambition that, for most of its life, went nowhere fast.
 Subscribe on LinkedIn
II. SeQuent: A Carlyle-Backed Animal-Health Roll-Up That Went Nowhere Fast (FY15–FY25) (15 min)
The year the losses came
In the year to March 2023, SeQuent Scientific lost about $15.1 million6. For a company with revenue of roughly $177 million, that was a net margin of about minus 8.5%6. The next year it lost money again, about $4.3 million on revenue that had fallen to about $165 million6. Debt to equity rose to about 0.74, the highest in the company's recent history6.
This was not supposed to happen. SeQuent's pitch had been simple and appealing: veterinary medicine is a steady, under-covered corner of pharmaceuticals. Livestock and pets get sick in recessions too. A company that made both the active ingredients (the APIs, the chemical compounds that do the medical work) and the finished formulations (the tablets, injections and powders a farmer or vet actually uses) could build a global animal-health franchise from an Indian cost base. SeQuent assembled one through acquisitions, adding operations in markets such as Turkey, Spain and Brazil alongside India1. Carlyle became its majority shareholder1.
What the record says
The business that Carlyle and management built has a long public record, and it is unforgiving. Revenue in US dollar terms was about $189 million in FY22, $177 million in FY23, $165 million in FY24 and $183 million in FY256. Over four years the legacy business went backwards and then recovered to slightly below where it started. In rupees the picture is a little better because of the currency, but the shape is the same: a plateau.
Profit was worse than flat; it was erratic. The operating margin swung from about 11% in FY21 to about 5% in FY22, then to a small loss in FY236. When a manufacturer's profit moves that much while revenue barely changes, it usually means the costs it cannot control (raw materials, currency, competitor pricing) matter more than the volumes it can.
The biggest of those uncontrollable costs had a name: Turkey. ICRA, the rating agency, lists Turkish hyperinflation and currency pressure as a historical drag on the business1. A subsidiary earning in Turkish lira during a period of very high inflation loses value every time its earnings are translated back into rupees, and an accounting rule for hyperinflationary economies adds further charges. SeQuent's Turkish operations were an asset in volume terms and a liability in reported earnings.
Two numbers to ignore
Two figures in the long record need to be set aside, because both would mislead an investor reading a screener.
The first is FY18. That year SeQuent reported net profit of about $65 million on revenue of about $132 million, a net margin of roughly 50%6. No manufacturer of generic veterinary medicines earns 50% net margins. The figure reflects a one-off gain, almost certainly from a disposal, and says nothing about the earning power of the business. Return on equity that year was 65%6; it never came close again.
The second is FY25's operating margin of 29.5%6. In the quarterly data, two quarters show operating margins near 30% (June 2024 and March 2025) while those around them show 4% to 10%6. That pattern points to classification oddities or one-off items in the data, not a business that suddenly found pricing power. ICRA's restated FY25 figures, which combine both companies on a like-for-like basis, put the operating margin before depreciation at 12.9%1. That is the number to anchor on.
The headline growth rate is not the history
The fact sheet reports revenue growth of about 18.6% a year over ten years6. It sounds like a compounder. But that ten-year figure ends in FY26, the year the merger roughly doubled reported revenue. Remove the merger and the legacy business grew in fits: quickly in the acquisition years to FY21, then not at all for four years.
One feature never changed: SeQuent was slow to collect cash. Debtor days (the number of days of sales sitting in unpaid customer invoices) ranged from about 85 to 140 over the decade, and the cash conversion cycle (the days from paying for raw materials to collecting from customers) ran between roughly 99 and 143 days6. Veterinary distribution in emerging markets runs on credit, and SeQuent financed its customers. That habit comes into the combined company.
So what
The legacy base rate is low growth, volatile margins and slow cash. For investors, that sets the bar. Any claim that the combined company will compound at mid-teens with stable 20% margins has to beat a record in which half of the business did neither for most of a decade.
So what did SeQuent marry, and why would it want a human-health partner at all?
III. Viyash Life Sciences: The Human-Health Half (8 min)
Two Carlyle businesses, two different worlds
The other half of the ticker came from Hyderabad, India's drug-ingredient capital. Viyash Life Sciences Private Limited (VLPL) made APIs and intermediates (the chemical building blocks that precede an API) for human medicines, and some finished formulations1. Its customers were generic drug makers in India, Europe and the United States, the companies that buy ingredients and turn them into the low-cost pills that fill most prescriptions.
It was founded by two chemists, Dr. Haribabu Bodepudi and Dr. Srihari Raju Kalidindi1. Hyderabad's API cluster was built by scientist-founders like them: people who learned process chemistry in large Indian pharmaceutical companies and then left to run their own plants. Carlyle backed VLPL as well as SeQuent1. That detail matters. When the two companies merged, a single private-equity sponsor sat on both sides of the table, and the founders of the smaller private company became insiders of the larger listed one.
What VLPL brought
ICRA records that VLPL grew revenue about 11.4% in FY251. That is respectable for an API maker in a period when Chinese competition and price erosion squeezed many Indian peers. The combined company now has an R&D team of more than 250 scientists and a pipeline of 17 products, and it reported five API approvals and launches in the December 2025 quarter13.
That capability is real. Getting a human API approved requires a documented manufacturing process, a filing with regulators (a Drug Master File in the US, a Certificate of Suitability in Europe), and plants that pass inspection. Five approvals in a quarter shows a working development engine.
But it is a different engine from SeQuent's. Human APIs are sold to generic drug makers, whose own customers are pharmacy chains and wholesalers fighting over every cent. Animal-health formulations are sold to distributors, vets and farmers, often in emerging markets. The regulators differ, the selling motion differs and the price dynamics differ. A merger of the two is diversification, not a combination of overlapping businesses with obvious cost savings.
Founders, insiders and related parties
The founders' role after the merger is the key governance fact. Their economic interest moved from a private company, where value was set by negotiation, to a listed one, where value is set daily by the market. Their stake in the listed company is a product of the exchange ratio, so the fairness of that ratio is in part a question about how much value flowed to them and to Carlyle. The company publishes the shareholding pattern quarterly on the exchanges56, and that is where an investor should track the founders' and Carlyle's holdings and any change in them.
Related-party dealings are a natural question when one sponsor owns both sides. Once merged, trade between SeQuent and VLPL becomes intra-company and disappears from the consolidated accounts. The live questions are dealings with entities the founders or Carlyle still control outside the listed company. Those appear in the annual report's related-party note6, and an investor should read that note each year rather than assume the merger cleared it.
So what
VLPL brought a credible human-health API business with a pipeline and approvals. It did not bring a business that shares customers, regulators or a sales force with animal health. That makes the price paid for it, and the ratio that set that price, the core of the capital-allocation story.
IV. The ₹8,000 Crore Merger: Ratio, Timing and What It Hid (20 min)
Announcement day
On 27 September 2024, SeQuent's shares jumped about 12% after the company announced it would merge with Viyash Life Sciences4. The combined value was put at about ₹8,000 crore4. The terms: for every 100 VLPL shares, holders would receive 56 new SeQuent shares4.
A 12% jump on a merger announcement tells you what the market thought on the day: the deal looked better for SeQuent's public shareholders than the alternative of a stagnant animal-health business with rising debt. It does not tell you whether the price was fair. That question is harder, and more important.
What an exchange ratio really is
An exchange ratio is a price expressed in shares rather than cash. When a listed company issues new shares to the owners of a private one, it is buying that company with a slice of itself. If the private company is valued too richly relative to the listed one, existing public shareholders end up owning a smaller share of a combined business than their contribution deserves. The cost is dilution, and it is invisible on the income statement.
The 56:100 ratio therefore embeds a relative valuation of VLPL against SeQuent. Because Carlyle stood behind both, the usual tension in a merger negotiation (a seller pushing the price up, a buyer pushing it down) was weaker than in an arm's-length deal. The safeguards in an Indian scheme of arrangement are an independent valuer's report, a fairness opinion, the review of the stock exchanges and SEBI, and a vote in which public shareholders are counted separately. Those documents sit in the scheme filings with the exchanges67.
The balance sheet shows the scale of what was issued. Shareholders' equity rose from about $83 million at March 2025 to about $330 million at March 20266. Roughly three-quarters of the combined company's book equity came in with the merger. That does not mean VLPL holders own three-quarters of the shares; book values are not market values. It does show that this was not SeQuent acquiring a bolt-on. It was closer to a reverse takeover in which the private human-health business became the larger part of the listed company.
Was the price fair?
The fair way to judge the ratio is to compare the value implied for VLPL with what the market pays for comparable Indian API and contract-manufacturing companies, measured against earnings before interest, tax, depreciation and amortisation (EBITDA). The scheme does not publish a stand-alone VLPL EBITDA and implied value in a form that makes that comparison clean, and ICRA's figures are combined. So the honest answer is that a precise verdict on whether SeQuent holders overpaid is not possible from the published numbers.
What can be said is narrower. The combined company today trades at about 16.9 times EBITDA6. If VLPL was valued at a similar or lower multiple than SeQuent at the ratio's struck price, public holders were not obviously diluted on valuation terms. The larger risk is not the multiple but the earnings it was applied to: if the merger was priced on VLPL earnings that included peak-cycle API pricing, the fall in API growth since then (Section V) matters.
When did it happen, and how was it counted?
ICRA dates the merger's effect to November 20251. The first quarter that shows combined revenue in the reported quarterly data is December 20256. The fact sheet's full-year FY26 revenue of about $388 million is larger than the sum of the four reported FY26 quarters (about $297 million)6, which suggests the annual accounts recast the full year on a combined basis, as Indian accounting allows when businesses under common control merge. The practical upshot for an investor is that no single series in the data provider cleanly shows the combined business before the December 2025 quarter. ICRA's restated FY25 operating income of about ₹3,002 crore1 is the cleanest like-for-like base.
Synergy: a promise, rated as a "monitorable"
Management presented the merger as creating a diversified life-sciences platform with shared R&D, chemistry skills and manufacturing. ICRA rated the combined company AA- (Stable) in April 2026 but named the synergy of two different businesses as a key monitorable1. That is a rating agency's polite way of saying the benefit has yet to show up in the numbers. The case for synergy rests on shared chemistry and a shared cost base for purchasing raw materials, not on cross-selling, since the customers barely overlap.
The Italian footnote
After the merger, the company agreed to acquire Bio For Life, an Italian business2. The relevance to the listed company is narrow and specific. ICRA's downgrade triggers include debt above 1.5 times operating profit before depreciation, or a large debt-funded acquisition1. With leverage at about 0.9 times in 9M FY261, there is headroom. Whether the Italian deal eats into it depends on price and funding, which is the figure to watch when it closes.
So what
The merger was a reverse takeover by a human-health business of an animal-health one, struck between two companies with the same sponsor. Its fairness depends on a valuation comparison the published numbers do not fully allow, and its value depends on synergies that a rating agency still lists as unproven. What it certainly did was make the growth chart misleading. The next task is to strip that out.
V. The Real Growth Rate: Stripping Out the Arithmetic (15 min)
Two numbers for the same quarter
In the June 2026 quarter, Viyash Scientific reported revenue growth of about 114% against the year before6. On the earnings call for the same quarter, management cited growth of about 19.5% on a combined basis, with revenue of about ₹946 crore2. Both numbers are correct. One compares the merged company with half of itself a year earlier. The other compares the merged company with both halves a year earlier.
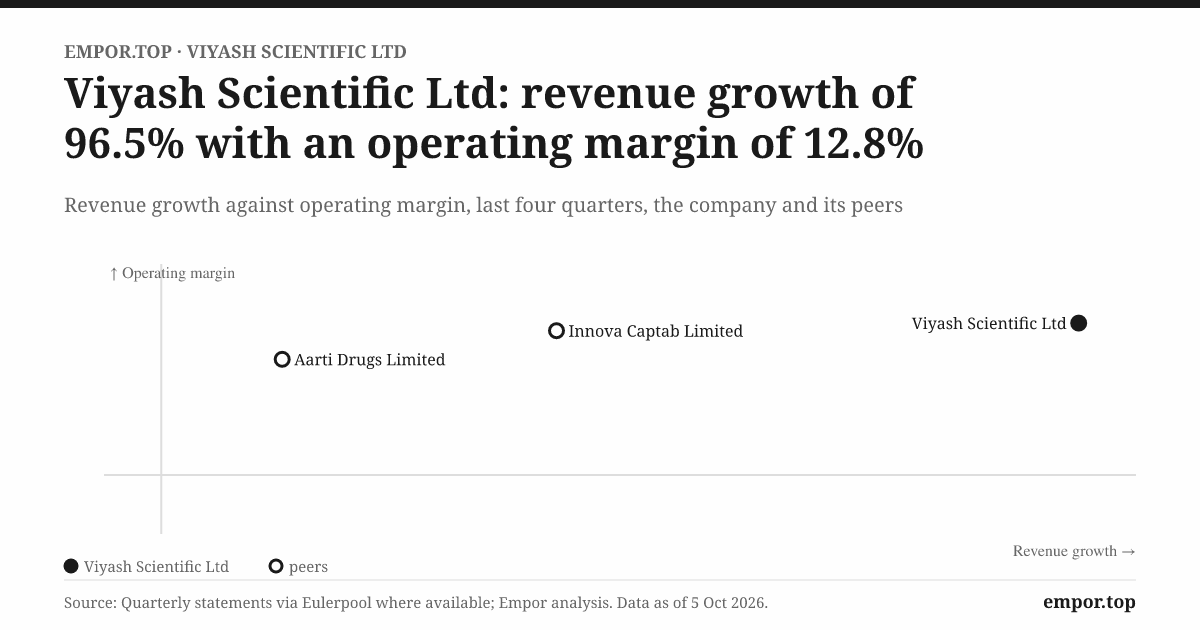
The second number is the real one. And it is good: 19.5% is well above the legacy SeQuent record and above VLPL's FY25 pace of about 11%1. But one quarter is a thin base. ICRA put combined growth for the nine months to December 2025 at about 12%1. The honest range for underlying growth is low to high teens, with a single strong quarter at the top.
Where the growth came from
Split the June 2026 quarter by product and a sharper picture appears. Formulations, the finished medicines, brought in about ₹555 crore, up about 33%3. APIs brought in about ₹383 crore, up just 4%3. Within formulations, US sales were about ₹126 crore, up about 60%, and India formulations about ₹43 crore, up about 63%3.
So almost all of the real growth came from one side of the business. Finished medicines, especially newer launches in the US and India, carried the quarter. The API business, which is the core of what VLPL contributed, was nearly flat. ICRA says more than half of 9M FY26 revenue was animal health and the rest human health1, so both the legacy and acquired halves remain material.
The US formulations number deserves a caution. Growth of 60% from a base of a little over ₹120 crore is what new product launches look like in their first year. US generics follow a familiar pattern: a launch earns good prices while few competitors are approved, then prices fall as more arrive. A 60% growth rate is a launch effect, and it should be expected to fade.
The API problem
Management attributed flat API revenue quarter on quarter to raw-material price volatility and the timing of customer orders2. Both are real features of the API business. Customers buy in batches, and a single large order slipping from one quarter to the next can make a quarter look weak. Raw-material prices, many linked to Chinese chemical supply, swing and are passed through to customers with a lag.
But the explanation is also the one every API maker offers in a weak quarter. The test is whether it reverses: if API growth recovers to high single digits or better over the next two quarters, timing was the story. If it stays near zero, the API business is losing share or price, and the more important half of the merger case (VLPL's chemistry engine) is underperforming. On the evidence available today, the more cautious reading is warranted: API growth of 4% in a quarter when the company grew almost 20% overall is a controllable miss until proven otherwise.
How the money is made
The revenue model is simple. Viyash sells products by the kilogram, batch or pack: APIs and intermediates to drug makers, finished medicines to distributors and pharmacies. There is no subscription layer and no recurring service revenue. Long-term supply agreements are common in APIs, but they typically fix quality and terms rather than guarantee volume. The company does not publish customer concentration figures or contract length in its results materials, so volume visibility is limited to what management says on calls.
Geographically the business spans India, Turkey, Spain, Brazil and the US1. That spread reduces dependence on any one market but brings currency exposure to several volatile ones.
So what
The real growth rate is mid-teens, carried by finished-medicine launches, with the API business close to flat. The settling evidence comes in the September and December 2026 quarters, when the merger enters the comparison base and the reported growth rate falls to something close to the real one. If reported growth then lands in the mid-teens, the story holds. If it falls to single digits, the 19.5% quarter was the peak of a launch cycle.
Growth only matters if it earns returns, and that depends on whether this business has any defence against competitors.
VI. The Industry and Moat: Generics, APIs and Vet Medicine (18 min)
Two scenes
Imagine two moments that define this industry. In the first, Viyash launches a generic medicine in the US. It has spent years developing the formulation and getting approval. Within months, a second and third competitor receive approval for the same product, and the buyer, a large wholesaler or pharmacy chain, asks each supplier for its best price. The price falls by a third. Nothing about the product changed.
In the second, a US FDA or European inspector arrives at a plant for several days, reads batch records, inspects clean rooms and interviews staff. A clean result keeps the plant's approvals. A bad one, a warning letter or import alert, can stop shipments from that site for a year or more.
These two scenes define the economics: price competition after launch, and regulatory approval as the main barrier to entry. Any moat for Viyash has to be built from those materials.
Porter's five forces
Buyer power is high. Generic drug makers and US wholesalers buy on price and multi-source critical ingredients deliberately. Veterinary distributors in emerging markets have more fragmented buyers, which helps, but they demand credit, which is where the long debtor days come from. Viyash does not publish customer concentration, so the degree of dependence on its largest customers is not visible.
Supplier power is moderate and volatile. Many key starting materials for Indian API makers come from China. ICRA names raw-material volatility as a rating constraint1, and management blamed it for flat API revenue2. Viyash has not shown it can pass raw-material increases through quickly.
Rivalry is intense. In human APIs, Viyash competes with large Indian manufacturers and a crowd of Hyderabad mid-caps, as well as Chinese producers. In animal health, it faces global companies such as Zoetis, Elanco and Boehringer Ingelheim's animal-health business, each many times its size, plus regional generics makers. Viyash is a small player in each arena.
The threat of new entrants is moderate. Regulatory approvals take years and plants need inspection records, so entry is slow. But it is not rare: India and China add API capacity every year.
The threat of substitutes is low for any single molecule, but higher for the portfolio as patents expire and new drugs replace old ones.
Helmer's seven powers
Of Hamilton Helmer's seven sources of durable advantage, three are worth testing.
Scale economies apply weakly. The merger made Viyash larger, but it combined two businesses that make different products for different customers. Scale in purchasing shared raw materials and in R&D overhead is plausible; scale in manufacturing a given molecule is not obviously changed.
Process power, the hard-to-copy know-how embedded in an organisation, is the strongest candidate. A good API chemist can find a cheaper route to a molecule, and a plant with a long clean inspection record is valuable. The 250 scientists and five approvals in a quarter are evidence of process capability13.
Counter-positioning, where an incumbent cannot copy a newcomer without hurting itself, does not apply. Network effects, switching costs, brand and cornered resources do not apply in any meaningful way to a generic API and formulation maker. Some veterinary brands in markets like Turkey may carry local brand value, but there is no published evidence of premium pricing.
Testing the moat against the record
The strongest test of a cost or process advantage is pricing: does the company hold its gross margin when competitors arrive? The combined company's gross margin was about 54% in the June 2026 quarter3. That is healthy for a business with a large formulations share, and it is the right base to watch. The historical record is not encouraging, though. SeQuent's operating margins collapsed from FY21 to FY23 when raw-material and currency costs rose6, which suggests it could not pass costs on. That is a price-taker's history.
Approvals are not revenue either. Five API approvals and 17 pipeline products describe options, not sales. The relevant question is how often prior approvals turned into durable revenue. The flat API line in the quarter just reported, after a period of approvals and launches, is a reason for caution. The company does not publish revenue by product or a conversion rate for filings to sales.
On inspections, the company does not highlight any specific observation in its recent results materials, and ICRA lists FDA and EU inspection risk only as a general constraint1. The FDA's public inspection database8 is the place to track it; a single adverse finding at a major site would be the event most likely to break the case.
The verdict on the moat
The moat is narrow: process capability and regulatory approvals, without switching costs or pricing power. That is typical for the industry, not a weakness unique to Viyash. The KPI that will confirm or erode it is gross margin against the roughly 54% base. If it holds as the US launches mature, the process advantage is real. If it slides, Viyash is what SeQuent was: a price-taker with good chemistry.
And with that, to the number management most wants investors to look at: the margin.
VII. The Margin Story and the ESOP Footnote (15 min)
The slide and the footnote
The June 2026 quarter investor presentation led with an EBITDA margin of 21.6%3. It was a striking number for a company whose restated FY25 margin was 12.9%1. A footnote changed the picture: the figure excluded about ₹24.6 crore of employee stock option (ESOP) costs in the quarter, against about ₹13 crore a year earlier3.
ESOP costs are a real expense. When a company grants employees options, it pays them in shares rather than cash, and the cost shows up as dilution for existing shareholders. Accounting rules require that cost to be charged in the income statement over the vesting period. Excluding it makes margins look higher; it does not make the cost disappear.
The worked calculation
Here is the margin including the ESOP charge, step by step.
Revenue in the quarter was about ₹946 crore2. A 21.6% margin on that revenue is EBITDA of about ₹204 crore before ESOP. Subtract the ₹24.6 crore ESOP charge and EBITDA falls to about ₹180 crore. Divide by revenue: about 19%.
So the real margin is closer to 19% than 21.6%. That is still a large improvement on 12.9% in FY25 and slightly above the 18.9% ICRA recorded for 9M FY261. The direction is genuine. The headline overstates the level by about 2.5 percentage points.
Why the margin rose
The improvement has three plausible sources. First, mix: finished formulations, growing 33%, usually earn higher gross margins than APIs, and the faster they grow, the higher the blended margin3. Second, operating leverage: fixed plant and overhead costs spread over higher sales. Third, lower finance costs, which do not affect EBITDA but improve profit further down. Raw-material relief may also have helped, but the company does not publish a cost bridge that would separate it.
The first source deserves the most attention. If the margin gain comes mostly from US launches earning first-year prices, it will fade when those prices fall. Management guides EBITDA margins of 20% to 22%1. Whether that guidance is measured including or excluding ESOP is the difference between a modest and a stretching target.
Who gets the options?
ICRA expected ESOP costs to rise in FY27 because of accelerated vesting after the merger1. Accelerated vesting after a merger usually means the deal triggered earlier-than-scheduled rewards for some employees and managers. The cost to December 2025 was about ₹30.8 crore1, and the June 2026 quarter alone added ₹24.6 crore. The annual report names the grantees among key managerial personnel and the number of options; shareholders should judge that pay against a company whose profit, after tax, was about $7 million in the June 2026 quarter6. ESOP costs equal to roughly a third of quarterly net profit (at about ₹88 to the dollar, net profit was roughly ₹60 to ₹65 crore) are not a footnote.
The tax rate and net margin
Further down the income statement, the picture is noisier. The tax rate was 47% in the March 2026 quarter, against about 30% in the quarter after6. Rates like this in an Indian manufacturer usually reflect losses in some subsidiaries that cannot be offset against profits elsewhere, deferred tax adjustments around the merger, or ESOP costs that are not tax-deductible. Net margin was about 7% in the June 2026 quarter6, against an EBITDA margin near 19% including ESOP: depreciation, interest and tax take more than half of operating profit.
Guidance discipline
The combined company has given margin guidance for only a few quarters, so there is no long track record to grade. So far, reported margins excluding ESOP have arrived near the guided range. That is a short record, set in a period of rising formulations sales and easing finance costs, which is the easiest environment in which to meet guidance.
So what
Margins have risen for real, from the low teens to about 19% including all costs. The headline figure overstates them. The test is FY27's full-year margin including ESOP: around 19% or above would confirm the step-up; a slide back toward the mid-teens as US prices normalise would show the launch cycle doing the work.
A margin is only as good as the cash it produces, and that is where this company's history is weakest.
VIII. Does the Profit Turn Into Cash? (15 min)
The gap
In FY26, Viyash Scientific reported EBITDA of about $74.2 million and cash from operations of about $29.9 million6. Only about 40% of operating profit arrived as cash. In a year when reported revenue doubled, that is the single most sobering ratio in the accounts.
The long view and the short view
Over twelve years, the record is better than it looks. From FY15 to FY26, cumulative cash from operations was about ₹787 crore against net profit of about ₹676 crore, or about 116%6. That ratio is flattered by the FY18 one-off gain, which inflated profit without producing operating cash, and by years of losses. Still, over time the legacy business did produce cash roughly in line with profit.
The problem is what happened to that cash. Free cash flow, after capital spending, totalled only about ₹56.5 crore over twelve years6. Almost everything the business earned went back into plants, acquisitions and working capital. About ₹23 crore went to shareholders as dividends, roughly 41% of free cash flow6. The company has paid no dividend since FY226. Cash and short-term investments rose from about ₹23 crore to about ₹270 crore by March 20266, but that increase came largely with the merger rather than from the legacy business's own cash generation.
Why FY26 was so weak
Some of the weakness is merger mechanics. A merger in the middle of a year combines balance sheets on one date while cash flows and profits may be counted on different bases, and working capital usually swells during integration. Working capital days jumped from about 72 in FY25 to about 111 in FY26, and debtor days rose from about 85 to 1126. The cash conversion cycle held at about 143 days6, the top of the decade's range.
Put simply: for every ₹100 of sales, Viyash waits nearly four months between paying for materials and collecting cash. That is long even for an Indian pharmaceutical company, and it ties up capital that could repay debt or fund launches.
Whether the rise in debtor days reflects slower-paying customers or merely the combined business's mix is answered by the trade-receivables ageing in the FY26 annual report6. The relevant signals are the share of receivables overdue by more than six months and the trend in expected credit loss provisions.
What the rating agency expects
ICRA projects cash from operations of ₹300 to ₹400 crore1. Against restated FY25 EBITDA of roughly ₹387 crore (12.9% of about ₹3,002 crore)1, that implies conversion of 80% to 100%. Against the higher EBITDA the company is now earning, it implies something like 60% to 70%. Either way, it is far above FY26's 40%. FY27 is the year that proves or disproves the cash story.
Reinvestment: maintenance-plus
ICRA expects capital spending of ₹100 to ₹150 crore a year with no major expansion for three to four years1. Against about ₹3,000 crore or more of revenue, that is 3% to 4% of sales, enough to maintain plants and add modest capacity. This is a business harvesting its installed base, not building a new one. If launches need more capacity, that assumption will change.
The balance sheet
The best news in the accounts is debt. The combined company repaid about ₹430 crore of debt in FY26, with about ₹267 crore more projected in FY271. Debt to equity fell from about 0.68 to 0.176. Quarterly finance cost fell to about ₹12.5 crore from about ₹20.4 crore3.
Net debt at June 2026 was about ₹166 crore, or about 0.1 times trailing EBITDA, according to the investor presentation3. One call summary cited ₹86 crore2; the presentation is the company's own document and the better source. At either figure, leverage is low.
Two smaller items complete the picture. ICRA describes Viyash as a net exporter that hedges "a part" of its currency exposure1, which leaves earnings exposed to rupee, lira, real and euro moves. And with about ₹270 crore of cash, treasury income is a small contributor to pre-tax profit, not a source of disguised earnings.
So what
The long-run record says the business can turn profit into cash. The recent year says it did not, partly for merger reasons. Debt is low and falling, which removes the risk that weak conversion leads to a funding problem. FY27 cash from operations against EBITDA is the measurement that matters: conversion of 70% or more would put the FY26 gap down to the merger; another year near 40% would mean the combined company has inherited SeQuent's worst habit.
Which brings the story to the people who control it.
IX. Management Credibility and Carlyle (10 min)
The vote
Every Indian merger by scheme of arrangement ends in a shareholder vote. For a deal between two companies with the same sponsor, the vote that matters is the one among public shareholders, because Carlyle's votes as an interested party cannot settle it alone. The scrutiniser's report on that vote, and the later votes on ESOP resolutions, are filed with the exchanges6. Dissent among institutional holders on ESOP plans tied to a merger is the clearest available signal of how independent investors viewed the terms.
Who controls the company
ICRA describes Carlyle as the majority shareholder1 and counts its backing as a strength, providing financial flexibility. That is true and two-sided. A private-equity owner brings governance discipline and access to capital. It also has a finite holding period. Carlyle has held SeQuent for years; at some point it will sell. A sponsor exit through block sales can weigh on the share price, and the merger arguably made the company a larger and more liquid exit vehicle. Investors should treat Carlyle's eventual sale as a known future event rather than a risk that might never happen.
The VLPL founders now sit inside the company, and their stake depends on the exchange ratio described in Section IV. The quarterly shareholding pattern5 shows Carlyle's, the founders' and the public's holdings, along with any pledge of shares. Pledged promoter shares are a common warning sign in Indian mid-caps.
Judging behaviour over time
The management record on SeQuent's side is the one with history, and it is mixed. It assembled an international animal-health business through acquisitions and then watched it stall for four years, with two years of losses, rising leverage and a Turkish business that was a persistent drag16. The FY18 one-off profit came from selling assets6. The verdict on that record is not good: growth by acquisition, followed by poor organic delivery.
The merger was the response. In effect, management and Carlyle admitted that the legacy animal-health business could not compound on its own and attached a faster-growing human-health business to it. That was a rational decision. Whether it was a good one depends on Sections V through VIII.
The calls
On the June 2026 quarter call, management's prepared remarks emphasised combined growth of about 19.5% and the margin improvement2. The questions that matter came from analysts pressing on the flat API business, the ESOP charge and net debt2. The API answer (raw-material volatility and customer timing) was plausible but general. Investors will be able to test it within two quarters. The December 2025 and March 2026 quarters, the first combined quarter and first full year, set the narrative of a diversified platform; the June quarter is the first one in which a segment visibly lagged.
The company does not publish a long history of quantified targets against which delivery can be scored. The guidance it has given, on margins and debt reduction, has so far been met. Debt repayment in particular went as promised1.
Audit and disputes
ICRA lists no specific legal or regulatory overhang beyond general inspection risk1. The auditor's report, the CARO annexure (an Indian requirement in which auditors comment on matters such as statutory dues and loans) and contingent liabilities are in the annual report6. Tax disputes are common in Indian pharmaceutical companies with foreign subsidiaries, and transfer pricing on intra-group sales is the usual source.
So what
The people in charge have a mixed long record and a short, so far creditable, record since the merger. Debt reduction was promised and delivered. Growth by acquisition did not deliver organically before. The main governance watch points are ESOP generosity, related-party dealings with founder or sponsor entities, and the timing of Carlyle's exit.
X. Playbook: Business & Investing Lessons (8 min)
Don't read a merger as growth. The December 2025 quarter doubled the bar on the chart, and nothing in the business doubled. Any growth rate that spans a merger date is an accounting fact, not an operating one. The investor's first job with any combination is to rebuild the base: put the acquired company into the prior year, then measure. At Viyash that turns 114% into about 19.5%, and then a quarter of that turns out to be launches that will fade.
Margins are what is left after the footnote. A 21.6% margin with ESOP excluded is a 19% margin with ESOP included. The difference is real money paid to employees in shares, and in a year of accelerated post-merger vesting it was large enough to equal about a third of the quarter's net profit. When a company tells you its margin, find the line it left out.
Cash is the audit. In the year reported revenue doubled, only about 40% of operating profit arrived as cash. Growth is a claim; collected cash is the evidence. A business that waits four months to get paid has to grow its working capital every time it grows its sales, and that is where profits go to hide.
Pay for the business you can measure. The 56:100 ratio priced a human-health API business that, a year and a half later, grew its API sales by just 4% in a quarter. A share-for-share merger between companies with the same sponsor deserves more scrutiny, not less, because the shareholders without a seat at the negotiating table pay for any optimism in the ratio with dilution.
Cheap on leverage, rich on earnings. Net debt of about ₹166 crore makes the balance sheet look safe. A price of about 242 times trailing earnings makes the stock anything but. Low debt protects the company. It does not protect the shareholder from paying too much.
XI. Bull vs Bear and the Valuation (12 min)
The scene
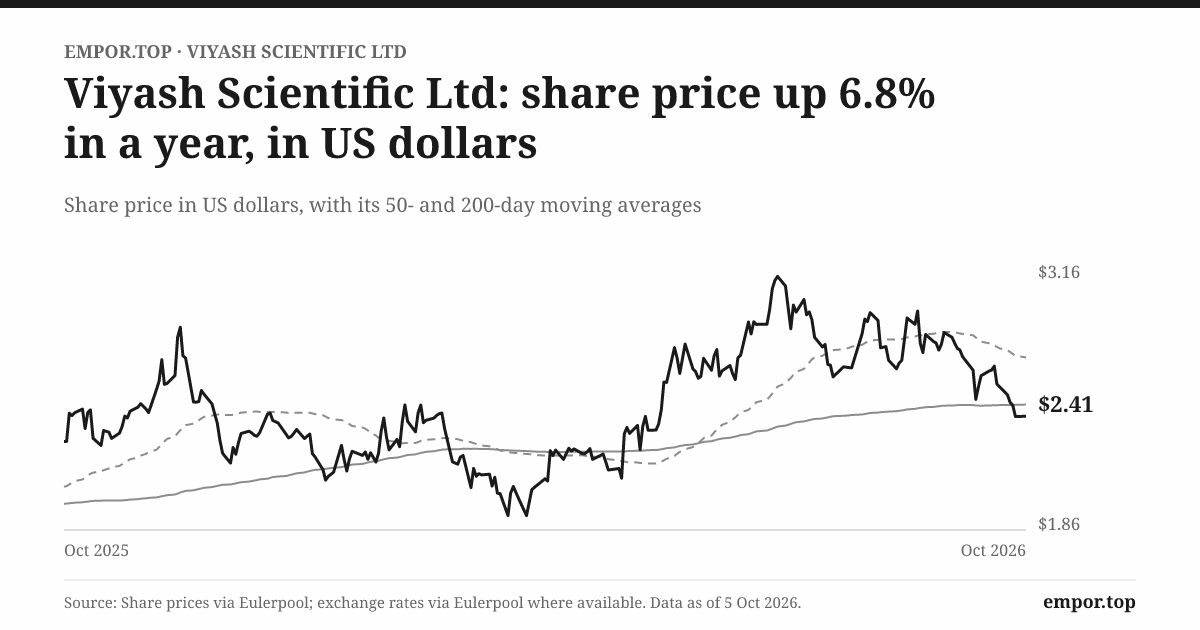
On 5 October 2026 the share price sits about 21% below its 52-week high6. Over five years it has suffered a fall of up to 72%6, and its one-year volatility is about 42%6. This is a stock that has been loved and abandoned more than once.
What the multiples say
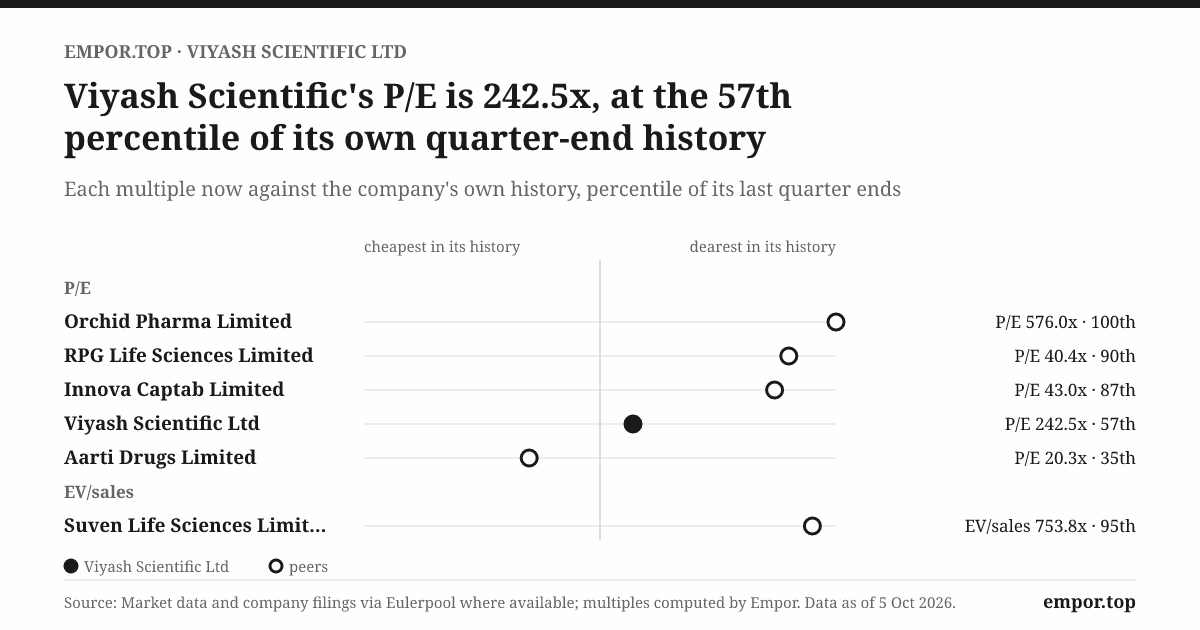
On trailing earnings, the stock trades at about 242 times, against a five-year median of about 178 times6. Both numbers are close to meaningless. The trailing earnings combine pre-merger legacy quarters, merger costs and a heavy ESOP charge. The five-year median is computed on SeQuent's loss and near-loss years, when any price divided by tiny earnings produces an enormous multiple.
The more useful multiples are EV to EBITDA of about 16.9 times and EV to sales of about 3.2 times6. On those measures, Viyash is priced like a solid Indian pharmaceutical mid-cap: not cheap, not extreme. The price assumes that the combined company sustains margins near 19% to 20% and grows in the mid-teens for several years. Comparison with Indian API and animal-health peers on EV to EBITDA is the right frame; trailing P/E is not.
Return on equity is about 5.5% and return on capital employed about 11%6. The low ROE partly reflects the merger's inflated equity base, but it also means shareholders currently earn modest returns on the capital in the business. The free cash flow yield is about 0.4%6: the stock is priced on future cash, not present cash.
The bull case
The bull sees a combined company growing at 12% to 19% on a like-for-like basis, with finished formulations launching successfully in the US and India23. Margins have risen from about 13% to about 19% including ESOP, and management guides to 20% to 22%1. Net debt is near zero, the rating is AA- (Stable)1, and capex needs are modest, so cash should build quickly once working capital normalises. Carlyle's backing provides capital for acquisitions. If FY27 cash flow lands in ICRA's ₹300 to ₹400 crore range, the stock's EV to EBITDA multiple will compress fast as EBITDA grows.
The bear case
The bear sees an API business growing 4% in the quarter3, meaning the human-health half that justified the merger is stalling. US formulations growth of 60% is a launch effect that will fade as generic prices fall. ESOP costs are rising with accelerated vesting1. Debtor days of 112 and a 143-day cash cycle6 show the business is financing its customers. Turkish, Brazilian and European currencies add volatility, the company hedges only part of its exposure1, and a single adverse FDA or EU inspection could halt shipments from a major plant. The Bio For Life acquisition adds event risk against a 1.5x leverage trigger1. Carlyle will eventually sell.
The short-seller's stress test
A skeptical long-short investor would make four arguments. First, the merger was a related-party transaction that public shareholders could not negotiate. Second, the headline margin excludes a growing cost. Third, cash conversion in the first combined year was poor. Fourth, the stock trades on growth that is largely launch-driven and will normalise.
What would prove the short-seller wrong? Two quarters in which reported growth, with the merger in the base, holds in the mid-teens; a full-year FY27 margin of about 19% or better including ESOP; and cash from operations of at least ₹300 crore. All three are measurable within twelve months.
Risks, by mechanism
US price erosion works through the number of approved competitors per product: each new entrant cuts the price buyers will pay. Raw materials work through Chinese supply of key starting materials, where price spikes hit API margins before contracts reset. Inspections work through plant approvals: one warning letter can stop revenue from a site. Currency works through translation of Turkish, Brazilian and European earnings into rupees, and Turkey's history shows how damaging it can be. Integration works through management attention and the ability to deliver synergies that a rating agency still calls unproven.
Three KPIs
Three numbers will tell investors whether the case is working. The first is like-for-like revenue growth, last reported at about 19.5%2. The second is EBITDA margin including ESOP, about 19% in the June 2026 quarter on the calculation in Section VII. The third is cash from operations as a share of EBITDA, about 40% in FY266. Gross margin, about 54%3, is the early warning for the moat.
XII. Epilogue (5 min)
Tonight Viyash Scientific stands at a natural checkpoint. The merger is complete, the debt is largely repaid, and the business has reported three combined quarters. The fourth will change how the story looks.
The September 2026 quarter, due within weeks, is the first in which the merger begins to sit in the comparison base, and the December 2026 quarter the first fully like-for-like. After that, the reported growth rate stops being arithmetic. If both quarters print growth in the mid-teens, the answer to the first question is that the merger revealed a business that can grow. If they print single digits, the 19.5% quarter will look like the peak of a launch cycle, and the API stall will become the story.
The second moment is the full-year FY27 cash flow statement, published in mid-2027. Cash from operations in ICRA's ₹300 to ₹400 crore range1 would answer the third question: the merged company turns profit into cash. A repeat of FY26's 40% would mean the slow collections of the legacy business now apply to a company twice the size.
The third is the closing of the Bio For Life acquisition. Its price and funding will show whether management and Carlyle treat low leverage as a buffer or as capacity to spend. A deal funded largely with debt that pushes leverage toward 1.5 times would be a signal that the post-merger discipline has limits.
Each outcome speaks to the questions this story began with. Growth answers whether the step-up was real. Margins including ESOP answer whether profitability is durable. Cash answers whether profit is real. And all three together answer whether a share-for-share merger between two businesses with the same sponsor, priced today at a premium, created value for the shareholders who were not in the room.
The tension that remains is simple. The balance sheet has never been stronger. The operating record has never been shorter.
XIII. Outro (4 min)
Go back to the chart. A long, flat row of bars, then one that doubles. For most stocks, that bar would be the story. For Viyash Scientific it is a disguise. Behind it is an animal-health company that spent a decade trying to compound and could not, and a human-health company whose best product line just stalled, joined together and priced as though the combination is greater than either half has ever been.
Maybe it will be. The margins have risen, the debt is gone, and the launches are working. But one bar became two companies, and the investor's job is to measure the business behind it. Viyash doubled overnight. Now it has to prove it can grow for real.
References
-
Viyash Scientific Limited (formerly Sequent Scientific) rating rationale — ICRA, 2026-04-22 ↩↩↩↩↩↩↩↩↩↩↩↩↩↩↩↩↩↩↩↩↩↩↩↩↩↩↩↩↩↩↩↩↩↩↩↩↩↩↩↩↩↩
-
Viyash Scientific: Q1 FY'27 Revenue Surges 19.5% to ₹946 Cr, earnings call transcript — Investywise, 2026 ↩↩↩↩↩↩↩↩↩↩
-
Viyash Scientific (NSE:VIYASH): what did its Q1 FY27 investor presentation reveal — Kalkine, 2026 ↩↩↩↩↩↩↩↩↩↩↩↩↩↩
-
Sequent Scientific jumps ~12% on ₹8,000 crore merger with Viyash Life — IIFL, 2024-09-27 ↩↩↩↩
-
VIYASH quote, announcements and shareholding pattern — NSE India ↩↩
-
Corporate announcements, financial results, annual reports, AGM voting results and shareholding (scrip 512529) — BSE India ↩↩↩↩↩↩↩↩↩↩↩↩↩↩↩↩↩↩↩↩↩↩↩↩↩↩↩↩↩↩↩↩↩↩↩↩↩↩↩↩↩↩↩↩↩↩↩↩↩↩↩
-
FDA inspection classification and warning letters database — US FDA ↩
 LinkedIn
 WhatsApp
 Reddit
 Hacker News
 Email
Email Kindle
 RSS Feed
 Spotify
 Apple Podcasts
 Amazon Music
 Audible
 YouTube