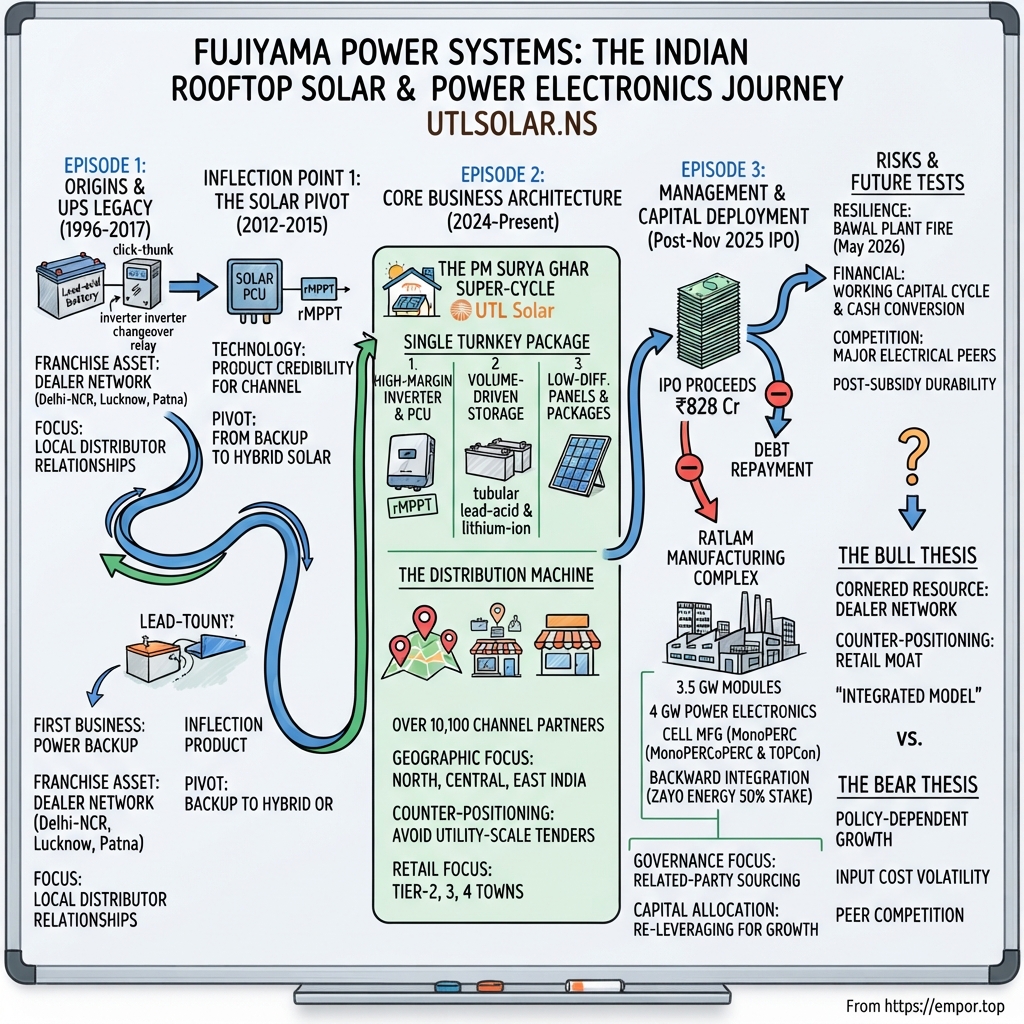
Fujiyama Power Systems: The Indian Rooftop Solar & Power Electronics Boom
I. Introduction & Episode Roadmap
There is a particular sound that defines a North Indian summer evening, and it is not the ceiling fan. It is the click-thunk of an inverter changeover relay — the split-second when the grid drops out and a lead-acid battery in a steel box under the stairs takes over household power. For roughly three decades, that sound defined an entire industry: a fragmented, unglamorous, local business selling backup power to households dealing with unreliable utilities.
Somewhere in that business, across the dealer lanes of Delhi-NCR and the electrical bazaars of Lucknow, Patna, Indore, and Jaipur, a company called UTL was quietly assembling an asset that would prove far more valuable twenty-five years later: not a proprietary technology, but a distribution list. That network comprised thousands of small electrical shops, local installers, and independent wiring contractors who decided which brand to recommend when a homeowner faced power disruptions.
That dealer network explains why Fujiyama Power Systems Ltd commands market attention today. The company listed on Indian exchanges in November 2025 under the ticker UTLSOLAR, raising ₹828 crore in a book-built issue priced at ₹228 per share.1 It closed fiscal 2026 with revenue of ₹2,654.5 crore, up 72.3% year on year, and profit after tax of ₹304.1 crore.2 In the June 2026 quarter, revenue expanded 125% year on year to ₹1,345.7 crore, prompting management to raise its full-year growth guidance from 50% to 70%.3 By September 2026, public markets valued the business at roughly ₹12,400 crore.4
Those figures reflect a business operating at a steep point on its demand curve. Because those numbers are so steep, they require rigorous scrutiny.
The Core Question
Here is the central question facing the company, and it remains open.
Is Fujiyama a durable, distribution-moated consumer power electronics franchise — a business shaped like Havells or Luminous, where the core asset is the dealer network and brand recognition among installers, making the specific product secondary? Or is it a solar component assembler whose rapid growth stems primarily from a single government subsidy scheme, executed using imported Chinese cells and lithium batteries, in a category where every major Indian electrical brand now offers comparable packages?
As of September 2026, the evidence points in both directions, and the company has yet to navigate a full market cycle to resolve the debate. Fujiyama has operated as a public company for less than a year. It has not experienced a slowdown in the PM Surya Ghar subsidy program, nor has it faced aggressive price competition from established peers like Havells or Exide in rooftop packages. The goal of this analysis is to evaluate each claim in the bull thesis against disconfirming evidence in the company's disclosure record, establishing which claims hold up, which require revision, and which remain unproven.
Why This Story Matters Now
Three structural factors converged in the mid-2020s to create this growth environment.
The first was policy. In February 2024, the Government of India launched PM Surya Ghar: Muft Bijli Yojana, a central scheme offering direct subsidies to households installing rooftop solar systems, with an ambition of one crore — ten million — homes.5 Unlike prior rooftop solar initiatives, this policy targeted households directly rather than commercial developers, disbursing subsidies directly to consumers for 1–3 kW installations completed by local vendors. This structure routed market demand directly through the last-mile retail channels UTL spent nearly three decades building.
The second factor was geography. Demand for Indian rooftop solar is concentrated outside major metropolitan high-rises, thriving instead among independent homeowners in Tier-2, Tier-3, and Tier-4 towns. These locations feature high daytime power consumption, roof ownership, inconsistent grid service, and an absence of national installation chains. Penetrating these markets requires local distribution relationships rather than national advertising campaigns.
The third factor was product integration. A rooftop solar installation consists of multiple components: panels, inverters, batteries, mounting hardware, wiring, and ongoing local service support. Whichever provider controls the complete integrated package controls the customer relationship.
The Road Ahead
This analysis traces Fujiyama's trajectory from its origins in uninterrupted power supply (UPS) chargers and lead-acid batteries in 1996 to its development of patented rapid maximum power point tracking solar inverters. It then details the current operating structure: the B2C package model, the 10,000-partner distribution network, and the strategic decision to bypass utility-scale tenders. Next, it examines corporate governance, leadership, and the deployment of IPO capital into a new manufacturing complex at Ratlam, Madhya Pradesh — including related-party sourcing arrangements that warrant careful evaluation. The narrative then stress-tests key thesis assumptions against disclosures, including a factory fire that damaged ₹143.6 crore of assets in May 2026. Finally, it applies competitive frameworks (Helmer's 7 Powers and Porter's 5 Forces), reviews recent analyst communications, and outlines the core bull and bear cases along with the three key performance indicators that will determine the outcome.
The story begins where that changeover relay sound first started.
 Subscribe on LinkedIn
II. Origins & Critical Inflection Points: From UPS Chargers to Solar PCUs (1996–2017)
Picture Delhi in 1996. The Indian economy had been liberalized for five years, and middle-class households were acquiring their first air conditioners, computers, and refrigerators. At the same time, state electricity boards were losing a quarter or more of their generated power to technical and commercial losses. Scheduled summer load-shedding and wide voltage fluctuations posed constant risks to household appliances.
Into that infrastructure gap stepped founders Pawan Kumar Garg and Yogesh Dua, establishing UTL to sell backup power systems rather than solar hardware.
The Unglamorous First Business
The early product line focused on uninterruptible power supplies (UPS), home inverters, and battery chargers. A home inverter converts direct current from a battery into alternating current for household use, switching over fast enough to prevent lighting flickers. The paired tubular lead-acid battery was a heavy, commodity product with a three-to-five-year lifespan. Neither component carried significant intellectual property. Success depended instead on distribution: retail buyers relied heavily on recommendations from local shopkeepers and electricians.
The market was dominated by hundreds of unbranded regional assemblers alongside a few organized players such as Microtek and Su-Kam building national brands. In this category, the dealer served as the primary customer interface. While a homeowner purchased backup hardware once every seven years, an electrician recommended systems weekly. Building volume required winning over the local installer channel.
UTL operated in this segment for roughly fifteen years. Disclosures state that the company carries over 29 years of legacy under the UTL Solar and Fujiyama Solar brands.4 That legacy was built less on proprietary technology than on an extensive network of dealer relationships.
Inflection Point #1: The Solar Pivot and rMPPT (2012–2015)
By the early 2010s, urban power reliability improved through expanded generation capacity, distribution reforms, and reduced scheduled outages. As grid stability grew in major cities, demand for pure backup inverters began to plateau in their most profitable urban markets.
In response, UTL pivoted toward off-grid and hybrid Solar Power Conditioning Units (PCUs). A PCU functions as a backup inverter integrated with solar management controls, directing energy flows between solar panels, batteries, and the grid based on real-time availability and demand.
A key engineering feature of this transition was rapid maximum power point tracking (rMPPT). A solar panel's power output varies with sunlight intensity, ambient temperature, and surface dust. At any given moment, a specific combination of voltage and current yields maximum power output. Because passing clouds, dust, or partial shading alter this ideal point continuously, an MPPT controller dynamically adjusts electrical parameters to optimize power extraction. By contrast, older pulse width modulation (PWM) controllers clamp panel output directly to battery voltage, sacrificing excess available power.
Fujiyama targeted operating conditions common across India: high dust levels, partial shading in dense settlements, ambient temperatures exceeding 45°C, and wide grid-voltage variations. Management claimed that its rapid tracking algorithm recovered meaningful power output under these volatile environmental conditions.
Falsification Pass: Did the Technology Become a Moat?
This analysis addresses the defensibility of that technology directly rather than deferring it to a final risk summary.
The core bull thesis asserts that patented rMPPT technology provided Fujiyama with a defensible technical moat in solar inverters. However, the disclosure record and industry developments suggest a more limited advantage.
Maximum power point tracking is an established engineering control method utilized across the global power electronics industry. Throughout the 2010s and 2020s, international string inverter manufacturers—including Growatt, Sungrow, and Solis—supplied high-efficiency multi-MPPT products to the Indian market, while domestic electrical manufacturers expanded competing solar inverter lines. Any early timing advantage from a localized algorithm did not constitute a permanent technological barrier.
What the evidence supports is a commercial sequencing advantage: the rMPPT branding gave UTL a credible product story to offer its established dealer channel during a category transition. While this enabled the brand to shift from backup power to solar without losing distributor loyalty, it represents a commercial execution advantage rather than a technological monopoly. If rMPPT provided a true technical moat, it would manifest as sustained pricing power over comparable peer products, an outcome not demonstrated in subsequent financial disclosures.
Inflection Point #2: Consolidation as Fujiyama Power Systems (2017)
The second major shift was structural. In 2017, management consolidated its manufacturing and brand assets under Fujiyama Power Systems Limited, the corporate entity that later listed on public exchanges.1 This restructuring integrated power electronics, solar module assembly, and battery manufacturing into a single business, enabling the company to market complete systems under the UTL Solar brand rather than standalone components.
For residential customers in Tier-3 and Tier-4 markets, single-vendor accountability simplified purchasing and ongoing service compared to sourcing panels, inverters, and batteries from separate suppliers. This 2017 consolidation established the operating architecture required for Fujiyama's later turnkey package model.
The consolidation also shaped the company's governance framework. The promoter group retained near-total ownership—holding 99.67% prior to the IPO and 87.88% immediately following the listing1—alongside an ecosystem of affiliated entity relationships.
By the late 2010s, Fujiyama possessed an established dealer channel, an integrated product portfolio, and a consolidated corporate structure. However, large-scale consumer demand remained limited until key policy shifts arrived via central government initiatives.
III. The PM Surya Ghar Super-Cycle & Core Business Architecture (2024–Present)
On 13 February 2024, the Government of India formally launched PM Surya Ghar: Muft Bijli Yojana.5 For much of the Indian solar industry—from gigawatt-scale module manufacturers and independent power producers to engineering, procurement, and construction (EPC) firms competing in reverse auctions—residential rooftop solar had long been a minor segment. The rooftop category had routinely missed official targets set since 2015, while industry capital concentrated in utility-scale projects.
For a company that spent nearly three decades building distribution through local electrical shops, however, the policy shift proved transformational.
Why This Policy Was Different
Earlier rooftop initiatives operated through state distribution companies and empanelled vendors, creating administrative delays and limiting direct consumer access. PM Surya Ghar reversed this structure: subsidies flow directly to households for systems in the 1–3 kW band via a central national portal, with registered vendors completing the installation.5 The government's target of one crore—ten million—homes created a distributed demand pool equivalent to gigawatts of capacity spread across thousands of towns.
This policy framework aligned directly with Fujiyama's existing distribution footprint. Rather than creating a new sales channel, the policy monetized a network of local dealers that Fujiyama had originally established for backup power products.
The policy also created a critical supply-chain requirement. Because subsidized installations enforce Domestic Content Requirement (DCR) rules, demand pivoted toward domestically produced solar components. In response, Fujiyama management framed its manufacturing build-out around DCR-led rooftop demand.6 Consequently, the regulation not only drove market volume but also shaped which supply chain captured it.
The Three Businesses Inside One Box
Fujiyama markets what functions as a single turnkey product—a working rooftop system—assembled from three distinct operating segments, each carrying a different economic profile.
The inverter and PCU business serves as the system's control center and generates the company's highest profit margins. This segment houses Fujiyama's engineering identity in rapid maximum power point tracking (rMPPT) and provides its primary product differentiation beyond price. The inverter also acts as an integration anchor: designing power conditioning units to match the company's proprietary battery and module specifications makes the bundled package the simplest path for local installers.
The energy storage business—encompassing tubular lead-acid and increasingly lithium-ion batteries—drives unit volume and recurring replacement sales. Fujiyama has been cited as holding roughly 15.5% share of the Indian solar battery market.7 Storage systems offer predictable replacement cycles, as lead-acid battery banks typically require replacement every four to five years through the same dealer channel. However, gross margins in this segment remain hostage to raw material costs, particularly lead and lithium carbonate, both of which fluctuate faster than retail package prices can be adjusted.
The panels and complete packages business represents the lowest-differentiation segment and carries the greatest exposure to input costs. Solar module assembly—laminating cells into a panel with glass, ethylene-vinyl acetate (EVA) sheets, backsheets, frames, and junction boxes—adds less value than cell manufacturing itself. Because Indian assemblers have historically imported the vast majority of their solar cells, this dependence remains a structural vulnerability for the business—an issue addressed in subsequent sections.
The company's own operating disclosure is that the residential rooftop solar segment accounts for approximately 90% of revenue.3
The Distribution Machine
The central pillar of Fujiyama's growth model—and the core foundation of the bullish investment thesis—lives in its distribution architecture.
Fujiyama does not sell directly to homeowners. Instead, it operates through a multi-tiered distribution network comprising distributors, dealers, local solar installers, and exclusive UTL Solar Shoppe franchise outlets. At the time of the FY26 results the network stood at over 8,900 channel partners serving more than 1.4 million customers.6 By the June 2026 quarter, after adding more than 80 distributors, 1,000 dealers and 30 exclusive shops in a single quarter, the count had crossed 10,100 partners, with the company entering Odisha and Uttarakhand and targeting 15,000 partners by FY28.3
Adding a thousand dealers in ninety days highlights strong retailer demand to stock the brand. However, rapid channel expansion introduces working capital risks. Each new dealer relationship represents a credit decision, creating potential for receivables quality to deteriorate if oversight lags. While partner expansion increases market footprint, long-term financial health depends on revenue productivity per partner and prompt cash collection rather than gross distributor headcount alone.
Counter-Positioning Against the Utility Guys
Fujiyama's commercial positioning is defined as much by the market segments it avoids as those it targets.
Utility-scale solar in India operates on low-margin reverse auctions. Developers bid tariffs down to thin margins, module suppliers compete on price per watt against Chinese landed costs, and counterparties are frequently state distribution companies with documented histories of late payments. Industry leaders such as Waaree, Premier Energies, and Tata Power compete in this capital-intensive, scale-driven market.
By contrast, selling a 2 kW system to a homeowner in a town like Muzaffarpur follows entirely different economics. Retail customers pay upfront or through financed EMIs without tariff auctions. Pricing is determined by what the installer can justify rather than a bid table, while the high cost of servicing isolated 2 kW installations deters utility-scale manufacturers lacking local service infrastructure.
This retail focus shields Fujiyama from utility-scale price competition, but it does not constitute a permanent technological moat. Established electrical and battery manufacturers—such as Havells, V-Guard, Luminous, and Exide—possess dealer networks of comparable or greater density in adjacent categories. Should these well-capitalized peers introduce competing turnkey packages, pricing pressure across Fujiyama's retail channels could intensify.
Testing the Distribution Claim
Evaluating the strength of Fujiyama's distribution channel reveals both operational advantages and regional concentration risks.
In its favor, financial performance through fiscal 2026 and the first quarter of fiscal 2027 reflects organic end-market demand rather than channel stuffing. Revenue nearly doubled in FY26 while EBITDA margin expanded from 16.1% to 18.5%.6 When a company drives growth through aggressive channel discounting, margins compress. Expanding margins alongside volume growth indicate operating leverage and pricing power, which management attributed substantially to backward integration and product mix.
Conversely, the network remains geographically concentrated in North, Central, and Eastern India, and high regional concentration of sales was flagged as a risk factor around the offering.8 Establishing distributor density in new territories requires upfront sales investment before generating steady revenue.
Fujiyama maintains a genuine distribution advantage currently amplified by a policy tailwind. However, strong policy support makes it difficult to separate organic channel quality from broader category expansion, a distinction that will be tested when end-market growth eventually moderates.
Evaluating the sustainability of this execution leads directly to corporate governance, leadership strategy, and the deployment of capital into new manufacturing capacity.
IV. Management Credibility, Governance, & Capital Deployment Record
On 20 November 2025, Fujiyama Power Systems listed on the BSE and NSE at ₹220 against an issue price of ₹228 — a listing-day discount of roughly 3.5%.9 The issue was subscribed 2.14 times, reflecting a measured rather than euphoric market reception.9 For a solar-adjacent company entering public markets during a strong thematic rally in Indian equities, it was a sober debut.
By September 2026, the stock traded around ₹406.4 Initial market skepticism gave way to substantial repricing as quarterly operating results arrived.
The Two Men at the Top
Pawan Kumar Garg serves as Chairman and Joint Managing Director, while Yogesh Dua serves as Chief Executive Officer.10 They have directed the business together since 1996 — steering it through the backup-power era, the solar pivot, the 2017 corporate consolidation, and the public listing. Thirty years of shared leadership in Indian mid-cap manufacturing establishes clear management continuity, effectively aligning executive incentives with business outcomes. Promoters held 86.63% of the equity as of the most recent disclosure.4 Management's financial stakes remain directly bound to long-term equity performance.
That alignment offers stability, but it introduces a structural constraint for public investors. With a public free float below 15%, conventional minority-shareholder mechanisms — such as activist engagement, proxy voting pressure, or the threat of board restructuring — carry minimal leverage. Corporate governance relies primarily on promoter conduct rather than public market discipline, a structural reality that investors must factor into valuation.
Regarding secondary management incentives, detailed disclosures on performance-contingent equity below the founder level were not included in the public materials reviewed for this analysis; the lack of information marks it as undisclosed rather than absent.
Where the IPO Money Went
The ₹828 crore capital raise was structured as ₹600 crore in fresh equity and a ₹228 crore offer for sale.1 Fresh proceeds were allocated primarily across two areas: approximately ₹180 crore was earmarked for establishing a new manufacturing facility at Ratlam, Madhya Pradesh, while roughly ₹275 crore went toward debt repayment.1
That allocation pattern highlights the condition of the pre-IPO balance sheet. Less than a third of the fresh capital directly funded expansion, with the larger share directed to deleveraging. Heavy indebtedness was explicitly cited among the risk factors in the offering documents.8 The company had expanded at over 70% annually by funding working capital through borrowings, making the equity raise as much a balance-sheet repair as a growth initiative.
Ratlam: The Bet
The manufacturing complex at Ratlam represents the central operational test of management's capital allocation strategy, and early execution has moved quickly.
By the end of fiscal 2026, the 2,000 MW solar panel assembly line at Ratlam was operational, while inverter and battery manufacturing was slated for the first and second quarters of fiscal 2027, respectively; a 1 GW MonoPERC cell facility was operating at approximately 65% capacity utilization.6 In August 2026, the company commissioned an additional 2 GW solar panel line and a 2 GW power electronics plant, expanding total panel capacity to about 3.5 GW and power electronics capacity to about 4 GW.3 The board separately approved a 1.2 GW TOPCon solar cell expansion at Ratlam requiring an estimated investment of ₹350 crore.11
These developments present two contrasting implications.
On one hand, completing facility commissioning on schedule is relatively rare in Indian industrial project execution, where greenfield construction frequently encounters delays. Meeting announced operational dates provides an early benchmark for management's project execution capabilities.
On the other hand, upcoming capital expenditures are no longer financed by IPO proceeds. Management has guided toward approximately ₹1,300 crore in additional capital outlay, funded through debt and internal cash generation without equity dilution.3 This represents a larger investment program than the IPO originally funded, undertaken on a balance sheet that recently required equity to reduce debt. The company is effectively re-leveraging to support its expansion, a strategy whose success depends on end-market demand holding steady through the capacity ramp.
The primary strategic rationale for Ratlam involves moving upstream into cell production. Assembling modules from imported cells is a low-margin conversion activity. Manufacturing cells — MonoPERC currently and TOPCon planned — offers higher potential margins and satisfies Domestic Content Requirement rules. If successful, backward integration strengthens the module division's unit economics. However, if global cell prices compress, Fujiyama risks holding substantial fixed-cost assets in a cyclical commodity segment.
The Related-Party Question
A critical area requiring investor oversight involves related-party sourcing relationships.
Fujiyama holds a 50% equity stake in Zayo Energy Private Limited following a ₹5.01 crore investment through a compulsorily convertible debenture agreement. Zayo operates across the solar supply chain, producing PV ribbon wire, PV busbars, copper wires, solder bars, solder wires, aluminium frames, EVA sheets, junction boxes, and backsheets.12
This product slate represents nearly the entire bill of materials for a solar module, excluding the cell and glass.
Management frames this arrangement as strategic backward integration. Acquiring dedicated input supply for a rapidly expanding module facility follows standard industrial logic, and a 50% stake via convertible instruments provides greater visibility than arm's-length purchases from a promoter-owned vendor. Nonetheless, the structure creates an ongoing governance question regarding transaction pricing and purchasing volume as Ratlam expands beyond 3.5 GW. A half-owned supplier positioned between a listed enterprise and its promoters warrants continuous tracking in audited related-party disclosures.
Regarding accounting oversight, no qualified audit opinions were reported in the financial disclosures evaluated for this report.
The Cash Flow Fact Nobody Should Skip
A key cash flow metric underscores the working capital requirements of Fujiyama's business model. In fiscal 2025, while generating ₹1,541 crore in revenue and ₹156 crore in net profit, operating cash flow stood at negative ₹3 crore, and free cash flow reached negative ₹515 crore.4
This cash consumption profile reflects rapid volume growth within a working-capital-intensive retail distribution network, where accounting profits are absorbed by rising inventory and customer credit. While expanding distribution businesses typically consume cash during growth cycles, this dynamic increases financial risk if market demand slows. It also explains why the IPO was necessary and why debt reduction absorbed most of the fresh proceeds.
By fiscal 2026, working capital cycles had moderated to 59 days, while return on capital employed (ROCE) reached approximately 35% and return on equity (ROE) stood at roughly 37%.4 While these return metrics reflect strong current profitability, they are calculated during an ongoing capacity build-out; returns on capital often appear elevated before newly commissioned assets fully register on the balance sheet.
Evaluating the overall investment case requires testing each core thesis claim against the disclosure record and operational risks.
V. Historical Falsification: Stress-Testing the Thesis Claims
Every investment case relies on a core set of claims. The most rigorous analytical exercise is not merely listing those claims, but actively searching for evidence that could disconfirm each one—and establishing plainly what survives.
Claim One: A Durable Technology and Pricing Moat
The strongest test of pricing power is not a single margin percentage. It is price realization on a comparable product over an extended period against a broadening competitive set.
The mechanism that would disconfirm a technology moat is relentless commoditization, which has defined solar power electronics globally. Standardized string inverters entered India at scale from Chinese manufacturers, while domestic electrical majors—including Havells, Microtek, and Exide—extended their consumer brands into solar lines using identical dealer channels. Any product feature detailed in a datasheet risks being replicated within a single product cycle.
The verdict: the technology moat claim is rejected. What survives is a much narrower proposition: the company maintains sufficient product credibility to secure shelf space and installer preference, rather than technical superiority that commands a durable pricing premium. The margin expansion recorded in fiscal 2026 and the first quarter of fiscal 2027 is better explained by backward integration and product mix than by pricing power over customers.6
The key performance indicator that will confirm or disconfirm the revised claim is the blended gross spread per watt on complete packages, tracked through periods when input costs are falling. Holding margins when demand exceeds supply is straightforward; the true test is whether the company passes cost declines to consumers under competitive pressure—and whether it maintains volume if it chooses not to.
Claim Two: Backward Integration Creates a Defensive Manufacturing Moat
This claim is more compelling because the underlying capacity is currently being constructed rather than merely asserted.
The disconfirming evidence is structural and documented: Indian solar module assembly has historically depended on imported cells, predominantly from China and increasingly routed through Southeast Asia. Dependence on Chinese imports was explicitly identified as a key risk factor in offering documents.8 Policy shifts surrounding India's basic customs duty structure and the Approved List of Models and Manufacturers (ALMM) regime have repeatedly altered module assembly economics with minimal notice. In a business selling fixed-price retail packages through a dealer channel, sudden input cost spikes cannot be passed on immediately after installers have already quoted homeowners.
Fujiyama's response rests on its cell build-out at Ratlam: a 1 GW MonoPERC cell facility operating at roughly 65% capacity utilization, paired with an approved 1.2 GW TOPCon expansion.611 Operating these facilities successfully at scale would convert its primary supply chain vulnerability into a regulatory compliance advantage under Domestic Content Requirement rules for subsidized rooftop installations.
The verdict: not yet proven, and accurately characterized as a strategic bet rather than a moat. Facility commissioning and regulatory certification do not equal full commercial success; a cell line at 65% utilization remains in its operational ramp phase. Confirming evidence requires sustained high utilization across at least two full fiscal years, with module gross margins holding through an input-cost down-cycle. Falsifying evidence would be capacity utilization remaining below targets, or internal transfer pricing that forces the module division to absorb uncompetitive cell costs.
Claim Three: Disciplined Capital Allocation
The public track record here remains brief—Fujiyama has operated as a listed company for less than a year—limiting how much confidence any verdict deserves.
The observable data shows IPO proceeds deployed broadly as outlined, with the larger share directed to debt repayment and a designated portion allocated to Ratlam.1 Initial commissioning milestones at Ratlam were also met on schedule.36
However, this execution is tempered by the immediate pivot to a ₹1,300 crore capital expenditure program funded through debt and internal accruals within months of using equity to deleverage.3 A company that raises equity partly to pay down borrowings, then re-levers to fund a significantly larger expansion, has not yet demonstrated capital discipline across a full cycle. It has demonstrated strategic conviction—two qualities that appear identical while market demand is expanding.
The verdict: intact but unproven. A management team operating in a favorable demand environment has not yet faced a down-cycle test, and the limited operating sample size does not justify characterizing capital allocation as proven discipline.
Claim Four: Operational Resilience
Beyond strategic execution, operational resilience was tested by an unexpected disruption.
On the evening of 6 May 2026, a major fire broke out at Fujiyama's manufacturing facility in Bawal, Haryana—a solar tubular battery plant.13 All employees evacuated safely without reported injuries.14 The company stated that assets were insured, filed a claim, and activated alternate manufacturing arrangements through third-party partners to maintain supply continuity.14
The financial impact materialized in the June 2026 quarter: a provision of ₹143.6 crore recognized under exceptional items, which reduced reported profit after tax to ₹57.8 crore even as normalized profit after tax rose 144.5% to ₹165.2 crore.3
Evaluating this incident requires separating three distinct analytical dimensions:
First, the operational outcome was favorable: absorbing the loss of a key battery plant during a peak demand period while delivering 125% revenue growth in that same quarter indicates supply chain flexibility and third-party manufacturing depth.3 That represents a stress-tested operational data point.
Second, the accounting treatment warrants ongoing monitoring. Management provisioned the full loss as an exceptional item anticipating insurance recovery.3 Settlement timing and final payout amounts remain open variables; any eventual shortfall between insurance proceeds and the provisioned amount would represent a direct economic loss.
Third, single-site exposure remains a structural risk. A fire that damages one plant and generates a ₹143.6 crore charge underscores existing manufacturing concentration. As production consolidates into the larger Ratlam complex, single-site operational risk expands rather than contracts. While insurance covers physical assets, it does not recoup market share lost if competitors supply dealers during supply disruptions.
Claim Five: Financial Strength Through Growth
Prior disclosures established the cash-flow profile of the business in fiscal 2025.4 The reduction in working capital cycle to 59 days in fiscal 2026 reflects operational progress.4 However, underlying balance-sheet details warrant scrutiny: inventory days rose from 98 to 123, which management attributed primarily to raw material stockpiling ahead of capacity expansion.6
Inventory accumulation ahead of a plant expansion is a standard operational explanation. However, it requires verification over subsequent quarters. If inventory days decline as new production lines absorb raw materials, management's rationale holds. If inventory remains elevated while revenue growth moderates, working capital is being absorbed by unsold stock.
Management explicitly identified working capital normalization alongside capacity expansion as a primary priority for fiscal 2027.6 Acknowledging operational risks provides transparency, but sustained execution on cash conversion remains the critical test.
Claim Six: The Optionality Bets
Growth narratives surrounding consumer power electronics frequently highlight adjacent opportunities, such as electric vehicle charging infrastructure and large-scale battery energy storage systems. Analytical discipline requires assigning minimal valuation credit to these optionality bets until they generate disclosed revenue and profit margins. Public filings show no material commercial revenue from these adjacencies, and a business deploying capital into a ₹1,300 crore core capex program has limited capacity to fund speculative ventures.
Taken together, this falsification pass outlines a distinct business profile: a company benefiting from an active retail distribution network and policy tailwinds, executing an unproven backward-integration strategy, led by a management team with a short public execution record, operating a model that consumes substantial working capital during growth. This operational reality presents a far more nuanced investment picture than headline growth figures alone suggest.
Evaluating these dynamics requires comparing Fujiyama's position against its broader competitive set.
VI. Competitive Landscape, Porter's 5 Forces & Hamilton Helmer's 7 Powers
Understanding the competitive position of Fujiyama requires looking beyond standard market share tables. The operational reality of the market unfolds at the retail counter of an electrical shop in a district town.
When a customer inquires about rooftop solar, the shopkeeper rarely presents technical efficiency charts. Instead, the dealer asks about household size, monthly power bills, roof shading, and nighttime backup needs before recommending a specific package — typically the system currently in stock, familiar to local technicians, and backed by accessible service support. That retail point of sale represents the primary competitive battlefield.
Hamilton Helmer's 7 Powers
Cornered Resource — the strongest claim, with clear limitations. The network of more than 10,100 channel partners across Tier-2 to Tier-4 towns represents the hardest asset for competitors to replicate rapidly, having been assembled over nearly three decades.3 While established national brands possess recognized products, few maintain local service technicians in remote markets. However, a cornered resource provides lasting protection only if it remains exclusive. Most UTL partners operate as multi-brand dealers, with exclusive UTL Solar Shoppe outlets comprising a minority of the network. Because independent dealers can introduce competing brands at any time, this distribution advantage remains leaky.
Counter-Positioning — moderate to strong. Deliberately avoiding utility-scale tenders represents a clear counter-positioning strategy. Incumbent gigawatt-scale module manufacturers cannot economically service isolated residential rooftops, as their cost structures and sales operations cater to bulk buyers. Utility-scale producers seeking to enter the retail market would need an entirely new go-to-market strategy, creating a meaningful barrier to entry.
Process Power — moderate. Engineering products for specific Indian operating conditions — such as wide voltage fluctuations, extreme ambient heat, and heavy dust accumulation — alongside simplified installation designs, provides a modest operational advantage. However, these localized engineering adaptations do not constitute a long-term barrier to entry.
Scale Economies — emerging, rather than established. The manufacturing complex at Ratlam aims to deliver procurement and production efficiencies, with cell manufacturing representing a key strategic step.611 Nevertheless, 3.5 GW of module assembly capacity does not grant cost leadership against major domestic module manufacturers or large-scale Chinese producers. Scale in this context achieves regulatory compliance and supply assurance rather than structural cost leadership.
Switching Costs, Network Effects, and Branding — weak. A homeowner faces minimal financial or operational switching costs when replacing equipment. Brand loyalty is largely mediated by local installers, leaving the company's retail brand equity dependent on its dealer channel. If a competitor offers superior dealer margins or credit terms, channel loyalty can shift quickly.
Porter's 5 Forces
Threat of new entrants: high. Assembling solar modules and sourcing white-labeled inverters requires modest capital and minimal proprietary technology. The true operational barrier lies in establishing a nationwide after-sales service network, allowing new entrants to gain price share quickly while building service capabilities more slowly.
Bargaining power of suppliers: high. Key raw materials — including solar cells, polysilicon inputs, lithium carbonate, and lead — are traded in global markets dominated by large suppliers, with reliance on Chinese imports explicitly noted as a risk factor.8 Backward integration at Ratlam represents a direct attempt to mitigate this exposure through a capital-intensive, multi-year build-out.
Bargaining power of buyers: moderate. While individual homeowners lack bargaining power, significant buyer power rests with distribution dealers. Dealers exert leverage by negotiating margins, credit terms, and inventory support across competing manufacturers. Consequently, distributor credit terms and accounts receivable represent the key indicators of channel pressure.
Threat of substitutes: low in target markets. In regions characterized by unreliable grid supply and high daytime power consumption, residential solar systems paired with storage have few viable economic substitutes. Diesel generation entails substantially higher operating costs, while enduring frequent power outages carries significant indirect costs.
Competitive rivalry: high and intensifying. Three distinct competitor groups target the residential market. Consumer electrical brands — such as Havells, Luminous, V-Guard, and Microtek — bring comparable dealer reach and strong brand recognition. Battery specialists like Exide and Amara Raja possess established storage manufacturing and distribution networks. Meanwhile, solar manufacturers like Waaree, Premier Energies, and Insolation Energy offer larger module scale and lower production costs. Fujiyama's current defense relies on offering a fully integrated residential package backed by last-mile retail service, an operational advantage that remains subject to competitive catch-up.
Synthesizing these dynamics reveals a business supported primarily by last-mile distribution density and customer cost-to-serve protection, operating within an industry marked by intense rivalry and high supplier power. This position remains defensible during periods of rapid market expansion, but leaves the business exposed if market growth moderates, as dealer relationships can be targeted by well-capitalized competitors.
These structural dynamics explain the specific focus of analyst inquiries during recent company communications.
VII. Analyst Q&A Dynamics & Conference Call Dissections
Earnings calls for recently listed, fast-growing Indian manufacturers tend to follow a predictable pattern. Executive presentations highlight capacity expansions, channel partner growth, and raised guidance in confident terms. When the question-and-answer period opens, however, analysts pivot to more vulnerable ground: cash flow, input costs, and the sustainability of policy-driven demand.
Fujiyama’s capital markets communications have closely matched this dynamic.
What Management Emphasises
Across its fiscal 2026 full-year results and subsequent June 2026 quarterly update, executive narrative has focused on three core pillars:
First, capacity execution: management reported that the Ratlam complex remains on schedule, with module and power electronics assembly lines coming online and solar cell production expanding into TOPCon technology.3611
Second, network scale: executive presentations emphasized continuous channel expansion, entry into new state markets like Odisha and Uttarakhand, and a target to reach 15,000 channel partners by fiscal 2028.3
Third, revenue momentum: management raised its full-year fiscal 2027 revenue growth guidance from 50% to 70%, while projecting profit after tax margins in the 11% to 13% range.36
Raising guidance so early in a company's public tenure demonstrates executive confidence, but it also creates an explicit performance benchmark. Delivering on elevated targets builds market credibility; missing them shortly after listing risks lasting valuation damage.
Where Analysts Push
On input costs and tariff policies. Analysts frequently question how gross margins will hold up if domestic solar cell prices surge under Approved List of Models and Manufacturers (ALMM) regulations or if import duty structures change. Management points to vertical integration as its primary defense. While structurally logical, this strategy remains unproven in practice until internal cell production navigates a complete cost and price cycle.
On working capital management. Analyst scrutiny is particularly intense regarding cash conversion. Management attributed the rise in inventory days from 98 to 123 to raw material stockpiling ahead of manufacturing expansions.6 Given negative historical operating cash flows, analysts remain cautious.4 On upcoming calls, the critical detail to monitor is whether management discloses receivables aging across specific dealer cohorts or reports only blended aggregate figures, as aggregate metrics can mask payment delays among newly onboarded distributors.
On the Ratlam facility ramp. Inquiries focus on trial runs, commercial operation dates, and production ramp rates. Management has systematically cited target dates and met initial commissioning milestones.36 However, bringing the 1 GW MonoPERC cell facility beyond its current 65% utilization level remains an essential operational task.6
On policy and subsidy concentration. Analysts continue to probe business vulnerability to shifts in government support, specifically asking what occurs once PM Surya Ghar meets its residential targets or if state distribution company delays slow subsidy payouts. Management argues that its retail dealer network will sustain baseline demand through equipment replacement cycles and rising grid tariffs. While plausible, this assertion remains an untested hypothesis until central subsidy flows moderate.
On operational disruption from the Haryana fire. Analysts questioned supply continuity and the validity of accounting assumptions regarding the Bawal facility fire.3 Management explained that third-party manufacturing partners were promptly engaged to offset lost capacity—an operational claim corroborated by the June 2026 quarter's 125% revenue surge.143
Overall, executive responses have provided specific dates, operational metrics, and capacity targets rather than qualitative assurances. Maintaining transparency during a period of 125% revenue growth is straightforward; the definitive test of management disclosure will occur during the company's first cyclical downturn.
VIII. Bull vs. Bear Case & The 3 Key KPIs That Matter Most
Strip away the growth narrative and the core investment debate reduces to a single question: is Fujiyama a durable distribution franchise, or a temporary beneficiary of a government subsidy cycle?
Why Fujiyama Wins From Here
The bullish investment thesis does not depend on technological superiority. Instead, it relies on three linked propositions.
First, residential rooftop solar in India represents an extended adoption curve rather than a short-lived policy spike. With more than 250 million households—many located in the independent-roof, grid-unreliable regions Fujiyama targets—even a partial achievement of the government's one-crore-home target5 creates a multi-year installation pipeline. Furthermore, each complete system sold establishes a predictable battery replacement cycle four to five years later that returns to the same retail partner. In this view, central subsidies act as an accelerant for an adoption trend that rising electricity tariffs and power needs would eventually have driven.
Second, an expanded channel network—targeting 15,000 partners by fiscal 2028—evolves from a solar-specific sales chain into a broad consumer power distribution platform. Such a network could distribute adjacent products like lithium-ion storage and electric vehicle charging at low incremental distribution costs. This represents the highest-value scenario for the bull thesis, though it remains its least proven assumption.
Third, backward integration at Ratlam delivers operational efficiencies. Under this scenario, solar cell production maintains high capacity utilization, Domestic Content Requirement compliance provides a structural advantage under subsidized programs, and gross margins remain in the high teens as operating cash flow turns positive rather than accumulating as inventory. The simultaneous 72.3% revenue growth and margin expansion recorded in fiscal 2026 offers the strongest empirical support for this execution model.6
Why Fujiyama May Fail
Conversely, the bearish perspective does not dispute the company's recent operational momentum. Rather, it argues that current financial performance reflects a favorable policy convergence rather than a permanent competitive moat.
Subsidy mechanics represent the primary vulnerability. Subsidies under PM Surya Ghar are processed through state distribution utilities that frequently face financial constraints and administrative delays. A disruption in approval timelines or disbursement flows would not merely taper demand gradually; it could halt installations, trap inventory in retail channels, and exacerbate working capital pressures for a business that recorded negative ₹515 crore in free cash flow as recently as fiscal 2025.4
Margin compression poses a second structural risk. Fujiyama achieved an 18.5% EBITDA margin during a period when market demand exceeded component supply.6 Should well-capitalized peers such as Havells, Luminous, or Exide aggressively price turnkey residential solar packages, they could finance margin competition from established adjacent business lines. Because retail installer loyalty remains driven primarily by commercial terms rather than brand affinity, competitive margin pressure would hit Fujiyama directly through its dealer channel.
Input cost volatility represents a third challenge. The company's reliance on imported solar cells and raw battery materials leaves it exposed to sudden changes in tariff structures or regulatory lists until internal cell lines at Ratlam demonstrate sustained commercial production.8
Corporate governance structure represents a fourth consideration. With promoter equity ownership standing at 86.63%—leaving a limited public float4—and a 50%-owned affiliate operating within its core raw material supply chain,12 minority shareholders must rely on promoter stewardship and voluntary disclosure quality rather than institutional governance leverage.
Operational concentration risk represents a fifth vulnerability, an issue demonstrated concretely by the May 2026 factory fire at the Bawal facility.13
Weighing It
Evaluating the complete record indicates that Fujiyama's primary competitive asset remains its last-mile retail distribution network, which currently benefits from strong policy tailwinds. Operational evidence rejects the existence of a proprietary technological moat, shows backward integration at Ratlam to be in progress but unproven, and leaves capital allocation discipline unverified across a full market cycle.
Ultimately, market valuation hinges on two competing interpretations. Investors who view the distribution network as the core franchise expect retail channel density to buffer against subsidy cycles. Conversely, those who view government subsidies as the primary growth driver consider current operating margins to reflect a cyclical peak. Both interpretations align with available disclosures, leaving the durability of Fujiyama's growth model as the central open question.
The Three KPIs That Matter
Three specific operating metrics will clarify which interpretation holds true.
1. Revenue per active channel partner and product mix. While headline partner count indicates channel expansion, revenue per partner measures network productivity. If partner expansion outpaces revenue growth per distributor, channel density is diluting. Concurrently, tracking the proportion of revenue derived from integrated retail packages versus lower-margin wholesale components indicates whether Fujiyama maintains its retail pricing position.
2. Blended gross spread per watt and cell capacity utilization. This metric tests whether backward integration at Ratlam captures structural margin or shifts manufacturing overhead. A stable or expanding gross spread per watt during periods of declining global cell prices would confirm cost advantages, while capacity utilization across the MonoPERC and planned TOPCon cell lines serves as the key operational indicator.
3. Cash conversion efficiency. Comparing operating cash flow to net profit—decomposed into inventory, receivables, and payables cycles—provides the earliest signal of working capital health. Given past negative operating cash flows during rapid growth periods4 and inventory days extending to 123 in fiscal 2026,6 sustained cash collection from retail dealers remains the essential test of financial quality.
IX. Playbook & Business Lessons
Three strategic lessons emerge from Fujiyama's trajectory that extend beyond a single company or market.
Lesson 1: In emerging markets, last-mile distribution beats technical specifications. The highest-efficiency solar panel in the world holds little value for a homeowner in a district town if no technician within 50 kilometers is available to install it, honor its warranty, or service an inverter failure. In fragmented infrastructure markets, the scarce resource is rarely raw technology; it is trusted local capability. Fujiyama accumulated its most valuable strategic asset in a legacy backup-power category that is no longer its primary revenue driver. For investors, the corollary is twofold: while distribution networks are slow to build—making them valuable—non-exclusive dealer relationships mean these channels are rented rather than owned, capping their ultimate strategic moat.
Lesson 2: Counter-position away from utility tenders. The Indian solar sector's most severe losses were borne by companies that chased utility-scale volume through reverse auctions, only to learn that winning a tariff bid and collecting cash are distinct operational outcomes. Prioritizing retail homeowners over state distribution utilities yields smaller order sizes but superior cash conversion. The structural trade-off is that a consumer retail model requires ongoing channel maintenance, dealer incentives, and sales support, introducing its own continuous capital requirements.
Lesson 3: Servicing a subsidy differs from depending on one. Government subsidy programs represent genuine end-market demand, and servicing them is a valid growth strategy. The critical question for any company expanding on a policy wave is what durable assets it constructs before public support moderates. Fujiyama's approach—reinvesting cash flow into an expanded retail channel and backward-integrated cell manufacturing—is structurally sound. However, whether management completes this build-out before policy incentives evolve remains the central investment question, one that will be decided by operational execution rather than strategic design.
X. Epilogue & Outro
Three decades after its founders began selling backup power systems to households dealing with unreliable utilities, the business they built carries a market valuation of roughly ₹12,400 crore.4 That valuation rests on a proposition that remains fundamentally unchanged: Indian households will pay for reliable power, and they buy from vendors trusted by local electricians.
What has changed is the operating scale around that proposition. The product has evolved from a standalone backup inverter into an integrated rooftop solar system. Consumer demand is currently boosted by the largest residential solar program India has attempted.5 Manufacturing operations have expanded to the point where a single factory fire can materially impact a quarter's reported earnings.313 Meanwhile, promoters who owned nearly the entire enterprise prior to its public listing1 now answer to equity analysts on quarterly earnings calls.
Fujiyama stands at a familiar crossroads in Indian industrial manufacturing: a firm with genuine distribution strength, growing faster than its internal infrastructure was designed for, financing a capital expansion with debt, and operating in a market driven partly by policy mandates. Recent operational execution has exceeded historical benchmarks, yet the underlying financial character of the business—cash-consuming, working-capital-intensive, and exposed to raw material prices—remains unchanged.
The coming four to eight quarters will provide definitive empirical evidence: whether the Ratlam cell production lines achieve and sustain high utilization; whether working capital metrics normalize as management projected or inventory days remain elevated; whether insurance recoveries for the Bawal plant fire align with provisioned amounts; whether raised fiscal 2027 revenue targets are achieved; and whether, when PM Surya Ghar eventually moderates—as government subsidy programs inevitably do—the network of 10,000 retail partners remains loyal to Fujiyama or shifts to competing brands.
That final question has defined the trajectory of the enterprise since 1996.
References
-
Fujiyama Power Systems IPO Date, Price, GMP, Details — Chittorgarh, 2025 ↩↩↩↩↩↩↩
-
Fujiyama Power FY26 Net Profit Rises 94.5% to ₹3,041 Million — ScanX ↩
-
Fujiyama Power Systems Q1FY27 Results: Revenue surges 125%, normalized PAT up 144% — ScanX, 2026 ↩↩↩↩↩↩↩↩↩↩↩↩↩↩↩↩↩↩
-
Fujiyama Power Systems Ltd share price, financials and key ratios — Screener.in ↩↩↩↩↩↩↩↩↩↩↩↩↩
-
PM Surya Ghar: Muft Bijli Yojana Official Portal — Ministry of New and Renewable Energy, Government of India ↩↩↩↩↩
-
Fujiyama Power Systems: FY26 closes with sharp growth, Ratlam capacity build-out, and tighter focus on DCR-led rooftop demand — Multibagg, 2026 ↩↩↩↩↩↩↩↩↩↩↩↩↩↩↩↩↩↩
-
Fujiyama Power Systems IPO ends with subscription of 2.14 times — ICICI Direct, 2025 ↩
-
Fujiyama Power Systems Reports Strong FY26 Growth; Expands Solar Manufacturing Capacity — Innovacia Insights, 2026 ↩
-
Fujiyama Power Systems Approves ~1.2 GW TopCon Solar Cell Plant at Ratlam; FY26 Revenue Surges 72.3% — ScanX, 2026 ↩↩↩↩
-
Fujiyama Power Invests Rs. 5.01 Cr in Zayo Energy for Backward Integration — Saur Energy International ↩↩
-
Fujiyama Power Systems Reports Significant Fire At Bawal Manufacturing Facility On May 6, 2026 — Reuters via TradingView, 2026-05-07 ↩↩↩
-
Fujiyama Power Systems Haryana Plant Fire: Operations Under Review — Whalesbook, 2026 ↩↩↩
 LinkedIn
 WhatsApp
 Reddit
 Hacker News
 Email
Email Kindle
 RSS Feed
 Spotify
 Apple Podcasts
 Amazon Music
 Audible
 YouTube