TD Power Systems: The Engineering Backbone of Global Power & Data Infrastructure
I. Introduction & Episode Roadmap
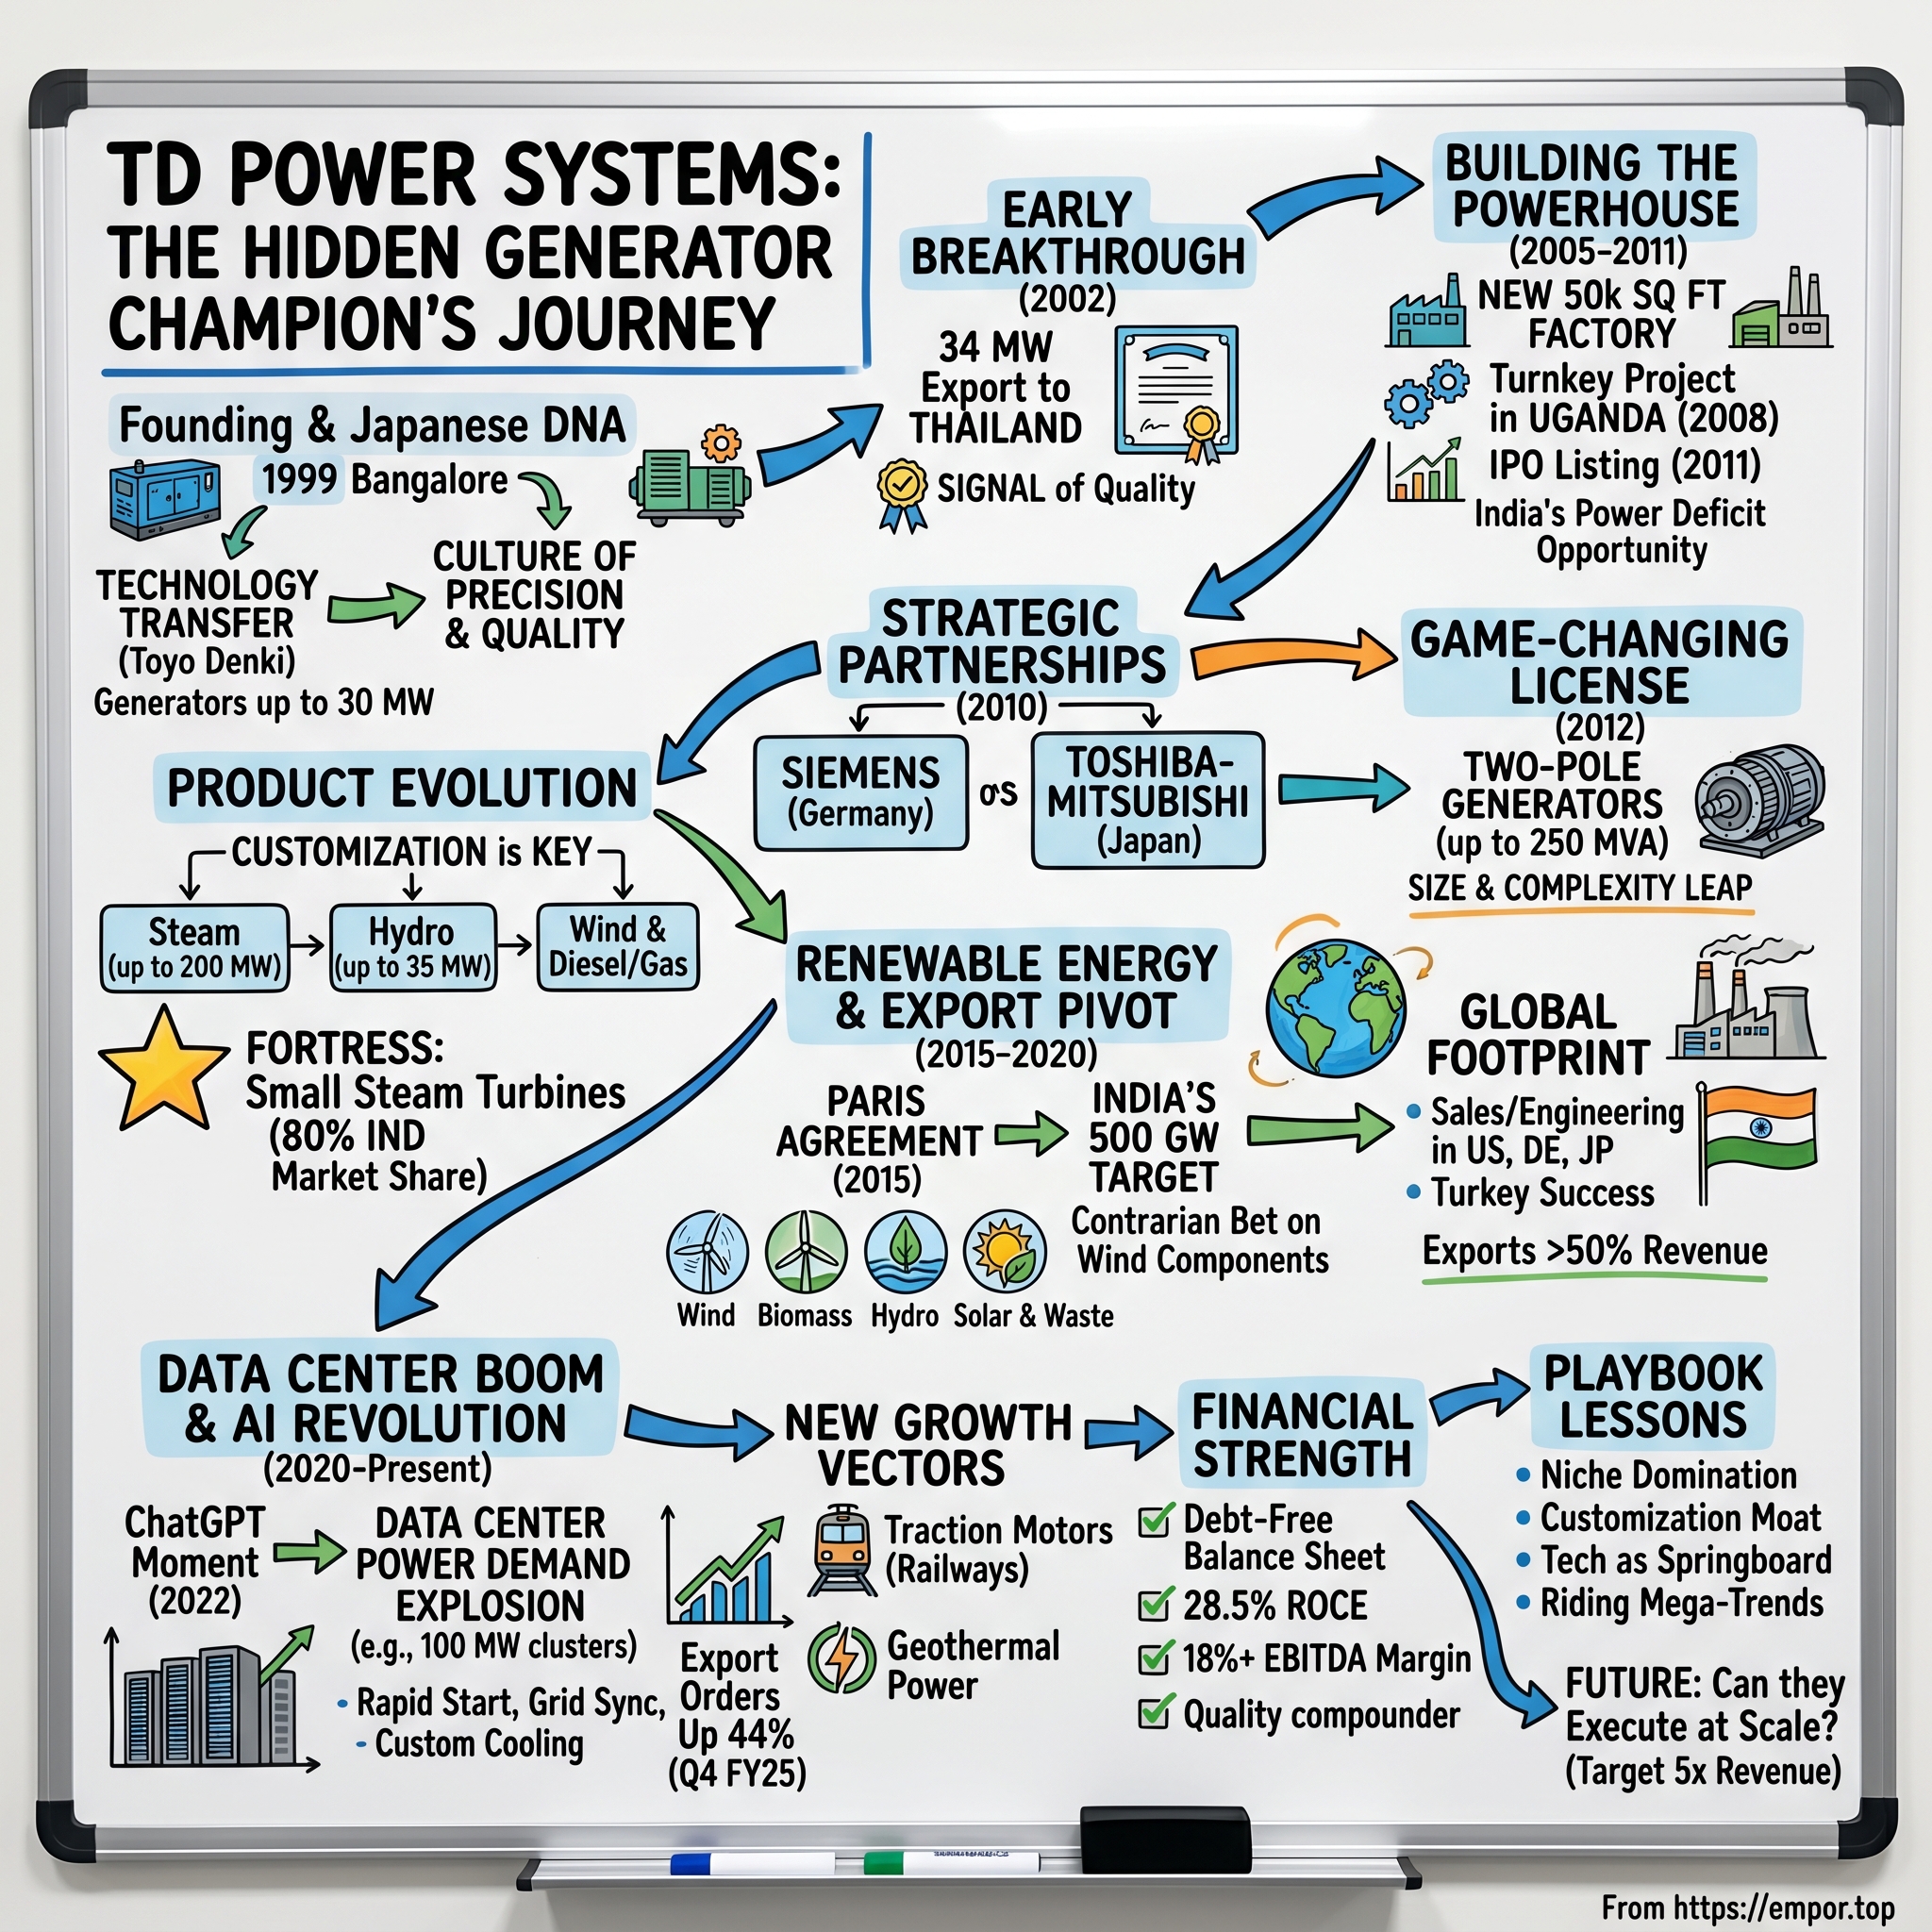
On May 15, 2026, a Bengaluru engineer named Nikhil Kumar dialed into a conference call and, between order-book metrics and guidance revisions, mentioned a detail that would have sounded improbable two decades earlier. Listing key projects using his company's equipment, he noted: "Notable orders are delivery to projects such as SpaceX, amongst others."1
A factory in Dabaspet — an industrial estate on the edge of Bengaluru Rural District, closer to a highway toll plaza than a technology hub — was manufacturing electrical machinery for one of the world's most demanding aerospace firms. Yet within TD Power Systems' broader order book, SpaceX represented only a footnote.
TD Power Systems Limited trades on the NSE and BSE under the ticker TDPOWERSYS. It manufactures a component rarely seen by retail consumers: the AC generator.2 The company builds neither the prime engine nor the turbine, but the copper-and-steel machine mounted behind them that converts rotational energy into electricity.
The mechanics of the generator market create a direct unit correlation. Every gas turbine, gas engine, steam turbine, hydro unit, and geothermal plant requires a generator. As Kumar observed when an analyst asked whether that ratio ever varies: "One turbine, one generator; one engine, one generator."1 Without a direct software substitute or bypass mechanism, global demand for generators tracks prime mover installation in exact lockstep.
Company snapshot. TD Power Systems designs and builds custom AC generators — ranging from roughly 1 MW up to 250 MVA in its published product lineup — alongside induction, synchronous, and traction motors, as well as specialized generators for locomotives, marine operations, oil and gas, and geothermal applications.34 Operations center primarily in Dabaspet, Karnataka, where its registered office and manufacturing plants occupy plots 27, 28, and 29 of the KIADB Industrial Area.1 By the close of FY2026, the company's installed base exceeded 8,000 generators operating across 113 countries.5 Consolidated revenue for the fiscal year ended March 31, 2026 reached ₹1,856 crore, with a net profit of ₹239 crore.3
The core thesis, and why it deserves interrogation. The standard market narrative frames TDPS as a picks-and-shovels compounder: a specialized manufacturer that weathered a decade-long slowdown in Indian industrial capital expenditure, shut down its loss-making projects division, integrated into global engine and turbine supply chains, and is now capturing demand from the artificial intelligence data center boom. While much of this thesis is supported by data, a rigorous analysis highlights three critical caveats. First, management remains reluctant to quantify its most durable competitive advantage — its long-standing original equipment manufacturer (OEM) relationships; asked directly whether TDPS was gaining wallet share, Kumar responded, "I'm not going to answer that question."1 Second, working capital expansion has outpaced revenue growth, weakening cash conversion despite a headline debt-free balance sheet. Third, the promoter group has sold shares repeatedly during the market rally, reducing its collective stake to 26.87%.3
Episode structure. The analysis traces four main arcs. First, the Japanese technology foundation and what a licensing agreement with a Tokyo-listed rail equipment manufacturer provided to a newly formed startup. Second, the projects trap — four consecutive years of operating losses that nearly ruined the business. Third, the export and data center expansion that transformed financial results between FY2019 and FY2026. Finally, the underlying governance history: a co-founder dispute, a High Court injunction, and a promoter group selling equity as operational metrics peak.
The story begins where the business took shape — with a group of engineers who left a Bengaluru factory to build a competing enterprise.
 Subscribe on LinkedIn
II. Origins & The Japanese Technology Foundation (1999–2010)
A close reading of TD Power Systems' 2011 IPO prospectus reveals a striking operational pattern. Chief Financial Officer K.G. Prabhakar, manufacturing head Manjunath S.V. (an 18-year veteran of Kirloskar Electric), head of product design S. Prabhamani (trained at IIT Delhi), product planning lead R. Vasudeva Murty (with roughly two decades at Kirloskar Electric), and production head Ramakrishna Varna all came from the same predecessor firm. Most joined TD Power Systems on June 1, 2001.6
TD Power Systems was less a start-up built from scratch than an operating team decanted from an established incumbent. An entire spine of expertise across design, manufacturing, procurement, and finance moved out of one of India's oldest electrical machinery makers into a new corporate entity. Incorporated on April 16, 1999, as TD Power Systems Private Limited in Bangalore,6 the firm operated initially out of a residential house on Margosa Road in Malleswaram before relocating to its Dabaspet industrial site on November 8, 2001.6
Leading the team was Nikhil Kumar, an engineering graduate from Karnataka Regional Engineering College, Surathkal, who completed general management studies at Harvard Business School in 1997. Kumar had managed Kirloskar Electric's Bangalore factory from 1990 to 2000,6 giving him direct sight into the operational inefficiencies of India's rotating-machines sector.
The structural opportunity Kumar identified was distinct. While state-owned BHEL dominated large utility-scale power projects, a fragmented market lay beneath it: captive plants for sugar mills and cement kilns, biomass facilities, waste-heat-recovery units, small hydro projects, and cogeneration plants. These industrial customers required custom-built generators in the single-digit to low-double-digit megawatt range, a segment underserved by legacy manufacturers.
Buying a reputation you cannot yet earn
Identifying the market gap was simpler than establishing credibility. Generators are long-life capital assets expected to run for three decades, operating inside industrial plants where a single day of unplanned downtime can exceed the cost of the machine itself. Industrial buyers rarely risked capital on unproven entrants.
To bridge this trust deficit, TDPS secured an established technical endorsement. On February 6, 2001, the company signed a Technical Assistance, License and Transfer Agreement with Toyo Denki Seizo K.K., a Japanese manufacturer founded in 1918 that specialized in electrical equipment for rail vehicles, industrial motors, and inverters.6
Such technology transfer agreements delivered far more than access to patents. Toyo Denki provided proprietary manufacturing methods: specialized winding patterns, insulation systems, thermal management designs, rotor-balancing tolerances, and quality-inspection protocols. In rotating machinery, operational longevity depends heavily on these refined manufacturing processes rather than published specifications alone.
The partnership also brought senior leadership on-site. Hitoshi Matsuo, a former general manager at Toyo Denki holding a master's degree in electrical engineering from Kanazawa University with over 44 years of experience in power plant engineering and sales, became Managing Director of TDPS on February 16, 2001.6 In August 2006, Tadao Kuwashima, a University of Tokyo engineer with 45 years of industry experience, joined the board.6 These appointments were functional rather than nominal; prospectus filings listed Matsuo as a company promoter alongside Nikhil Kumar, Mohib N. Khericha, and Saphire Finman Services.6
Financial structuring was led by Mohib N. Khericha, a merchant banker who had operated in capital markets since 1994 and served as Managing Director of Chartered Capital and Investment Limited.6 The executive division was clear: Kumar managed operations, Matsuo directed engineering quality, and Khericha structured the capital.
From one licence to a portfolio
Early commercial traction followed quickly. On July 26, 2002, TDPS dispatched its first export order—a 34 MW AC generator shipped to Thailand in the firm's third full year of operation.6 On August 27, 2002, the company supplied an 8 MW generator to Siemens Limited in Baroda.6 The Siemens delivery marked a crucial milestone: a major multinational OEM had formally qualified the young manufacturer.
Over the subsequent decade, TDPS broadened its technology base into a multi-partner portfolio. In July 2007, the company licensed technology to General Electric under a Technical Assistance Agreement and signed a Production Technology Transfer Agreement with Italy's Sicme Motori.6 Subsequent partnerships followed: a supply framework and license agreement with Siemens AG in September 2008, a product development and manufacturing agreement with Voith Hydro in May 2009, and a manufacturing agreement with Toshiba Mitsubishi-Electric Industrial Systems in March 2010.6 By 2010, the Dabaspet facility had earned ISO 9001, ISO 14001, and OHSAS 18001 certifications from TÜV SÜD, alongside CSA International compliance certification for North American markets.6
The CSA certificate represented a critical commercial gateway. Beyond technical compliance, it functioned as an essential entry permit for North American industrial facilities. TDPS was methodically building a compliance and qualification stack that would position it to serve Western equipment buyers and data center power providers fifteen years later.
By 2010, TDPS possessed an established engineering foundation, growing export sales, and long-term OEM relationships. However, it lacked the capital needed for large-scale expansion—a gap its upcoming public listing aimed to solve, leading directly into a perilous diversification strategy.
III. The 2011 IPO & The EPC Winter Trap (2011–2018)
The initial public offering opened on Wednesday, August 24, 2011, and closed on Friday, August 26. TD Power Systems issued 88,67,187 fresh shares at ₹256 apiece — with no offer for sale — raising ₹227 crore. Book-running lead manager Antique Capital Markets structured the issue. When the shares listed on the NSE and BSE on September 8, 2011, the company closed its first trading day with a market capitalization of roughly ₹915 crore.7
Management allocated the IPO capital toward core manufacturing expansion: enlarging the Dabaspet factory, constructing a corporate project office in Bengaluru, paying down existing debt, and augmenting working capital.6 Gross proceeds totaled ₹2,270 million, with issue expenses absorbing ₹139 million, leaving net proceeds of ₹2,131 million.6
However, the offering coincided with a severe industrial slowdown. In mid-2011, Indian power equipment manufacturers anticipated that Eleventh Five Year Plan targets would drive sustained capital spending. Instead, the domestic power sector experienced a broad structural reversal marked by stranded thermal assets, distribution utilities burdened by unpaid receivables, coal allocation bottlenecks, and a sharp contraction in private industrial capital expenditure.
The second business nobody talks about
The macroeconomic slowdown in Indian industrial capex accounts for only part of TD Power Systems' operational strain during this period. A more critical catalyst was the firm's internal diversification into engineering, procurement, and construction (EPC) through its subsidiary, DF Power Systems Private Limited.
Incorporated on February 7, 2007, DF Power was initially owned by Nikhil Kumar and Mohib Khericha in their personal capacities before TDPS acquired an equity stake. The subsidiary was created to execute turnkey power projects ranging from 40 MW to 150 MW capacity. DF Power received its first order for a boiler-turbine-generator (BTG) package on February 28, 2008, and built an order pipeline exceeding $100 million in cumulative BTG contracts by September 24, 2008.6
The commercial rationale for EPC expansion was straightforward: while an AC generator represented roughly 10% of a captive power plant's equipment budget, an EPC contractor bidding on the complete package — boiler, turbine, generator, and balance of plant — could capture the full project value. For industrial clients, a turnkey contract offered single-point project accountability, while TDPS stood to expand its top-line scale.
However, this model introduced fundamental structural risks. Unlike generator manufacturing — where a firm produces standardized or semi-custom machinery in a controlled factory setting with established pricing power — EPC contracting requires fixed-price commitments to assemble third-party components on external construction sites. Turnkey contracting features narrow structural margins, heavy working capital requirements, strict liquidated damages for schedule overruns, and counterparty risk concentrated among project developers vulnerable to credit cycles. By adding full-scope EPC services, TDPS tied a capital-intensive contracting business to its specialized manufacturing unit just as industrial power developers faced severe financial distress.
The numbers, and what they actually mean
The consolidated financial performance from FY2015 through FY2018 underscores the operational impact of this strategy.
Consolidated revenue contracted from ₹597 crore in FY2015 to ₹507 crore in FY2016 and ₹380 crore in FY2017, before recovering modestly to ₹435 crore in FY2018. Over these four fiscal years, operating margins dropped to 2.8%, 1.8%, 2.8%, and 2.4%, respectively. Lower operating profitability led to four consecutive years of net losses: ₹1 crore in FY2015, ₹9 crore in FY2016, ₹4 crore in FY2017, and ₹14 crore in FY2018.3
The strain extended directly to the balance sheet. Consolidated reserves declined from ₹461 crore in March 2015 to ₹385 crore by March 2019.3 Across four years, the business absorbed a ₹76 crore loss in accumulated book equity, eroding a third of the ₹227 crore raised in its 2011 public listing.
With operating margins remaining below 3%, internal cash generation was insufficient to maintain capital reinvestment. Annual depreciation ran between ₹27 crore and ₹29 crore, while net fixed assets shrank from ₹272 crore in FY2015 down to ₹198 crore by FY2019 as plant maintenance and equipment upgrades lagged.3
Operating cash flows recorded persistent deficits: negative ₹13 crore in FY2016, negative ₹20 crore in FY2017, and negative ₹3 crore in FY2018.3
While broader power sector conditions remained depressed, the primary source of financial losses — sustained negative cash flows, margin compression, and balance sheet erosion — originated from the turnkey EPC division rather than core generator manufacturing. By expanding into full-scope contracting, TDPS had linked its financial stability to troubled project developers until management reassessed its strategic focus around 2018.
IV. The Turnaround Pivot: Killing EPC & Building Export Monopolies (2018–2022)
The strategic shift did not begin with a dramatic public announcement, but through a gradual, measurable reorganization of the company's financial statements. The final accounting resolution came in FY2026, when management formally recognized the full impairment of its engineering, procurement, and construction (EPC) venture. On the year-end earnings call, Nikhil Kumar stated: "During the year, the company has provided for the investment for the value of, INR30 million from the subsidiary, DFPS. And with this, the company has provided for 100% of the investment value in its subsidiary."1
With that provision, TD Power Systems completely wrote off the remaining carrying value of its EPC subsidiary — the business originally created to capture full power plant contracts. Completing the write-down during a record financial year enabled the company to clear the legacy impairment from its balance sheet without lingering provisions or accounting ambiguity.
What replaced it
In place of turnkey contracting, TDPS pivoted from competing around global engine and turbine original equipment manufacturers (OEMs) to selling directly into their supply chains. Rather than chasing individual plant developers in spot markets, TDPS integrated its generators directly into the standard equipment packages of major OEMs.
The technical dynamics of these OEM relationships create significant commercial durability. When an engine manufacturer builds a generator set package, the generator is integrated into a unified skid — a structural frame housing the engine, generator, coupling, controls, and cooling systems. The generator's physical dimensions, shaft height, mounting geometry, torsional characteristics, and electrical performance are integral to the overall system design. Replacing an incumbent generator supplier requires re-engineering the entire package, conducting new torsional and thermal validations, and re-certifying the assembly with regulatory authorities in destination markets.
Consequently, supplier qualification cycles span several years, giving qualified incumbents a distinct operational advantage. However, this incumbency is not absolute: OEMs routinely dual-source critical components, and suppliers that fail to meet delivery schedules risk being excluded during subsequent product design refreshes.
Reading the recovery honestly
The financial recovery following FY2019 reflected a structural mix shift rather than a temporary cyclical uptick. Consolidated revenue expanded steadily from ₹459 crore in FY2019 to ₹515 crore in FY2020, ₹594 crore in FY2021, ₹797 crore in FY2022, and ₹872 crore in FY2023. Over the same period, operating margins expanded from 7% in FY2019 and FY2020 to 12% in FY2021 and FY2022, reaching 15% by FY2023.3 Net profit rose from ₹3 crore in FY2019 to ₹97 crore in FY2023.3
The margin expansion highlights the quality of the recovery. Although FY2022 revenue was roughly one-third higher than FY2015 levels, operating profit was six times greater. This margin expansion reflected the elimination of low-margin EPC revenue and its replacement with higher-margin OEM manufacturing.
The balance sheet reflected a similar strengthening. Total debt, which ranged between ₹45 crore and ₹69 crore during the downturn, was eliminated entirely in both FY2023 and FY2024.3 Operating cash flow turned positive, reaching ₹89 crore in FY2023 and ₹84 crore in FY2024, reversing the cash deficits of the prior decade.3
By the end of FY2023, TDPS had resolved its strategic misstep into EPC without equity dilution or formal debt restructuring, funding the operational pivot through internally generated cash flow.
The export foundation established during this turnaround soon intersected with an unforeseen surge in global demand.
V. The Hidden & Emerging Business: Railway Traction Motors & Industrial Motors
Within TD Power Systems' FY2026 order book disclosure lies a segment frequently overlooked in standard market overviews. Of the company's total ₹1,973 crore order book as of March 31, 2026, generators accounted for ₹1,677 crore, while the railway business represented ₹247 crore.1
This means non-power generation applications account for approximately one-eighth of the company's forward order backlog.
Why motors at all
The strategic rationale rests on asset utilization. In electromechanical engineering, a generator and an electric motor are fundamentally identical machines operating in reverse directions: a generator converts mechanical rotation into electrical current, whereas an electric motor converts current into rotational energy. Both rely on identical core assemblies — laminated steel stators, wound rotors, insulation systems, and precision bearings — and both utilize the same winding machines, varnishing lines, balancing rigs, test beds, and specialized labor force.
Consequently, an established generator manufacturer can enter motor production without constructing new facilities or incurring the substantial fixed capital expenditure that often impairs diversification returns. TDPS's product line includes induction, synchronous, and traction motors alongside its core generators, with traction motors rated up to 1,250 kW for locomotives and electric multiple units.6
This expansion also aligns with the company's foundational technology partner, Toyo Denki, whose core business focused historically on electrical equipment for rail vehicles.6 Far from being an opportunistic pivot, traction motors align closely with the core domain of TDPS's original licensor.
The proof points, and their limits
Commercial validation emerged on October 28, 2024, when TDPS announced a five-year contract with the Indian entity of a major international company to supply traction motors for the European market. The initial order totaled ₹18 crore, with deliveries scheduled to begin in April 2025, and total business over five years projected at approximately ₹300 crore.8
By FY2026, geographic reach had expanded. Asked about the railway business on the year-end earnings call, Kumar noted that the company had "nothing new to report" — a cautious statement from a management team otherwise describing its core markets as buoyant — before adding that TDPS held orders from the US, European, and Russian markets, and would supply all three alongside domestic Indian demand in the coming year.1
However, operational execution faced near-term bottlenecks. The motor segment underperformed in FY2026 due to internal capacity constraints. "The motor business remains a key focus area for us," Kumar told analysts. "However, during the year, last year, we prioritized high-volume generator opportunities, given strong export demand. We are now separating manufacturing lines, which will improve focus and execution. We expect the Motor segment to stabilize and we see improved traction going forward."1
This admission highlights a structural trade-off. The shared-asset model that renders motor production capital-efficient in theory creates operational friction in practice: when generator demand surges, motor production is displaced on shared equipment. While physically separating manufacturing lines addresses the bottleneck, it also confirms that capital synergies have operational limits, as scaling both segments requires dedicated capacity.
A second potential growth vector requires similar analytical caution. TDPS secured orders from Nuclear Power Corporation of India for induction motors, coinciding with national policy goals targeting 100 GW of nuclear capacity by 2047. Asked whether this represented a primary growth driver, Kumar offered a measured assessment: "the actual ordering and implementation is slow, and it tends to be choppy. So I can't put a number on it because the process for nuclear power plant construction is very slow... The market is large. But there is also domestic competition. There's BHEL, there's Crompton and there are also imports. So it's not like that we have a monopoly in this sector. It's competitive."1
Management's refusal to overstate prospective opportunities in high-profile sectors provides a helpful measure of reporting discipline. For investors, motors and railways currently represent roughly one-eighth of the forward order book — backed by multi-market customer qualification, yet constrained by ongoing manufacturing re-alignments — rather than an immediate secondary growth driver.
Meanwhile, the primary generator business continued to experience accelerating demand.
VI. The AI Data Center & Energy Transition Super-Cycle (2023–2026)
During the FY2026 earnings call, an analyst from Axis Mutual Fund asked whether TD Power Systems was experiencing delivery delays from turbine customers that might defer revenue recognition by a quarter or two.
Managing Director Nikhil Kumar rejected the premise:
"No. Actually, it's just the opposite of what you're saying, completely the opposite of what you're saying. It's been 180 degrees reverse. We have our turbine customers and our engine customers monitoring on twice a week basis our deliveries, and are taking the machines as soon as they're ready. So we are being very, very stringently monitored on execution. And even like a 3-day delay, 4-day delay is being severely questioned by our customer... we are not having a single machine sitting in our shop waiting for it to move to the customer on the gas side."1
This twice-weekly delivery tracking and escalation of minor schedule slips signaled a fundamental supply shift. Rather than demand constraining sales, physical manufacturing capacity became the primary operational bottleneck, positioning the generator as the critical pacing item for customer power projects.
The mechanism, in plain terms
The adoption of gas-fired generation for artificial intelligence infrastructure stems from grid timing constraints rather than fuel preference. A hyperscale AI data center consumes electricity on the scale of a small city continuously, as model training workloads cannot tolerate power intermittency. Connecting such loads to utility grids often involves multi-year transmission interconnection queues across major U.S. markets. While renewable energy paired with battery storage addresses partial loads, it cannot provide firm baseline power, and new nuclear capacity remains years away.
Gas turbines and large reciprocating gas engines bridge this gap because they can be co-located near data center campuses, ramp up quickly, run continuously, and obtain permits and construction approvals within quarters rather than years. Consequently, global prime-mover manufacturers faced sold-out order books.
Kumar outlined the addressable market on the call: "the power requirement of the data center market for U.S. alone is projected to be somewhere around 100 gigawatts in size. And the expected time frame to address installation of this capacity is going to take 5 to 7 years. And this is only the U.S. market."1 He emphasized that traditional power segments also remained active: "of course, there is the traditional power generation, there's oil and gas, there's renewables, waste-to-heat energy, there's hydro, there's geothermal... Today, of course, AI is the most exciting part of the market, but we're not ignoring other parts of the market."1
The structural argument, and its one weak joint
Kumar argued that the demand surge represents a multi-year structural expansion rather than a temporary cyclical spike, citing capacity constraints among prime-mover manufacturers:
"First of all, there are limited number of prime mover manufacturers in this business, right? And there's no possibility for new entrants in this business. So this market is now completely determined by the capacity on the prime mover side. When I say prime mover, I mean engine and turbine side. So if, let's say, there are x number of engines, then you need x number of generators."1
He added that key customers were planning substantial capacity expansions: "our turbine customers, engine customers are, on an average, planning to double capacity by 2030, some a little bit more, some a little bit less... these are huge companies, very large organizations. And once they start doing something, they don't stop."1
When an analyst noted that gas-engine manufacturer INNIO had indicated plans to triple capacity in a recent filing, Kumar confirmed the trend and highlighted a specific commercial arrangement: "We have a very specific forecast and a capacity agreement signed with INNIO, where it goes up to 2030. I'm not going to disclose those numbers with you, but it's extremely exciting for us, and we are very deeply plugged in with this customer."1
A long-term capacity commitment through 2030 provides stronger revenue visibility than standard order backlog by locking in multi-year production volumes. However, management declined to disclose specific volume commitments or clarify whether TDPS was gaining overall wallet share with key OEMs.
This opacity highlights a key analytical risk. The assumption that generator sales will track prime-mover expansion one-for-one holds only if TDPS maintains its existing market share across each OEM's vendor base. If OEMs dual-source their expanded volume to mitigate supply-chain concentration, TDPS's growth could lag the broader market expansion.
What actually showed up in the numbers
Financial results for FY2026 reflected this operational acceleration. Consolidated total income reached ₹18.78 billion, a 44% year-on-year increase, while net profit grew 36% to ₹2.36 billion. On a standalone basis, income rose 35% to ₹17.37 billion and net profit rose 42% to ₹2.18 billion, supported by an EBITDA margin of 18.14% versus 17.46% a year earlier.1
Order intake provided a clearer view of forward demand. Total order inflow for FY2026 reached ₹22.38 billion, up 51% from ₹14.78 billion in FY2025. Export and deemed-export orders led this expansion, surging 76% from ₹9.85 billion to ₹17.33 billion and making exports 79% of the year's total intake.1 Consequently, the pending order position for generators and motors grew 66% year on year.1
The divergence between order intake and recognized revenue underscores the operational landscape: while revenue reflects maximum factory throughput, order book growth indicates underlying customer demand. With order intake outpacing production capacity, manufacturing throughput—rather than order generation—became the primary determinant of top-line growth, matching the tight delivery schedules monitored by OEM customers.
VII. Segment Economics, Financial Architecture, & Proportionality
Evaluating a company's financial narrative requires examining its cash flow statement — a test TD Power Systems passes with notable qualifications.
The core manufacturing business now generates virtually all revenue and profit, as the legacy engineering, procurement, and construction (EPC) business has shrunk to a residual turnkey line of ₹29 crore — roughly 1.5% of the company's ₹1,973 crore order book.1 Return on capital employed reached 34.0% and return on equity stood at 24.7% in the most recent disclosures, compared with a ten-year average ROE of 13%.3 Borrowings totaled ₹18 crore as of March 2026 against reserves of ₹1,041 crore.3 On paper, these metrics describe a high-return business operating with minimal leverage.
The working capital problem
However, this framing overlooks a key operational constraint: working capital intensity.
In FY2026, receivable collection averaged 151 days, while inventory held for 156 days. Consequently, the cash conversion cycle — the time elapsed between paying for raw materials and receiving customer payments — stretched to 185 days.3 In effect, half a year of revenue remains continuously tied up on the balance sheet.
This lag directly impacts cash flow. In FY2026, operating profit reached ₹335 crore, but cash from operating activities totaled just ₹129 crore.3 On the year-end earnings call, Serene Alpha analyst Garvit Goyal questioned management on the low EBITDA-to-cash-flow conversion of roughly 21% and asked how cash generation would recover.
Chief Financial Officer M. N. Varalakshmi — who joined the firm on November 7, 2001, as head of financial accounting6 — characterized the cash lag as a byproduct of rapid expansion: "we are growing, so we need to build in inventories and all, and those inventories will get built during the quarter. And these are short-term size — orders, so we need to have a lot of inventories. They get converted into cash flows in the next quarter."1
Managing Director Nikhil Kumar offered a direct assessment of the balance-sheet demands: "we did INR18 billion last year. Now we are projecting INR2,400 -- sorry, INR24 billion plus... So it's taking -- all our retained earnings are basically going into working capital."1
Kumar's statement underscores a fundamental operational reality: retained earnings are currently being absorbed by working capital rather than converting into surplus cash. Over FY2025 and FY2026 combined, TDPS generated ₹169 crore in operating cash flow against cumulative net profit of ₹414 crore.3
This divergence is typical for a capital goods manufacturer growing revenue at 45% annually while producing custom-engineered machinery. However, it presents two strategic risks. First, reported return metrics are based on a capital base that is expanding rapidly; if revenue growth slows after capital is committed, returns will compress even as cash is eventually realized. Second, an extended collection cycle leaves the balance sheet vulnerable to payment defaults. When questioned about year-end balances, Varalakshmi confirmed that the approximately ₹700 crore in outstanding receivables had been fully collected.1 While this confirms asset quality, it does not alter the underlying working capital structure.
Where the money goes
Capital allocation has remained conservative. Dividend payouts were maintained at 11% of net earnings in both FY2025 and FY2026, down from mid-teens payout ratios earlier in the decade.3 This modest payout reflects the substantial cash absorbed by working capital requirements. Meanwhile, the board recommended a final dividend of ₹1.10 per share for FY2026 and approved a 1:2 stock split, subject to shareholder approval.5
Capital expenditures remain targeted. Management guided to capital spending of approximately ₹50 crore in FY2027 and a similar amount in FY2028, focused on "adding incremental capacity in certain areas, which we consider to be bottlenecks" alongside automation investments.1 With these incremental investments, Kumar stated that existing facilities could support annual revenue of ₹30 billion to ₹32 billion through FY2028.1
Supporting a revenue increase from ₹1,856 crore to ₹3,200 crore with roughly ₹100 crore in total capex illustrates the operating leverage available during a plant debottlenecking phase. However, these figures only cover existing product lines; Kumar noted that investments for larger-capacity generators "will be taken as a separate piece,"1 with capital requirements for that expansion still undisclosed.
The company has avoided mergers, acquisitions, and major expansion into unrelated verticals. Having previously absorbed four consecutive years of losses from its turnkey project division, TDPS appears committed to maintaining focus on its core manufacturing operations.
VIII. Industry Structure & Competitor Benchmarking
The competitive map of the generator industry was clearly outlined by Managing Director Nikhil Kumar during the FY2026 earnings call when asked who competes in the large-generator market.
Kumar outlined the global landscape directly: "Siemens is the global leader by far. Then you have Baker Hughes after the acquisition of Brush. They are very big in this business. These are the 2 big players on the Western side. And then you have on the Japanese side, of course, you have Mitsubishi, Fuji Electric, Toshiba. So all these players are big players, the big energy companies, yes."1
Notably absent from that list is TD Power Systems. In the large-generator segment above 50 MW, TDPS is not currently a meaningful participant. Entering that higher-capacity tier forms the strategic objective of the company's capital expenditure program.
Three different competitive games
The industry is best understood not as a single market, but as three distinct segments with differing economics and competitive dynamics.
The commodity alternator market, below roughly 1 MVA — serving standby diesel gensets and small industrial power units. Cummins Generator Technologies' Stamford brand and Nidec's Leroy-Somer dominate this segment through volume manufacturing of standardized units. Operating margins are narrow, products are catalog items, and competition centers on achieving the lowest cost per kVA. TDPS does not participate in this high-volume, low-margin segment.
The custom mid-range market, spanning roughly 3 MVA to 50 MW. This represents TDPS's core manufacturing focus, where unit customization is paramount. A generator built for a biomass facility in Thailand differs structurally in electrical characteristics, cooling systems, enclosures, regulatory certifications, and mounting footprints from one designed for a Kenyan geothermal plant or a Texas gas engine skid. Standardized mass production is structurally disadvantaged here, as the setup costs of custom runs undermine the efficiency of automated volume lines. This creates a structural counter-positioning advantage for specialized producers, as major global manufacturers are generally reluctant to disrupt high-volume lines for smaller custom orders.
The large-machine market, covering capacities above 50 MW up to 200 MW and beyond. This tier is dominated by Siemens, Baker Hughes/Brush, and Japanese industrial conglomerates. It is defined by intensive engineering, heavy machining infrastructure, and established relationships with utility-scale power developers. This is the segment TDPS is now attempting to enter.
The domestic comparison
Within India, TDPS's primary domestic peer is CG Power and Industrial Solutions, which manufactures standard industrial motors and transformers at significantly larger domestic scale. However, their strategic focus differs markedly: CG Power concentrates primarily on Indian industrial and infrastructure demand, whereas roughly 79% of TDPS's FY2026 order intake originated from exports and deemed exports.1 Competitive overlap remains limited to peripheral areas such as industrial motors and specialized nuclear power tenders, where Kumar noted competition from "BHEL... Crompton and... also imports,"1 rather than core generator supply chains.
State-owned BHEL dominates the utility-scale segment with government support and remains the primary domestic competitor for large government tenders. However, BHEL plays a minor role in global export gas-genset supply chains.
Why TDPS wins, and where it doesn't
When asked to identify the company's primary differentiators, Kumar emphasized operational execution over proprietary technological claims: "We have had long relationships with these customers and our differentiators is high quality, on-time deliveries, extremely good service network. And of course, we offer very competitive pricing. So we have built these relationships over a decade or more."1
This positioning relies on cost-adjusted reliability rather than patent moats. By combining Indian engineering and manufacturing costs with Western quality certifications over more than a decade, TDPS has embedded its generators directly into major OEM equipment packages.
However, the company faces clear structural constraints. Because TDPS produces only generators and not prime movers, it cannot bundle engines and generators like Caterpillar or Cummins, remaining a component vendor rather than a turnkey system owner. Additionally, its balance sheet remains small relative to multi-billion-dollar global incumbents, limiting its ability to provide financial performance guarantees on gigawatt-scale projects. Finally, TDPS began its expansion into larger generators relatively late in the current capital investment cycle.
Addressing the procurement lead times for large machining equipment, Kumar acknowledged supply-chain delays: "those take 15 months right now under the current environment to buy and to install, between 15 to 16 months because, as I mentioned a little bit earlier, everyone is expanding, right?... So all the machine tool manufacturers worldwide are full with orders. So we are basically coming into this capacity expansion thing on our larger generators a little bit late compared to others."1
As a result, new large-generator manufacturing capacity will not be fully operational until calendar 2027, with a meaningful operational ramp-up projected for calendar 2028, corresponding to FY2029.1 Consequently, while the large-generator expansion represents a logical strategic progression, material revenue contributions remain approximately three years away.
IX. Strategic Frameworks: Helmer's 7 Powers & Porter's 5 Forces
Frameworks offer value only when permitted to deliver uncomfortable conclusions. Applied rigorously to TD Power Systems, they yield a mixed assessment: two clear competitive advantages, one contested power, and a business model significantly stronger on supply-chain defense than on pricing leverage.
Helmer's 7 Powers
Process Power — the primary claim, and partially proven. Hamilton Helmer's concept of process power describes an operational advantage embedded within an organization's internal execution that competitors cannot easily replicate, even with complete visibility. A quarter-century accumulation of specialized winding techniques, insulation design, rotor balancing, and thermal management within a single plant represents a credible candidate. The supporting evidence is indirect but tangible: TDPS passed qualification with Siemens, GE, Voith, and Toshiba Mitsubishi-Electric during a period when it had virtually no established track record,6 retaining those partner relationships two decades later. However, FY2026 operational disclosures reveal a caveat: management cited high factory utilization as its primary operational risk, reflecting that process strength operating near full capacity lacks operational flexibility.
Switching Costs — real and the most durable of the three. As established in the analysis of OEM skid integration, switching costs represent the company's most durable advantage. Commercial evidence from FY2026 underscores this dynamic through a signed long-term capacity agreement with INNIO extending through 20301 — a structure where an OEM customer explicitly commits to future manufacturing volume.
Counter-Positioning — moderate, and structurally sound. TDPS occupies a specialized mid-range segment that major global manufacturers cannot address without impairing their own manufacturing economics. This dynamic constitutes genuine counter-positioning rather than simple niche targeting because incumbent reluctance is economically rational: larger producers choose not to enter custom mid-range manufacturing because doing so would disrupt high-volume standardized production lines. This strategic asymmetry remains stable as long as TDPS avoids competing directly in standardized, high-volume alternators.
Scale Economies — absent. Generating ₹1,856 crore in annual revenue alongside Siemens Energy's global footprint leaves TDPS as a modest market player. The company's cost structure derives from geographic location and specialized manufacturing focus rather than scale economies.
Cornered Resource, Branding, Network Economies — not present. The company claims no proprietary technology moats, commands no brand pull among end users who purchase complete generator sets rather than standalone alternators, and exhibits no network effects. Rigorous analysis excludes these three powers from the investment thesis.
Porter's Five Forces
Bargaining power of buyers — high, and the binding constraint on margins. Buyer power represents the primary structural limit on profitability, a reality highlighted during an exchange with Nepean Capital analyst Aditya Trivedi regarding whether price increases by gas turbine OEMs enable TDPS to raise its own prices and expand margins.
Kumar offered an explicit assessment of the company's pricing limits: "it's difficult for us to get better pricing than what we currently have, Aditya. We have decent pricing. We have currency tailwinds. We have price variation clauses for raw material variations. So we are not going to make the same kind of money that the turbine guys make. That's clear."1
This response reflects a clear operational reality during a record financial year: TDPS lacks pricing power. Economic value in the current cycle accrues primarily to prime-mover OEMs, while TDPS secures volume and stable operating margins rather than expanding pricing power.
Bargaining power of suppliers — high, mitigated but not neutralized. The raw material basket consists primarily of copper, forgings, electrical steel, mild steel, and insulating materials.1 Because copper constitutes a major input cost, price volatility directly affects manufacturing expenses. TDPS mitigates this exposure through commodity hedges and customer price-variation clauses, though Kumar highlighted the operational limits of these protections: "when there's a sudden spurt in commodity prices, like, say, in a week or 10 days, it goes up by, let's say, 10% or 15%, whatever you do is not going to be enough to protect yourselves against those spurts. So customers are not going to react by changing prices like in a week or 10 days, but you have to buy materials."1
Additionally, importing raw materials in U.S. dollars and euros while invoicing export sales in those same currencies renders rupee exchange-rate fluctuations broadly neutral.1 Management summarized the near-term outlook with appropriate qualifications: "for the next 2, 3 quarters, I don't see any major disruption to our margin guidance," noting that a 20% to 30% jump in underlying commodity costs would require guidance adjustments.1
Threat of new entrants — genuinely low. Entry barriers remain high due to strict certification stacks, such as the CSA compliance TDPS secured in 2010,6 multi-year OEM qualification cycles, capital-intensive test facilities, and customer reference requirements for 30-year industrial assets. These factors collectively make greenfield entry commercially impractical.
Threat of substitutes — very low. Converting rotational mechanical energy into grid-frequency alternating current requires a synchronous machine. Variations in fuel sources, prime movers, or end-use applications do not alter this core electromechanical requirement.
Competitive rivalry — moderate. Competition remains rational in custom mid-range manufacturing where engineering customization dominates, while remaining intense in standardized alternators where TDPS does not participate. Financial discipline in FY2026 was evidenced by TDPS maintaining gross margins near its historical 33% to 34% average despite market conditions that might otherwise encourage aggressive price bidding.1
The overall structural picture reveals a well-defended manufacturing niche characterized by limited pricing power, substantial entry barriers, and earnings growth driven primarily by volume expansion and product mix rather than economic rent. This brings the focus to corporate governance and leadership execution.
X. Management Assessment, Governance, & Skeptical Investor Stress Test
On July 12, 2023, a single-judge bench of the Karnataka High Court granted an interim order restraining the chairman of TD Power Systems and several others from transferring 2.51 crore shares of the company, then valued at approximately ₹555 crore. The petition was brought by Vijay Ravindra Kirloskar, chairman of Kirloskar Electric Company, along with several KEC Welfare Trusts, seeking to restrain the holders from selling those shares in the open market. The respondents were given one week to file objections.9
Understanding why this dispute matters requires returning to the 2011 IPO prospectus. In the shareholding disclosures covering the two years prior to filing, one entry notes: "Rajaram Rao (Trustee for Kirloskar Electric Executives & Other officers Welfare Trust) — 509,901 shares — 8.03%" of pre-issue equity.6
The Kirloskar Electric welfare trusts were substantial shareholders in TD Power Systems from its founding. The company that Nikhil Kumar and most of his senior team departed in 2000 and 2001 was not merely their former employer; its welfare trusts owned a significant stake in the venture they established. Media coverage of the 2023 litigation reported Kirloskar's claim of having founded TDPS in 1999.9 The company's reported position has been that the shareholders' agreement in question involved only Nikhil Kumar, Mohib Khericha, and the company — that Vijay Kirloskar was not a party to it — and that the agreement was formally terminated on January 6, 2011.
The disclosure question
Whatever the ownership merits, one narrow factual point can be verified directly from the primary document. Page 133 of the 2011 prospectus, under the heading "Shareholders Agreement," states in full: "Our Company has not entered into any shareholders agreement."6
The proxy advisory firm InGovern subsequently raised this and related concerns. Ahead of the company's August 9, 2023 annual general meeting, InGovern questioned what it characterized as the rapid selling of major promoter stakes — approximately 3.78 crore shares, or 24.21% of outstanding equity, for roughly ₹800 crore in open-market and block transactions around June 30, 2023. InGovern called for full disclosure of the Kirloskar dispute, noted that the Directors' Report omitted mention of the pending breach-of-trust complaint, and recommended an independent forensic audit of the company's affairs and board conduct.10
An investor must evaluate two distinct dimensions here. The underlying ownership dispute remains contested private litigation, and nothing in the public record establishes legal wrongdoing. However, the prospectus statement exists, the terminated agreement existed, and the company's defense rests on the argument that the two are reconcilable because the agreement had lapsed prior to filing. Whether that explanation is sufficient remains a point of debate. What is clear is that the matter represents an unresolved legal and reputational overhang for a company whose equity valuation has expanded significantly.
The promoter exit
Promoter selling continued into 2025. In May 2025, three promoter entities and one public shareholder sold a combined 7.4% stake — roughly 1.15 crore shares — for ₹530.44 crore. Nikhil Kumar sold 45 lakh shares, Saphire Finman Services sold 33 lakh shares, and Hitoshi Matsuo sold 21 lakh shares, representing a combined 6.33% stake. Public shareholder Lavanya Sankaran sold 16 lakh shares. Sale prices ranged from ₹460.09 to ₹463.28 per share, reducing promoter holding from 33.22% to 26.89%. Institutional buyers absorbing the placement included the Goldman Sachs India Equity Portfolio and Blend Fund 2.11
By June 2026, promoters held 26.87% of the equity, foreign institutions held 26.18%, domestic institutions held 23.88%, and public shareholders held 23.07%. Over a three-year period, promoter ownership declined by 31.6 percentage points.3
A favorable interpretation rests on demographic factors: the primary promoters are individuals in their sixties and seventies who built the enterprise over twenty-five years from average acquisition costs of ₹11.30 per share for Nikhil Kumar, ₹13.37 for Hitoshi Matsuo, and ₹3.68 for Saphire Finman.6 Orderly estate planning and asset diversification after a quarter-century represent standard corporate practices, and large-scale absorption by institutional investors indicates market appetite.
The skeptical interpretation is equally clear. The insiders possessing the deepest operational visibility into cycle durability have been persistent net sellers during a peak demand period. Beyond the signaling effect, governance dynamics have shifted: at 26.87%, the promoter group no longer retains majority control under standard voting thresholds, while combined institutional ownership exceeds 50%.
The credibility ledger
Alongside governance questions, management's operational execution warrants analysis, as longitudinal execution provides a clearer baseline than isolated disclosures.
Consider the guidance history. On the FY2025 earnings call in May 2025, management projected FY2026 revenue of ₹1,500 crore (₹15 billion), order inflows between ₹1,600 crore and ₹1,700 crore, and EBITDA margins between 18% and 18.25%.12 By the third-quarter call in January 2026, management raised FY2026 revenue guidance to ₹1,800 crore and introduced an FY2027 target of ₹2,200 crore.13 By the full-year FY2026 call, actual standalone income reached ₹1,737 crore (₹17.37 billion), order inflow reached ₹2,238 crore (₹22.38 billion), and EBITDA margins landed at 18.14%. Management subsequently raised FY2027 revenue guidance to more than ₹2,400 crore, with Kumar noting "an extremely high probability to increase our guidance further."1
This pattern reflects conservative targets followed by upward revisions and actual delivery. Order inflows exceeded initial guidance by roughly one-third, while margins remained within target ranges despite unbudgeted transit penalties.
An operational disruption in Turkey provides a test of reporting transparency. A shipment of components from India to Turkey was delayed for six weeks, triggering liquidated damages that reduced gross contribution by approximately three percentage points against the 33% to 34% historical baseline. Kumar disclosed the issue voluntarily in prepared remarks, detailed the contractual mechanism, noted that "the customer also was exceptionally brutal with us," and outlined a structural resolution: "We don't have this kind of shipping in our scope in the future."1
The prompt disclosure and specific operational fix contrast with standard macroeconomic explanations. The minor qualification is that characterizing customer enforcement as brutal shifts focus from the underlying delay, which originated on the supplier's side of the contract.
Two additional management practices affect analytical visibility. Kumar repeatedly declined to disclose specific figures regarding vendor wallet share, large-generator anchor accounts, copper input proportions, or the exact revenue split between gas turbines and gas engines. He informed analysts that the company withheld the sub-segment split because "we do not want to give explanations every quarter as to why something we did more or something we did less."1 While commercially defensible regarding competitive intelligence, this policy limits independent verification of segment-level trends.
Finally, management succession has entered a transition phase. Addressing the hiring of a chief executive officer — the first in the company's history — Kumar introduced Deepak, formerly of L&T Mitsubishi's Gujarat large-generator unit and GE. Kumar designated him as "number two in the company," overseeing operational activities, and described the move as part of a structural transition: "TDPS is definitely moving towards professionalizing its management... increasingly, we will see more professionals coming in... It's going to become a professionally managed organization in the future."1
For a founder-led business where founding partners have reduced their equity stakes, establishing an independent management structure is necessary for long-term continuity, though implementation has begun relatively late in the company's lifecycle.
XI. Material Risk Radar & 3 Essential KPIs
Asked directly on the FY2026 earnings call what risks worried him most, Managing Director Nikhil Kumar did not cite macroeconomic volatility. He pointed to the factory floor:
"We are under tremendous execution pressure at the moment. So the factory is running very full. And this kind of very high capacity utilization always presents the risk that if there are breakdowns in any of the production equipment, then you would have production delays... high factory utilization is always a high-pressure event for everybody. And that's where we are, and that's where we will continue to be. We don't see the situation changing for us at all. So this is a new normal for us."1
That concrete response reorders how investors should evaluate near-term risk. The primary threat facing the firm is not a deficit of customer orders, but an unplanned machinery disruption.
The risks that matter
Execution and single-site concentration. Nearly all manufacturing operates out of the Dabaspet industrial facility. OEM customers monitor deliveries twice weekly and escalate three-day schedule slips. Equipment failures, labor disruptions, or regional infrastructure failures would convert directly into delayed shipments, contractual penalties, and reputational damage with OEMs whose own customer relationships depend on schedule certainty. The transit penalty in Turkey offered a clear example of how quickly logistical delays compress operating margins.
Demand concentration in a single macro theme. Demand for gas turbine and gas engine generators depends on a specific thesis: that artificial intelligence infrastructure expansion continues at projected rates while utility grid interconnection delays make on-site natural gas generation the primary bridge power solution. Either assumption could shift. Faster transmission approvals, an AI capital expenditure digestion period, or accelerated adoption of nuclear and grid-scale storage would slow order intake—with a multi-quarter lag given the current order backlog, but not indefinitely. Diversification provides partial protection: steam turbine generators for captive industrial power, biomass, and waste-heat recovery represent roughly 25% of turnover and grow at 10% to 12% annually,1 while the small-hydro segment is experiencing strong order momentum.1
Input cost pass-through lag. Although customer price-variation clauses and commodity hedges protect gross margins across multi-quarter manufacturing cycles, management acknowledged that sudden commodity price spikes can temporarily outrun pass-through mechanisms.
Capital intensity of the large-generator bet. The program to compete in generators above 50 MW requires heavy rotor-machining infrastructure. Sized separately from the baseline ₹50 crore annual capital expenditure budget, the project cost remained undisclosed as of the FY2026 year-end disclosures. Machine tool procurement requires 15 to 16 months, positioning capacity completion in calendar 2027 and material revenue contribution in calendar 2028.1 Consequently, capital allocation will fund an unquantified investment against an unquantified revenue opportunity in a market segment dominated by Siemens, Baker Hughes, and Japanese conglomerates.
Governance overhang. The Kirloskar Electric trust litigation and the proxy advisory concerns raised by InGovern remain unresolved matters of public record.
Currency and geopolitics. With exports and deemed exports generating roughly four-fifths of order intake, international trade conditions affect operations. However, natural hedging from dollar- and euro-denominated raw material imports partially offsets foreign exchange transaction risk.1
The three KPIs that actually matter
Evaluating the business model long-term requires tracking three specific metrics.
1. Export order inflow. Order intake offers a real-time signal of forward demand, whereas recognized revenue reflects prior orders constrained by plant capacity. In FY2026, export and deemed-export order inflow reached ₹17.33 billion (₹1,733 crore), representing 79% of total intake.1 This metric tests whether prime-mover OEMs are expanding production as projected and whether TD Power Systems maintains its vendor position. Because management withholds wallet-share metrics, export order inflow serves as the primary proxy for market share trends.
2. Cash conversion: operating cash flow against operating profit. In FY2026, the company generated ₹129 crore in operating cash flow against ₹335 crore in operating profit.3 Management attributes this lag to inventory build driven by revenue growth. If that explanation holds, cash conversion should improve as top-line growth stabilizes. Conversely, persistent cash flow lag during periods of moderate revenue growth would indicate structural working capital absorption, signaling that reported return on capital metrics overstate economic performance.
3. Gross contribution margin against the 33% to 34% historical baseline. Management explicitly acknowledges a lack of pricing power and expects gross margins to track historical averages.1 Gross contribution margin therefore offers a clear measure of whether hedging strategies and price-variation clauses successfully absorb raw material inflation. Sustained movements below the historical range would signal uncompensated input cost increases or rising competitive pressure, whereas sustained movement above the range would indicate pricing power that management has not claimed.
These three metrics, published quarterly, provide a framework for evaluating the company's operational trajectory against its narrative claims.
XII. Playbook & The Bull vs. Bear Case
Twenty-five years after a group of engineers left a Bengaluru factory to build a competing enterprise, TD Power Systems has arrived at an operational footprint none of its founders could have plotted in 2001: supplying generators into American AI data centers, European rail networks, and a SpaceX project from an industrial estate on the edge of Bengaluru Rural District.
What the story teaches
Subtraction beats addition. The single most valuable act of capital allocation in the company's history was not an investment, but the decision to stop — winding down the turnkey projects business, absorbing the write-down, and returning to core generator manufacturing. Four years of net losses bought that lesson, and the FY2026 completion of the DF Power provision closed the book on it.1 Adjacencies that share a customer base without sharing an economic model represent a direct route for a specialized manufacturer to become a loss-making contractor.
Component suppliers inherit their customers' cycles in both directions. TDPS did not predict the artificial intelligence expansion. Its structural advantage lay in being pre-qualified with gas engine and turbine OEMs when those OEMs' order books expanded. That is the underlying logic of picks-and-shovels manufacturing: an supplier does not need to forecast the rush, but must be the qualified incumbent when demand accelerates. The corollary is equally clear: when customer volume doubles, supplier volume can double, but component suppliers lack the pricing leverage to extract higher unit margins on that volume.
Balance sheet conservatism serves as a strategic asset in cyclical capital goods. TDPS entered the industry upturn debt-free. That financial structure allowed a ₹50 crore capital expenditure program to be funded from internal cash flow and enabled the business to absorb substantial working capital expansion without equity dilution. Manufacturers that navigate downturns with intact balance sheets capture disproportionate volume during recovery phases.
The bull case
The demand thesis rests on a physical requirement rather than market sentiment: every prime mover requires exactly one generator, prime mover manufacturers are targeting a doubling of capacity by 2030, and high barriers to entry limit new competition at both levels.1 Furthermore, TDPS holds a signed long-term capacity commitment agreement with at least one major gas engine OEM extending through 2030.
Operational metrics confirm this acceleration. Order inflow expanded 51% in FY2026, export and deemed-export intake rose 76%, the pending generator and motor order book grew 66%, and management raised revenue guidance across consecutive earnings calls.1 Return metrics remain elevated — 34.0% ROCE and 24.7% ROE3 — the balance sheet carries minimal debt, and reaching ₹3,200 crore in revenue by FY2028 requires approximately ₹100 crore in total capital expenditure.1 Beyond core mid-range manufacturing sits the large-generator program targeting a market served by five global incumbents, alongside traction motor supply across four geographic markets and an expanding hydro refurbishment cycle.
Management has delivered on conservative guidance across three consecutive results cycles, disclosed an operational shipping delay in Turkey unprompted alongside a structural contractual resolution, and initiated a transition toward a professional management structure.
The bear case
The primary constraint remains a lack of pricing power. Economic rent in the current cycle is captured primarily by prime-mover OEMs. TDPS operates as a volume beneficiary with stable margins, and maintaining historical margins at peak volume levels represents a vulnerable foundation for a stock trading at a price-to-earnings multiple in the eighties and roughly eighteen times book value.3
Cash generation remains constrained relative to reported net earnings. A 185-day cash conversion cycle and a 21% EBITDA-to-operating-cash-flow conversion ratio indicate that earnings compounding is concentrated in inventory and accounts receivable. As management acknowledged, retained earnings are being fully absorbed by working capital requirements.1
Demand remains concentrated in a single macroeconomic theme, while the OEM relationships underpinning the company's competitive position remain unquantified due to explicit management reporting choices. When asked directly whether TDPS was gaining overall vendor wallet share, management declined to answer.1
The large-generator expansion is late relative to the broader capital investment cycle, carries an unquantified project cost, will not contribute material revenue before FY2029, and targets a market segment where management explicitly acknowledges the company is not currently a listed peer among global incumbents.1
Finally, governance overhangs persist. Promoter equity holding has declined from a majority position to 26.87% through repeated share sales during a market rally.3 Private litigation regarding the founding shareholding remains pending before the Karnataka High Court,9 while a proxy advisory firm publicly called for an independent forensic audit of board conduct ahead of the 2023 annual general meeting.10 While these matters represent unproven claims, they remain unresolved.
The synthesis
The analytical core of TD Power Systems rests on the reality that the bull and bear arguments do not represent contradictory readings of the same evidence, but rather describe simultaneously existing operational facts.
The core manufacturing business is established. The switching costs embedded in OEM skid integration are real. Customer demand is physically tied to prime-mover installations and contracted years forward with key OEMs. The recovery from four consecutive years of losses to a 34.0% ROCE was accomplished without equity dilution.
At the same time, the company lacks pricing power, converts operating profit into cash at a low rate, depends heavily on an external data center buildout theme, is overseen by a promoter group that has reduced its ownership stake, and carries unresolved legal disputes regarding its incorporation context.
Evaluating the company requires tracking three specific quarterly metrics to test these competing dynamics: export order inflow, cash conversion efficiency relative to operating profit, and gross contribution margin against the 33% to 34% historical baseline. Export order inflow indicates whether underlying demand and vendor share remain intact. Cash conversion confirms whether top-line expansion is generating liquid cash or absorbing working capital. Gross contribution margin reveals whether input cost inflation or price competition is eroding unit profitability.
While market themes, customer references, and global installations provide essential context, those three reported metrics will determine the company's financial trajectory.
References
-
Transcript of Earnings Conference Call, Q4 & FY26 (quarter and year ended March 31, 2026) — TD Power Systems Limited / NSE, 2026-05-19 ↩↩↩↩↩↩↩↩↩↩↩↩↩↩↩↩↩↩↩↩↩↩↩↩↩↩↩↩↩↩↩↩↩↩↩↩↩↩↩↩↩↩↩↩↩↩↩↩↩↩↩↩↩↩↩↩
-
TD Power Systems Stock Quote & Disclosures — National Stock Exchange of India (NSE), 2026-08-01 ↩
-
TD Power Systems Financial Profile & Financial Statements — Screener.in, 2026-08-07 ↩↩↩↩↩↩↩↩↩↩↩↩↩↩↩↩↩↩↩↩↩↩
-
TD Power Systems Limited Investor Relations Portal — TDPS, 2026-03-31 ↩
-
TD Power Systems Limited (533553) Q4 25/26 Earnings Summary — Quartr, 2026-05-15 ↩↩
-
TD Power Systems Limited — Prospectus — Securities and Exchange Board of India (SEBI), 2011-09 ↩↩↩↩↩↩↩↩↩↩↩↩↩↩↩↩↩↩↩↩↩↩↩↩↩
-
TD Power Systems IPO Date, Price, Details — Chittorgarh, 2011-09-08 ↩
-
TD Power shares rise 4% following traction motor supply deal for Europe — Construction World, 2024-10-28 ↩
-
Karnataka HC stays transfer of 2.51 cr shares of TD Power System Ltd — Zee Business, 2023-07-14 ↩↩↩
-
InGovern Research brings up governance concerns at TD Power Systems — Board Stewardship, 2023-08-07 ↩↩
-
Four Entities Sell 7.4% Stake in TD Power Systems for Rs 530 Crore Through Open Market Transactions — Goodreturns, 2025-05-22 ↩
-
TD Power Systems Limited (533553) Q4 24/25 Earnings Summary — Quartr, 2025-05-13 ↩
-
TD Power Systems Limited (533553) Q3 25/26 Earnings Summary — Quartr, 2026-01-29 ↩
 LinkedIn
 WhatsApp
 Reddit
 Hacker News
 Email
Email Kindle
 RSS Feed
 Spotify
 Apple Podcasts
 Amazon Music
 Audible
 YouTube