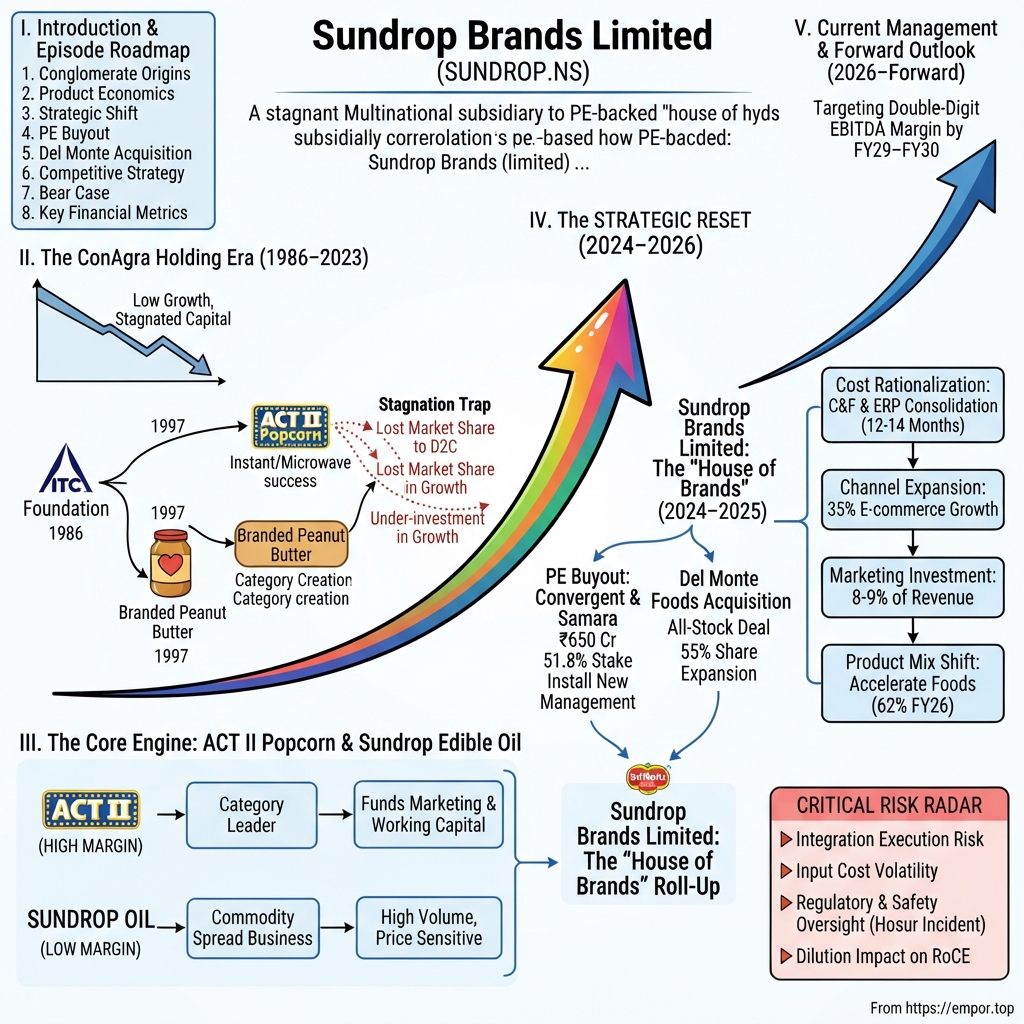
Sundrop Brands: The PE-Backed FMCG Turnaround and the "House of Brands" Roll-Up
I. Introduction & Episode Roadmap
There is a distinct category of Indian listed company that value investors have monitored for decades but rarely bought: the multinational subsidiary that owns a well-known consumer brand, trades with reliable exchange liquidity, and yet fails to compound capital. The brand commands kirana shelf space, but the business fails to generate matching operating margins. The parent company in Chicago, Zurich, or Rotterdam remains professional yet passive, neither starving the subsidiary of capital nor demanding aggressive growth. Years pass, and the stock stagnates.
For nearly twenty-seven years, Agro Tech Foods Limited served as a classic example. The company marketed ACT II popcorn, which built a dominant position on Indian instant-popcorn shelves. It sold Sundrop refined sunflower oil, positioning the brand around heart health for Indian households. It also introduced branded peanut butter to a market where the product was largely unfamiliar. Yet after a quarter-century, its total revenue remained at a level a fast-growing direct-to-consumer snack brand could match in a fraction of the time.
In early 2024, Conagra Brands agreed to sell its 51.8% controlling stake to funds advised by Indian private equity firms Convergent Finance and Samara Capital for roughly ₹650 crore, valuing the control block at ₹515 per share.12 Rather than pursuing a gradual operational improvement, the new sponsors executed a structural reset: an all-stock acquisition of Del Monte Foods Private Limited from Bharti Enterprises and Del Monte Pacific valued at over ₹1,300 crore, expanding the share count by roughly 55%, installing a new management team, and changing the ticker name.34
Today, the company trades on the NSE under the ticker SUNDROP and on the BSE under scrip code 500215.56 In fiscal year 2026, consolidated total income rose to ₹1,552 crore from ₹901 crore in the prior year — a step change driven primarily by consolidating the acquired Del Monte business rather than by organic top-line acceleration.7 Reported operating margin for FY26 stood at approximately 3.8%, with return on capital employed at roughly 2%.8 Management has targeted a double-digit EBITDA margin by FY29–FY30.79
The central question for investors is straightforward: does altering the ownership, corporate identity, and product portfolio fundamentally improve the economics of this business, or does it merely combine two underperforming assets?
The analysis follows a clear narrative arc. First, it examines the company's origins as an ITC-founded edible oil venture, Conagra's multi-decade stewardship, and the structural causes of its historical stagnation. Second, it breaks down product economics across the high-margin packaged foods segment (ACT II) and the low-margin edible oils business. Third, it evaluates past management commitments regarding a strategic shift toward foods against actual execution records. Fourth, it analyzes the private equity buyout and Del Monte acquisition through a capital allocation lens. Fifth, it assesses the new leadership team, incentive structures, and recent earnings commentary. Sixth, it applies competitive strategy frameworks, including 7 Powers and Porter's Five Forces. Seventh, it outlines the activist bear case. Finally, it highlights the key financial metrics that will determine the turnaround's ultimate outcome.
 Subscribe on LinkedIn
II. The Conglomerate Origins & The ConAgra Holding Era (1986–2023)
In the mid-1980s, India's edible oil market was overwhelmingly unbranded, ladled loose from steel drums into customer-supplied containers. Adulteration was widespread, and provenance relied entirely on trust in the local shopkeeper. Into that environment, ITC Limited incorporated a subsidiary in 1986 called ITC Agro Tech Limited, designed to process and distribute edible oils at national scale — a conglomerate's bet that Indian consumers would eventually pay a premium for a sealed pack with a name on it.5
That bet proved directionally sound and commercially viable. The resulting brand, Sundrop, became a prominent consumer marketing success in Indian packaged foods. Positioning the brand around health — refined sunflower oil that was light, low in saturated fat, and marketed for heart wellness — allowed ITC Agro Tech to sell a nutritional value proposition rather than an unbranded commodity. As a result, Sundrop retained a premium market perception in refined oils for decades.
Conagra buys a beachhead
In 1997, American agribusiness giant ConAgra acquired a controlling stake and renamed the company Agro Tech Foods Limited.5 The strategic logic reflected prevailing market expectations: India's middle-class consumption was expanding, packaged food penetration remained low, and acquiring an established distribution platform anchored by a leading oil brand offered an efficient entry into the market.
Conagra introduced a product line that the edible oil business alone could not generate: ACT II. Instant and microwave popcorn was virtually non-existent in India at the time. Conagra provided the product technology and branding, while Agro Tech contributed distribution capabilities to place a ₹10 sachet into hundreds of thousands of independent retail outlets. The combination created a new consumption category in urban Indian households at margins significantly higher than those of edible oils.
The company also pioneered branded peanut butter in India under the Sundrop label. This move highlighted a defining characteristic of Agro Tech Foods' historical capability: the company excelled at creating product categories, but struggled to defend them over time.
The stagnation trap
Agro Tech Foods demonstrates how strong brand recognition does not automatically translate into compounding shareholder value. Over the decade preceding its ownership change, the company recorded modest top-line expansion, moving from several hundred crore rupees to the low four-figure crore range, while return metrics steadily contracted. Financial data shows return on equity declining to low single digits from the mid-single digits a decade earlier.8
This stagnation stemmed primarily from parent-company capital allocation dynamics. For Conagra, Agro Tech Foods was a small, non-consolidated regional affiliate in a global portfolio dominated by North American frozen foods and shelf-stable meals. Incremental capital deployed in India had to compete against share buybacks and major domestic brand investments in North America, where the Indian operations represented a fraction of total revenue. Consequently, the parent company opted to hold the asset, collect modest dividends, minimize downside risk, and forego funding aggressive distribution expansion in India.
For minority shareholders, this posture resulted in structural under-investment in critical growth drivers: advertising scale, modern-trade and e-commerce trade spend, and new product launch budgets. Owning a category-leading instant popcorn brand proved insufficient for capital compounding without adequate funding to protect and expand retail shelf presence.
What the stagnation actually cost
The true impact of this period is reflected in missed compounding potential. Over the decade to FY24, Indian packaged food consumption grew at a high single-digit to low double-digit annual rate, with branded snacking expanding even faster. A business maintaining pace with its underlying categories would have roughly doubled revenues over that period. Agro Tech Foods fell short of that benchmark, ceding market share to competitors across categories it had initially pioneered.
Under-investment in consumer goods creates a compounding drag over time. Reduced marketing expenditure lowers brand salience, diminishing retailer incentives to feature products. Lower velocity degrades sales-call economics, which further constrains the budget available for brand building. Agro Tech Foods thus entered a slow feedback loop of lost momentum. The private equity buyers inherited a solvent enterprise, but one that required substantial operational intervention to reverse years of gradual market share erosion.
Crucially, Agro Tech Foods maintained a conservative balance sheet throughout this period. The company carried minimal debt, ensuring that stagnation did not turn into financial distress.8 This absence of balance-sheet pressure explains why the ownership transition took years to materialize: without solvency concerns forcing a sale, Conagra retained the option to hold the asset until a strategic portfolio decision in Chicago prompted the divestment.
This background establishes the operational baseline prior to the transaction. Evaluating the private equity turnaround plan requires examining the underlying profit pool and the contrasting margin profiles of the company's core operating segments.
III. The Core Engine: ACT II Popcorn & Sundrop Edible Oil
In small neighborhood stores across urban India, the hanging strips of sachets positioned near the counter represent some of the most valuable real estate in Indian retail. Eye-level, impulse-adjacent, and located where shoppers wait for change, this shelf space for instant popcorn has belonged primarily to ACT II for nearly two decades.
Why instant popcorn is a better business than it looks
The product is deceptively simple to explain yet surprisingly difficult to replicate. Standard microwave popcorn relies on a specific kernel varietal selected for its expansion ratio, a fat-and-flavor slurry engineered to melt evenly, and a bag lined with a susceptor layer to convert microwave energy into popping heat without scorching. In India, where most kitchens historically lacked microwaves, the company reformulated the product into an instant, ready-to-cook sachet designed specifically for a kadhai or pressure cooker.
The business economics flow directly from this formulation. The primary raw material, corn, is inexpensive. The value lies in flavor technology, brand equity, and the distribution logistics needed to place a low-ticket impulse item in hundreds of thousands of retail outlets. Historically, gross margins in the packaged foods portfolio ran far above the company average, generating the cash pool that funded advertising and working capital across the broader business. Simply put, the popcorn segment subsidizes the rest of the enterprise.
That distribution advantage is real, though frequently overstated. Establishing reach across hundreds of thousands of traditional trade outlets is difficult and capital-intensive. However, it is a shared channel rather than an exclusive moat; established consumer giants like Britannia, Parle, ITC, Haldiram's, and Balaji service the same retail network with significantly larger order sizes. Consequently, ACT II's distribution network is best understood not as an unassailable fortress, but as a functional network linked to a niche category that larger consumer companies have not prioritized for aggressive competing scale.
The other half of the P&L
By contrast, the edible oil division operates under entirely different economic realities.
Refining and packaging sunflower or palm oil is fundamentally a spread business. Operators procure globally traded agricultural commodities, refine and package them, and sell into a market dominated by low-overhead regional refiners and aggressive branded leaders such as Adani Wilmar's Fortune, Patanjali Foods, Marico's Saffola, and Cargill's Gemini. Input costs fluctuate with global agricultural cycles, freight rates, currency movements, and federal import duty policies designed to manage domestic food inflation. An unexpected shift in import duties can reprice an entire inventory within days.
Under these conditions, a premium brand positioning secures only a narrow margin cushion rather than genuine pricing power. Even an established, health-focused brand like Sundrop generates thin, single-digit operating margins in edible oils because consumer price sensitivity remains capped by competing products on the adjacent shelf.
A note on what "commoditized" really means for a brand
While it is tempting to view edible oils purely as a weak business and packaged foods as a strong one, a more analytical framework focuses on where consumer purchasing decisions occur.
In edible oils, purchasing decisions happen at the shelf through direct price comparison for high-volume, routinely bought household staples. Price sensitivity is acute because absolute rupee expenditure is significant and purchase frequency is high; a difference of ₹20 on a five-liter container heavily influences buyer behavior. Brand preference functions primarily as a tiebreaker within a tight price band rather than as a mechanism to command a structural premium.
In impulse snacking, decisions occur in seconds at low absolute price points, where price sensitivity effectively disappears. Consumers rarely comparison-shop a ₹20 popcorn sachet. This single behavioral distinction — rather than manufacturing, sourcing, or scale — accounts for the structural margin divergence between the company's two core divisions.
This distinction sets clear boundaries for what the turnaround can accomplish. Operational improvements alone cannot transform a commodity oil refiner into a high-margin snacking enterprise. The only path to structurally higher margins is shifting the revenue mix toward products where consumers do not make purchasing decisions based on price comparisons. Ultimately, every strategic lever pursued by management is designed to execute that fundamental mix shift.
What happens when you average them
This structural tension defined Agro Tech Foods' investment profile for two decades. Pairing a high-gross-margin packaged foods unit with a low-gross-margin commodity oils business of comparable scale compressed blended gross margins into the mid-to-high 20% range. Overhead costs from a national sales force, brand marketing, and corporate infrastructure sized for the entire revenue base further diluted profitability, yielding mid-single-digit EBITDA margins and a return on capital employed that consistently fell short of capital costs.
The company's FY26 segmental disclosures report Foods at approximately 62% of revenue and Staples — comprising premium oats, almonds, and Sundrop edible oils — at roughly 38%.8 While this represents a significant shift from historical ratios, the change resulted primarily from consolidating the Del Monte acquisition rather than from an organic scaling down of the commodity oil business.
This context highlights a central historical challenge: shifting the revenue mix toward higher-margin packaged foods is precisely what executive leadership had promised, in writing, for many years.
IV. Historical Falsification Pass: Decades of Stagnated "Food Pivots" & D2C Share Erosion
Every investment case for this company, under each era of ownership, has centered on a single core thesis: that the revenue mix will shift decisively toward branded packaged foods, driving consolidated EBITDA margins up from the mid-single digits into the low-to-mid teens.
That thesis must be tested against the company's historical operating record. A version of this growth narrative was promoted for over a decade under prior management, making the ultimate outcome of that strategy clear to evaluate.
The record on the promise
Between FY14 and FY24, Agro Tech Foods consistently outlined plans to grow its packaged foods portfolio faster than its edible oils business to lift structural profitability. This directional guidance recurred across successive annual reports and investor communications.10 Yet by the end of that decade, edible oils still represented a substantial share of total revenue, and consolidated profitability had failed to expand. Entering the ownership transition, operating margins remained in the low-to-mid single digits, and the reported FY26 operating margin of 3.8% alongside a return on capital employed of roughly 2% — even after consolidating acquisitions — illustrates how low that baseline remained.8
This outcome was not a strategy cut short before completion; it was a plan that ran its full decade-long course without reaching its target.
Why the product pivots did not scale
During this period, the company repeatedly introduced adjacent product lines, including snack extensions, cereal-based foods, spreads, and ready-to-eat formats. Few achieved material commercial scale. In Indian fast-moving consumer goods, category expansion requires sustained marketing expenditure, retailer trade support, and repeat consumer purchases. Agro Tech's advertising spend relative to sales lagged significantly behind the investment levels deployed by market leaders. Present management implicitly acknowledged this shortfall by targeting an increase in marketing expenditure to roughly 8% to 9% of total revenue — effectively recognizing that historical spending was insufficient to capture market share.7
This disclosure highlights a key historical bottleneck. It confirms the past constraint while signaling that a notable portion of future gross margin gains will need to be reallocated into advertising spending rather than flowing directly to operating earnings.
The peanut butter lesson
The clearest counter-evidence to the moat thesis involves peanut butter, a product line where Agro Tech initially created the market in India.
After pioneering branded peanut butter, Agro Tech saw direct-to-consumer and digital-native brands — such as Pintola, MyFitness, Alpino, and Disano — capture substantial market share in the rapidly growing fitness and protein segment between 2018 and 2024. These competitors succeeded not by out-manufacturing the incumbent, but through alternative distribution channels: influencer marketing, online marketplace listings, and quick-commerce platforms that provided rapid urban distribution without requiring an extensive traditional retail sales force.
This shift highlights a broader vulnerability for the business. The traditional trade network — built over decades and often cited as a key competitive moat — proved less protective in product categories where consumer purchasing migrated online. Quick commerce reduced what was historically a multi-year distribution build into a straightforward commercial listing process.
The calibrated verdict
The historical evidence provides a clear benchmark: across the same brand portfolio and consumer base over a ten-year period, incremental product rollouts failed to drive a self-sustaining mix shift. Furthermore, lost market share in specialized sub-segments like fitness peanut butter has not been recovered.
At the same time, this record reflects performance under a prior management team operating beneath a passive corporate parent. The data does not demonstrate that a portfolio mix shift is impossible; rather, it indicates that the company's legacy brands cannot drive that shift organically without substantial reinvestment. Small product iterations backed by low historical advertising budgets proved incapable of expanding consolidated margins.
Consequently, the strategic thesis holds only under a refined premise: a meaningful mix shift can occur only if acquired through strategic transactions and supported by a step-change in marketing and distribution investment. That is precisely the strategy the new sponsors have initiated, shifting the analytical focus to the quality and execution of their primary capital allocation choice: the acquisition of Del Monte.
V. The PE Buyout & The Del Monte Megadeal: Structuring the Turnaround (2024–2025)
In late February 2024, Conagra Brands announced a definitive agreement to divest its entire 51.8% ownership in Agro Tech Foods Limited.1 For Conagra, the exit represented portfolio rationalization — shedding a non-core international subsidiary to concentrate capital on its primary North American brands. For the Indian market, it created a rare opportunity: a controlling stake in a listed consumer goods platform with established household brands.
The buyers and the price
The acquirers were funds advised by Convergent Finance LLP — founded by Harsha Raghavan, former head of Fairfax's India private equity operations — and Samara Capital, an established India-focused private equity firm.2 The control block was priced at ₹515 per share, valuing the 51.8% stake at roughly ₹650 crore.2 Under Indian takeover regulations, the transaction triggered a mandatory open offer for an additional 26% of public equity, requiring a further financial commitment of approximately ₹360 crore.2
Two key structural implications stand out. First, paying a control premium for a business generating low-to-mid single-digit operating margins was justifiable only under an aggressive operational turnaround — this was a value-rebuilding transaction rather than a steady yield investment. Second, the transaction secured the company's continuous rights to the ACT II trademark in India following Conagra's departure. Retaining the popcorn brand was essential, as it represented the company's primary high-margin cash engine.
The Del Monte transaction
Nine months later, in November 2024, the board executed a broader strategic transformation: acquiring 100% of Del Monte Foods Private Limited — previously a joint venture between Bharti Enterprises and Del Monte Pacific Limited — in an all-stock transaction valued at over ₹1,300 crore.3[^11]
To structure the deal, the company issued up to 1,33,27,589 fully paid equity shares of ₹10 face value at ₹975.50 per share (including a ₹965.50 premium) to Del Monte Foods' existing shareholders as consideration.4 Following the transaction, Del Monte Foods became a wholly owned subsidiary, and Bharti Enterprises emerged as the second-largest shareholder with roughly 21% of the enlarged company.3
Against a pre-deal base of roughly 2.4 crore shares, issuing 1.33 crore new shares expanded the equity base by approximately 55%, diluting legacy shareholders to about two-thirds of their former ownership. Rather than a small bolt-on acquisition, this represented a merger of near-equals that substantially diluted existing equity holders.
Did they overpay?
Del Monte Foods India brought an established portfolio covering olive oils, Italian sauces, pasta, ketchup, canned fruits, and a B2B food service business supplying quick-service restaurants and hotels, backed by manufacturing operations at Hosur in Tamil Nadu.311 The brand maintained strong positions in olive oil and Italian gourmet products, but faced tougher competition in mass-market ketchup, where Nestlé's Maggi and HUL's Kissan hold dominant market shares.
Del Monte added ₹667.14 crore to FY26 revenue.9 Relative to the transaction value of over ₹1,300 crore, the business was priced at roughly two times sales. Available financial disclosures indicate that Del Monte was at best marginally profitable under prior ownership, burdened by standalone national distribution overheads relative to its revenue base.
Paying two times sales for a low-margin asset can be economically rational if the acquirer eliminates redundant sales and distribution infrastructure. The transaction logic relies primarily on cost rationalization rather than immediate top-line synergies. Management outlined concrete integration steps, targeting the consolidation of carrying-and-forwarding agent networks and migration to a single ERP platform within 12 to 14 months to yield roughly 100 basis points of efficiency.7
This strategy reflects a standard private equity playbook: acquiring an under-optimized consumer asset and integrating it into an established distribution chassis. Because consideration was paid entirely in equity, execution risk was shared directly with equity holders rather than funded through debt.
The subsequent rebrand to Sundrop Brands Limited in March 2025 formalized the corporate transition from a single-category edible oil refiner into a multi-brand platform.12
The FY25 reckoning
Before executing the turnaround, the company restructured its balance sheet. FY25 resulted in a standalone net loss of ₹110.72 crore, against which FY26's ₹20.88 crore net profit was reported as a turnaround.13 The FY25 loss reflected non-operational charges, driven by exceptional provisions against certain past legal obligations where recovery had been due to the company.10
This pattern is common during private equity control transitions. New owners write down impaired receivables and legacy claims early to reset the operational baseline. While standard accounting practice, this adjustment flatters the FY26 earnings recovery, as a significant portion of the year-over-year improvement stemmed from the absence of prior-year non-recurring charges. Consequently, progress is more accurately measured by EBITDA expansion and operating margin trajectory than by headline net profit.
The credit and balance sheet lens
A critical evaluation metric for private equity acquisitions is leverage. Agro Tech Foods maintained a modest debt burden relative to its revenue base.8 This conservative balance sheet reduces solvency risk during integration, as equity financing avoids the fixed debt service obligations that can destabilize leveraged buyouts during operational integration.
Financing the Del Monte acquisition entirely through equity preserved balance sheet flexibility, though it imposed substantial dilution on existing shareholders.4 The trade-off prioritizes financial stability over share count preservation.
The key forward indicator is whether this conservative capital structure persists. Sponsors seeking to optimize return metrics in later holding stages sometimes introduce leverage; any unexpected increase in debt without a corresponding productive use of proceeds would signal a shift in financial risk.
VI. Current Management, Incentives, & Governance Assessment
Private equity turnarounds in Indian consumer goods generally begin with a consistent operational move: replacing passive corporate leadership with an executive experienced in managing consumer brand profit-and-loss statements and aggressive retail distribution.
The operating team
In February 2025, the company appointed Nitish Bajaj as Group Managing Director.5 Bajaj brought extensive experience from major Indian consumer and household-product companies — including leadership roles at CEAT, Pidilite, Dabur, and Reckitt — where brand building, trade distribution, and retail execution are central to operations. His appointment reflects the new sponsors' diagnosis that Agro Tech's historical underperformance stemmed from distribution and marketing inertia rather than structural product flaws.
The new private equity owners exercise active governance over operational decisions. Advisers from Convergent Finance, led by Harsha Raghavan, and Samara Capital maintain direct involvement in budget planning, channel allocation, and quarterly operating performance. Following the merger, former joint-venture partners Bharti Enterprises and Del Monte Pacific aligned their financial interests through equity holdings rather than contingent earn-outs. Holding approximately 21% of the enlarged entity, Bharti became the second-largest shareholder, providing a direct incentive to ensure a successful operational integration.3
Promoter equity ownership stood at 43.90% as of June 2026.8 Because this stake sits below an absolute 50% majority, control depends on strategic alignment among major equity holders, reflecting the significant dilution resulting from the share-swap acquisition of Del Monte.
Reading the calls
Recent earnings calls provide an initial basis for evaluating management execution under the new ownership structure.
During the fourth-quarter FY26 earnings call, leadership offered detailed channel performance metrics, noting full-year growth of about 12% in institutional B2B sales and roughly 35% in e-commerce channels, along with approximately 400 basis points of year-over-year gross margin expansion in the fourth quarter.7 Management also disclosed revenue breakdowns by brand: Sundrop accounted for approximately 57% of consolidated sales, while Del Monte contributed roughly 33%. Annual top-line growth for Sundrop accelerated to 12% in FY26 from 5% in the prior year, while Del Monte grew by about 9%.7
Crucially, executive leadership established a quantifiable target framework, committing to annual consolidated margin expansion of 150 to 225 basis points.7 Expanding from an operational base of roughly 4%, this trajectory implies low double-digit operating margins by FY29 or FY30, aligning with management's stated goal of achieving double-digit EBITDA margins by FY29 and roughly 12% by FY30.914
While this guidance introduces greater transparency and accountability than existed under prior ownership, the core narrative remains structurally similar to past commitments: a promised margin expansion driven by product mix and operational efficiency. The key difference lies in specific numerical targets and an active private equity sponsor incentivized to enforce execution.
The working capital detail that tells you who is running the company
The operational transition is visible in working capital metrics reported in FY26 disclosures. Total working capital days decreased from approximately 47.4 days to 34.5 days, while accounts receivable collection periods fell from roughly 32.3 days to 25 days.8
For a business generating over ₹1,500 crore in annual revenue, reducing working capital by nearly thirteen days represents a significant one-time cash unlock achieved entirely through operational discipline—specifically, enforcing stricter distributor credit terms, accelerating cash collections, and streamlining regional depot inventories.
This balance-sheet improvement carries two main analytical implications. First, the ease with which working capital was reduced confirms that historical operations were under-managed. Second, working capital contraction is a finite, non-recurring operational adjustment. While releasing trapped cash provides immediate balance-sheet relief, it does not represent recurring operating earnings. As the turnaround progresses, market observers must distinguish between initial working-capital efficiencies and sustainable, organic profit expansion.
Governance watch items
Three operational and governance areas warrant ongoing monitoring.
First, brand ownership and licensing arrangements require scrutiny. The company's primary growth drivers, ACT II and Del Monte, rely on licensed brand assets. Royalty agreements with foreign licensors represent potential cash outflows from the public entity. Although Del Monte Pacific's equity stake aligns its interests with public shareholders, related-party licensing terms remain a critical governance check.
Second, capital discipline regarding equity issuance is essential. The acquisition of Del Monte expanded the equity base by more than 50%. While management has indicated that its immediate priority is operational integration, pursuing additional acquisitions using equity before demonstrating cost synergies from the initial deal would dilute shareholder value and increase integration risk.
Third, workplace safety standards require careful oversight during operational restructuring. On September 3, 2026, Del Monte Foods disclosed a fatal industrial accident at its Hosur manufacturing facility.15 Regulatory authorities halted operations on the pizza sauce production line under Section 40(2) of the Factories Act, 1948, pending a safety review by the Directorate of Industrial Safety and Health, while the company reported that other plant operations continued normally and that support was being provided to the victim's family.1617 Although the direct financial loss is limited, industrial safety metrics provide a vital indicator of operational health as management pursues cost-optimization targets.
Guidance consistency, tested across calls
Evaluating management credibility requires tracking whether initial operational targets are maintained over successive reporting periods. Early disclosures show consistent messaging: the target framework outlined during FY26 results — incorporating 150 to 225 basis points of annual margin expansion, marketing investments equal to 8% to 9% of sales, and a 12-to-14-month window for ERP and distribution network integration — was reiterated during first-quarter FY27 commentary.714 However, the timeline for achieving double-digit EBITDA margins has varied slightly, with management citing FY29 in certain disclosures and FY30 in others.914 While minor shifts are expected during complex integrations, any persistent delay in achieving margin milestones would indicate execution headwinds.
Furthermore, management disclosures lack a detailed breakdown explaining the specific components of target margin expansion. Without explicit attribution isolating the effects of product mix shifts, cost rationalization, and operating leverage, reported margin gains could be distorted by external factors—such as favorable commodity price movements in the edible oil segment—rather than reflecting structural operating improvements.
VII. Segment Economics & Strategic Deep Dive
In 2026, Sundrop Brands operates as three distinct economic engines sharing a single distribution chassis: ready-to-cook packaged foods, culinary products, and staple edible oils.
                             +-----------------------------------+
                             |       SUNDROP BRANDS LIMITED      |
                             |    (Post-Del Monte Structure)     |
                             +-----------------+-----------------+
                                               |
         +-------------------------------------+-------------------------------------+
         |                                     |                                     |
+--------v------------------+       +----------v-----------------+       +-----------v-----------------+
|   READY-TO-COOK / RTE     |       |    CULINARY & B2B          |       |       STAPLES               |
|      (ACT II Popcorn)     |       |    (Del Monte portfolio)   |       |   (Sundrop oils, oats,      |
|                           |       |                            |       |    almonds)                 |
+---------------------------+       +----------------------------+       +-----------------------------+
| * Highest gross margin    |       | * FY26 revenue contribution|       | * ~38% of FY26 revenue      |
|   pool in the group       |       |   of Rs 667 cr             |       |   (Staples segment)         |
| * Category leader in      |       | * Leader in olive oil and  |       | * Thin single-digit margin  |
|   instant popcorn         |       |   Italian gourmet; chall-  |       |   commodity spread business |
| * Funds group marketing   |       |   enger in mass ketchup    |       | * Brand premium, not        |
|   and working capital     |       | * Meaningful B2B/QSR base  |       |   pricing power             |
+---------------------------+       +----------------------------+       +-----------------------------+
The company's FY26 segment reporting divides operations into a Foods division accounting for approximately 62% of revenue and a Staples division representing roughly 38%.8 Compared to the historical split of nearly 50/50, this represents the revenue rebalancing that investors sought for a decade—achieved through equity-funded acquisition rather than organic growth.
The three levers, and how much each can actually do
Lever one: product mix. Every incremental rupee of packaged foods revenue yields roughly three to four times the gross margin of edible oil sales. Expanding the higher-margin foods portfolio faster than staples mechanically elevates blended gross margins without requiring price increases. This lever represents the most predictable component of the turnaround strategy. However, reducing the absolute volume of edible oil operations would impair fixed distribution cost absorption; management is consequently pursuing mix shift by accelerating foods revenue rather than curtailing the staple division.
Lever two: cost rationalization. Synergies from the Del Monte integration represent the immediate justification for the transaction. Operating two distinct corporate structures, distribution networks, warehousing systems, and enterprise resource planning (ERP) platforms across overlapping retail channels created duplicative overhead. Consolidating these operational layers provides concrete savings, for which management has established explicit targets and integration timelines.7 The primary risk centers on execution: operational transitions and software migrations in fast-moving consumer goods frequently cause temporary supply chain disruptions.
Lever three: channel expansion. Scaling premium products through e-commerce and modern trade offers higher growth rates, with company disclosures showing e-commerce revenue expanding by approximately 35% in FY26.7 However, digital channels represent an area where the legacy business previously lost market share to nimble competitors. While quick-commerce platforms accelerate urban reach for impulse snacking and specialty products, platform fees, slotting allowances, and promotional commissions can compress net channel margins.
What the numbers say so far
In the first quarter of fiscal year 2027, reported in August 2026, consolidated revenue rose approximately 15% year-over-year to ₹428.1 crore, providing the initial quarterly comparison of the fully integrated entity.18 Profitability metrics showed parallel expansion: adjusted EBITDA rose to ₹30.0 crore from ₹15.9 crore in the prior-year period, representing an operating margin of approximately 7.0% on management's presented basis, which excludes stock option expenses and non-recurring integration costs.14 Profit before tax reached ₹17.2 crore compared to ₹5.7 crore previously, while consolidated net profit stood at ₹12.13 crore, bringing basic earnings per share from continuing operations to ₹3.22 from ₹1.15.1819
These results provide two constructive signals alongside a necessary qualification. First, top-line growth of 15% indicates that revenue generation remained stable during early operational integration. Second, the year-over-year margin expansion suggests that initial cost rationalization measures are yielding intended savings.
The primary caveat involves the earnings presentation. Management's 7.0% operating margin relies on adjusted EBITDA calculations that exclude employee stock option expenses and restructuring charges. As the company works toward its long-term double-digit margin target, tracking the divergence between presented adjustments and statutory reporting will remain critical for evaluating underlying operational progress.
The quick commerce question, in plain terms
Evaluating the channel transition requires examining how unit economics differ between traditional retail distribution and quick commerce.
In traditional trade, the manufacturer sells products to regional distributors at standard trade discounts. Distributors supply independent retailers, while the manufacturer covers salesforce costs and promotional allowances. Retailers manage their own shelf space, inventory, and storefront overhead.
In quick commerce, platforms store inventory in urban dark stores and handle rapid delivery. In exchange, platforms collect merchant commissions, listing fees, placement charges, and co-funded promotional discounts. Consequently, total channel deductions per unit are typically higher than in traditional wholesale channels, though manufacturers avoid portioning physical salesforce distribution expenses to those outlets.
The economic balance depends on sales velocity and product mix. Quick commerce concentrates among higher-income urban households purchasing convenience items, aligning well with higher-margin inventory such as premium spreads, gourmet sauces, olive oil, and impulse snacks. Higher turnover rates and premium basket composition can offset elevated platform fees, though net profitability varies across product categories and price points.
While management reported e-commerce revenue growth of approximately 35% in FY26, disclosures do not detail net contribution margins relative to general trade.7 Until detailed channel-level profitability metrics are published, strong digital growth figures demonstrate consumer demand rather than definitive margin expansion.
VIII. Industry Structure, Competitive Benchmarking, 7 Powers & Porter's 5 Forces
Stripping away the turnaround narrative raises a fundamental structural question: over a multi-decade horizon, what prevents competitors from eroding this platform's economics?
7 Powers, applied honestly
Cornered Resource — qualified and contractually bound. The market position of ACT II in Indian instant popcorn represents the company's closest approximation to a durable competitive advantage. It combines category-defining brand recognition with specialized product formulation and a cost structure optimized for a ₹10 price point. However, this advantage carries a critical qualification: ACT II is a licensed brand rather than a proprietary asset. The long-term durability of this position depends on contractual terms that public shareholders cannot fully observe, making a rented resource structurally weaker than an owned one.
Scale Economies — moderate, though reinforced by acquisition. Carrying high-margin popcorn alongside high-volume edible oil increases revenue per sales call across a traditional-trade footprint, helping absorb fixed route logistics costs. Yet this advantage remains bounded. As a mid-sized consumer goods operator, the company competes against industry giants with significantly larger order drop sizes. Furthermore, past experience in peanut butter demonstrated that traditional distribution networks provide limited defense when consumer purchasing shifts to digital channels. The acquisition of Del Monte meaningfully strengthens this power by adding complementary stock-keeping units to existing logistics routes—arguably the most defensible operational rationale for the merger.
Branding — moderate and unevenly distributed. Sundrop maintains premium brand perception in refined edible oils, while Del Monte holds strong equity in olive oil and Italian gourmet categories alongside weaker standing in mass-market ketchup. ACT II commands dominant category recognition. In Hamilton Helmer's 7 Powers framework, however, branding power requires sustaining a price premium that competitors cannot erode through price competition—a condition that does not hold in commodity oils or mass ketchup.
Switching Costs and Network Economies — absent. Consumers incur no friction or switching costs when selecting alternative brands of popcorn, oil, or ketchup. The portfolio lacks structural lock-in mechanisms or network effects.
Process Power and Counter-Positioning — unproven. The company possesses no proprietary manufacturing or operational processes that competitors cannot replicate. Moreover, as an incumbent, it has historically faced counter-positioning from agile, digital-native brands rather than executing counter-positioning strategies of its own.
A candid evaluation reveals one contractually held moderate-to-strong power, one moderate scale advantage being expanded through M&A, and three powers that are absent. The company's competitive advantages are real but narrow, underscoring why operational execution and cost management matter far more here than at businesses protected by structural moats.
Benchmarking against the peer set
Comparing Sundrop Brands to the broader Indian fast-moving consumer goods sector sharpens this assessment. Leading Indian food enterprises—such as Britannia, Nestlé India, and Marico—operate with consolidated EBITDA margins in the mid-to-high teens and generate return metrics substantially above Sundrop Brands' current baseline.
Marico offers the most direct strategic parallel. It built Saffola into a premium edible oil brand and subsequently leveraged that consumer trust to expand into higher-margin packaged foods—the exact strategic playbook Sundrop Brands is attempting. However, Marico achieved its transition over decades through organic innovation, sustained brand investment, and consistent corporate ownership, rather than relying on a single transformative acquisition.
This comparison highlights both the opportunity and the challenge. While a successful transition to higher-margin foods is achievable in the Indian market, executing it within four to five years—moving from roughly 4% operating margins to low double digits—represents an ambitious trajectory. This timeline sits at the upper end of historical Indian consumer turnarounds and leaves little margin for error against potential commodity cost volatility.
Porter, and the shape of the fight
Applying Michael Porter's Five Forces framework clarifies the competitive pressures operating across the portfolio:
Competitive Rivalry is the primary external pressure, though intensity varies by segment. In instant popcorn, ACT II maintains a dominant position against gourmet brands such as 4700BC and unbranded regional competitors. In culinary products and ketchup, Del Monte acts as a challenger against established market leaders Nestlé (Maggi) and HUL (Kissan), as well as global peers like Kraft Heinz and Dr. Oetker. In edible oils, the company competes as a smaller player against scaled refiners including Adani Wilmar, Patanjali Foods, Marico, and Cargill. In spreads, direct-to-consumer brands continue to challenge legacy market share.
Supplier Power remains high and largely unmitigated in the staples segment. Global agricultural commodity prices and domestic import duty structures dictate raw material costs. Because management cannot control these macro variables, the business must rely on commodity hedging, disciplined inventory management, and selective price pass-through, which remains constrained by retail competition.
Buyer Power has strengthened as modern trade networks and quick-commerce platforms capture a growing share of urban discretionary spending. While expanding into these channels drives volume growth, these consolidated buyers exercise strong bargaining power over listing fees and promotional allowances, creating margin risk.
Threat of Substitutes represents an understated risk in impulse snacking. Indian consumer preference is heavily weighted toward traditional savory snacks, including namkeen, roasted chana, and potato chips, which compete for the same consumption occasions. Popcorn accounts for a modest share of overall snack spending; while this leaves room for category growth, it also limits the category leader's pricing power.
Threat of New Entrants varies significantly by category. Barriers to entry remain low in specialty spreads and gourmet snacks, where contract manufacturing and digital channels facilitate rapid entry. Conversely, barriers remain high in mass-market instant popcorn, where replicating a ₹10 sachet's landed cost across hundreds of thousands of retail outlets presents a substantial operational hurdle.
In summary, Sundrop Brands operates in a competitive landscape where only one product line enjoys structural protection—and that protection rests on a commercial license rather than an absolute moat. Consequently, the investment thesis cannot rely on structural defensibility alone. It depends on whether new leadership can execute operational turnarounds, capture merger synergies, and manage cost structures more effectively than legacy stewardship.
IX. The Skeptical Investor Stress Test & Current Risk Radar
An activist investor building a short case against the company would likely structure the counter-argument around five key vulnerabilities.
Slide one: acquiring a low-margin asset through equity dilution. Del Monte Foods India operated for years under Bharti Enterprises and Del Monte Pacific without establishing durable profitability at scale. Legacy shareholders saw their equity diluted by roughly a third to fund the transaction, which priced the asset at approximately two times its sales contribution.9 While bullish investors argue that Del Monte's unprofitability stemmed from redundant distribution overhead that can be eliminated through consolidation—a claim partially supported by margin progress in FY26 and Q1 FY27—that thesis remains unproven across a full operating cycle.714
Slide two: depressed return metrics on an enlarged equity base. In FY26, the company generated a return on capital employed of approximately 2% and a return on equity of roughly 1.3%.8 These figures reflect an enterprise carrying acquisition-inflated equity against modest operating earnings. Consequently, restoring return on equity requires generating substantially higher absolute net income across an expanded capital base.
Slide three: a valuation that prices in an ambitious turnaround. Trading at a price-to-earnings multiple in the high eighties at a share price near ₹653, the stock reflects expectations of substantial profit recovery.8 This elevated valuation leaves little margin for execution delays if profitability expands more slowly than the 150 to 225 basis points of annual margin expansion targeted by management.7 A turnaround priced for near-perfect execution offers limited protection against integration setbacks.
Slide four: core brand portfolio relies on external licenses. Both ACT II and Del Monte operate under trademark licensing agreements with foreign counterparties whose commercial priorities may diverge from those of Indian minority shareholders. Royalty rates, territory permissions, product category rights, and renewal terms represent ongoing strategic risks that public investors cannot directly control.
Slide five: rapid expansion into high-cost distribution channels. Management cites a 35% increase in FY26 e-commerce revenue as evidence of brand strength.7 However, quick-commerce platforms impose high listing fees, slotting allowances, and promotional charges, while controlling customer relationships. Shifting product mix toward digital channels can raise unit-level gross margins while simultaneously compressing net contribution margins after accounting for platform fees.
The live risk radar
Input cost and policy risk remains an immediate operational variable. Price fluctuations in palm oil, sunflower oil, and corn, alongside adjustments to domestic import duties, impact the staples division directly. The company's capacity to pass through higher input costs is constrained by competing refiners that may absorb cost increases to protect market share.
Integration execution risk will peak over the next several quarters. Consolidating carrying-and-forwarding agent networks and migrating to a unified ERP platform within a 12-to-14-month timeframe represents one of the most complex operational projects in the company's history.7 The primary operational risk is that cutover disruptions temporarily impair fulfillment levels, causing sales teams to lose retail shelf space that requires extended effort to recover.
Operational safety and regulatory risk materialized on September 3, 2026, following a fatal industrial accident at the Hosur manufacturing facility and a regulatory suspension of the affected production line.1516 While the direct financial loss is limited, regulatory scrutiny and potential operational adjustments highlight the ongoing need to balance cost-efficiency initiatives with strict safety controls across manufacturing plants.
Concentration risk in leadership underscores the platform's dependence on current management. Because operational turnaround relies on executing a newly introduced strategy rather than relying on a structural moat, progress is closely linked to the executive team appointed in 2025. Key leadership departures or shifts in private equity sponsor strategy would materially alter the risk profile.
Where the evidence actually leaves the case
The empirical record provides a clear distinction. Historical performance invalidates the legacy thesis that the existing product portfolio would organically drive a higher-margin mix shift. However, it does not disprove the private equity thesis—that new ownership, a rationalized cost structure, and an expanded brand platform can achieve a structural margin reset—because early quarterly results under the new structure have shown positive progress.14 At this stage, the turnaround is neither fully proven nor invalidated; it remains an early-stage transition dependent on sustained operational execution across a complete economic cycle.
X. Playbook: Key Lessons for Long-Term Investors
Stepping back from the specifics of Sundrop Brands reveals broader capital allocation and corporate strategy lessons that apply across consumer platforms.
A high-margin jewel inside a low-margin parent does not compound. Investors routinely build sum-of-the-parts cases around a hidden, high-margin segment—arguing that the popcorn business alone exceeds the entire market capitalization. That arithmetic is often mathematically accurate but commercially unhelpful, because cash generated by the crown jewel is swallowed by the surrounding lower-margin business. Consolidated return on capital determines long-term shareholder outcomes. A high-margin segment creates true value only when it is spun off or when the drag around it is resolved. For twenty-seven years, neither occurred here.
Multinational parents represent a distinct, diagnosable value trap. The pattern recurs across Indian listed subsidiaries: a global corporate parent that neither aggressively funds local growth nor divests the asset. The business is not dramatically mismanaged; it is simply operated for stability by executives for whom it is not strategically material. The investable opportunity does not exist while that dynamic persists—it emerges when the parent decides to exit, because a motivated sponsor changes the capital allocation framework overnight. Recognizing that pivot early matters more than assessing brand equity in isolation.
All-stock acquisitions require a different analytical test than cash deals. With cash transactions, the primary question is whether the purchase price is reasonable. With stock transactions, investors must ask two questions: whether the purchase price is fair and whether the acquiring company's equity currency is properly valued. Issuing high-multiple shares to acquire a low-multiple asset can create value; issuing shares simply to acquire top-line revenue without accretive EBITDA dilutes long-term equity. The test is straightforward: does consolidated return on capital rise or fall after the transaction? At Sundrop Brands, return metrics declined initially—a mechanical reality when expanding equity immediately while realizing operational synergies gradually. The investment case depends entirely on whether return metrics recover faster than the expanded equity base demands.
Creating a product category requires different capabilities than defending one. The company pioneered Indian instant popcorn and branded peanut butter. It maintained category leadership in the first while ceding substantial market share in the second. That divergence stemmed not from product quality or brand affinity, but from a failure to follow consumers into new distribution channels as purchasing behaviors shifted. Incumbency in fast-moving consumer goods is not a permanent moat—it is a continuous mandate to re-earn shelf space whenever retail distribution evolves.
Finally, treat management guidance as a falsifiable commitment, not as static news. The value of a specific, dated, quantitative target is not that it predicts the future with certainty, but that it establishes a clear claim that investors can verify over time. Vague strategic ambitions cannot be evaluated; a targeted 150 to 225 basis points of annual margin expansion can.7 Investors should favor management teams that offer concrete performance benchmarks—and rigorously track execution against them.
Myth versus reality across three key assumptions. Evaluating the platform requires separating market narratives from empirical operational evidence.
Myth: the company holds a structural monopoly. Reality: the business maintains a licensed leadership position in a niche category that major competitors have not yet prioritized at scale. Structural monopolies feature defensible economic barriers; this position relies partly on licensing agreements and partly on the reality that instant popcorn remains too small a category for giants like Britannia, ITC, or Haldiram's to deploy their distribution scale against it. If the category expands significantly, that competitive calculus will change.
Myth: the corporate rebrand signaled a strategic transformation. Reality: the name change in March 2025 was merely the public label applied to a transformation driven by the change of control and the Del Monte acquisition.12 Corporate rebrands carry minimal intrinsic value; investors must price cash flow generation rather than corporate identity. The true significance of the rebrand is narrower: it signaled management's intent to build around Sundrop as an owned master brand rather than relying indefinitely on licensed trademarks, representing a rational response to licensing dependency.
Myth: the FY26 return to profitability confirms a successful turnaround. Reality: the swing from a ₹110.72 crore net loss to a ₹20.88 crore net profit was driven primarily by the non-recurrence of prior-year exceptional charges rather than an immediate operational turnaround.1013 The genuine operational evidence for a turnaround resides in gross margin expansion and the initial EBITDA trajectory, which remains encouraging but covers a limited operating history.714 Conflating accounting recovery with operational transformation overstates what has been demonstrated so far.
A final structural lesson: the cost of holding an un-catalyzed asset. An investor who identified the company as under-managed in 2014 was analytically accurate but financially underperforming for a decade. The fundamental thesis was sound, but the catalyst was absent. Value traps rarely stem from faulty analytical models—they result from failing to account for the opportunity cost of time. The key takeaway is not to avoid turnaround situations altogether, but to recognize that investment returns depend on explicit catalysts, evaluate what events could trigger change, and size positions accordingly.
XI. Epilogue, KPIs to Watch, & Forward Outlook
As of September 2026, Sundrop Brands is roughly eighteen months into its transition as a private equity–backed, merged enterprise. The first full merged fiscal year has closed, and the initial fully comparable quarter has been reported. However, the most demanding operational phases of the integration—specifically network consolidation and enterprise resource planning (ERP) migration—remain underway. Meanwhile, a fatal plant accident in early September served as a stark reminder that operating a manufacturing enterprise involves operational risks that financial synergy models cannot capture.
The ultimate outcome of this turnaround remains open, making the company an instructive case study in capital allocation and operational execution.
What would change the assessment
Two specific operational developments will provide a clearer signal than any single quarterly earnings report.
On the constructive side, investors should look for clear evidence that the acquired Del Monte portfolio is gaining distribution velocity across the legacy Sundrop and ACT II route network at a pace the standalone entity could not achieve. That revenue synergy represents the primary commercial justification for combining the platforms; it would manifest as Del Monte top-line growth accelerating well beyond the roughly 9% recorded in FY26 while gross margins hold steady.7
On the cautionary side, any indication that margin expansion is being achieved by trimming brand investment rather than eliminating structural redundancies would undermine the thesis. Management has explicitly committed to increasing marketing expenditure toward 8% to 9% of total revenue.7 If reported margins improve while advertising intensity falls, the company would be harvesting its brand equity to meet short-term financial targets—repeating the precise pattern that drove its historical stagnation.
Three primary metrics will evaluate the trajectory of the turnaround:
First: consolidated EBITDA margin on a statutory, reported basis rather than an adjusted calculation. The turnaround thesis relies on structural profitability expansion. The company entered the transition with operating margins of roughly 4%, issued guidance targeting 150 to 225 basis points of annual expansion, and reported an adjusted 7.0% operating margin for the June 2026 quarter.7814 Investors must monitor the reported statutory figures, track any widening gap between reported results and presented adjustments, and view any failure to meet the annual margin expansion band as a material test of management execution.
Second: the revenue mix between foods and staples. In FY26, the product split reached approximately 62% Foods and 38% Staples.8 The critical analytical detail is the underlying driver of this mix shift: whether the proportion of foods is expanding due to organic and acquired volume growth, or whether edible oil revenue is simply contracting due to lower underlying agricultural commodity prices. High-margin volume growth validates the portfolio strategy, whereas commodity-driven revenue contraction merely mimics a strategic shift.
Third: return on capital employed. Generating a return on capital employed of approximately 2% in FY26 highlights the initial earnings drag imposed by an enlarged capital base.8 Because the all-stock acquisition expanded the share count by roughly 55%, return on capital employed serves as the definitive benchmark for whether acquired assets generate adequate returns. If operating margins expand while return on capital remains depressed over a two-to-three-year horizon, it would indicate that underlying capital assets—including manufacturing plants, working capital, or recognized goodwill—are failing to deliver projected returns, suggesting that the effective purchase price was unaccretive.
The foundational elements are established: recognized consumer brands, category growth potential, active ownership, and a clear cost-rationalization strategy. The central uncertainty is whether an enterprise that spent twenty-seven years failing to convert brand equity into shareholder value can be re-engineered by new sponsors into a disciplined compounding platform—within the timeline and return thresholds demanded by its expanded equity base.
Early operational results provide encouraging signals, but measured against a quarter-century of structural stagnation, the empirical evidence remains preliminary.
References
-
Conagra Brands Enters Into a Definitive Agreement to Divest its 51.8% Ownership Stake in Agro Tech Foods Limited — Conagra Brands, 2024-02-29 ↩↩
-
Funds Advised by Convergent Finance and Samara Capital to Acquire 51.8% in Agro Tech Foods from Conagra Brands — ANI News, 2024-03-01 ↩↩↩↩
-
Agro Tech Foods buys Bharti group's Del Monte Foods in Rs 1,300 cr deal — Business Standard, 2024-11-14 ↩↩↩↩↩
-
Board of Agro Tech Foods approves acquisition of 100% stake in Del Monte Foods — Business Standard, 2024-11-14 ↩↩↩
-
Sundrop Brands Q4 & FY26 Results: 10% Growth, Return to Profitability & Earnings Call Insights — ScanX, 2026 ↩↩↩↩↩↩↩↩↩↩↩↩↩↩↩↩↩↩↩↩
-
Sundrop Brands Ltd Consolidated Financials — Screener.in ↩↩↩↩↩↩↩↩↩↩↩↩↩↩
-
Sundrop Brands FY26 EBITDA Soars 96% Driven by Del Monte Integration — Whalesbook, 2026 ↩↩↩↩↩
-
Sundrop Brands Ltd Director Discussions — India Infoline ↩↩↩
-
Agro Tech Foods to acquire Del Monte Foods in Rs 1,300 crore share swap deal — Storyboard18, 2024-11-14 ↩
-
Agro Tech Foods rebrands to Sundrop Brands post Del Monte acquisition — Business Standard, 2025-03-08 ↩↩
-
Sundrop Brands FY26 Annual Report: Net Profit ₹20.88 Cr vs Loss ₹110.72 Cr YoY — ScanX, 2026 ↩↩
-
Sundrop Brands posts 15% revenue growth, maintains 7% EBITDA margin in Q1FY27 — ScanX, 2026-08 ↩↩↩↩↩↩↩↩
-
India's Sundrop Brands says employee dies in south India factory accident — Business Recorder, 2026-09 ↩↩
-
Sundrop Brands Reports Fatal Accident at Subsidiary Factory in Tamil Nadu — Whalesbook, 2026-09 ↩↩
-
Fatal accident halts one Del Monte factory line; operations continue — Earnings Pulse, 2026-09-03 ↩
-
Sundrop Brands Q1 FY27 Revenue Grows 15% to ₹428 Cr, PAT at ₹12.13 Cr — Whalesbook, 2026-08 ↩↩
-
Sundrop Brands Limited Reports Earnings Results for the First Quarter Ended June 30, 2026 — MarketScreener, 2026 ↩
 LinkedIn
 WhatsApp
 Reddit
 Hacker News
 Email
Email Kindle
 RSS Feed
 Spotify
 Apple Podcasts
 Amazon Music
 Audible
 YouTube