STEL Holdings Limited: The Portfolio Behind the Dividend
I. Introduction: A Quarter That Reversed the Year
Picture two pages of the same company's paperwork, filed only a few months apart.
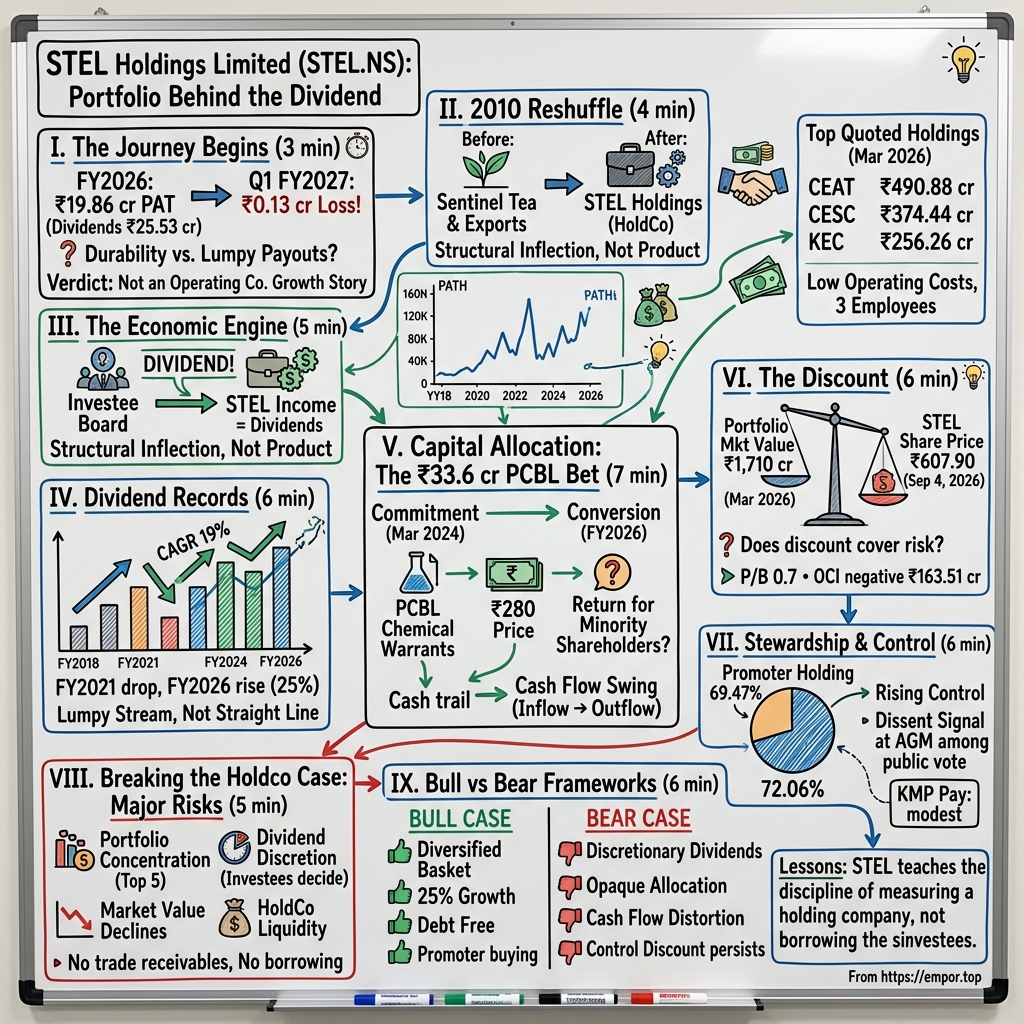
The first is an annual report for the year that ended in March 2026. It tells a cheerful story. Income was up by a quarter. Profit after tax came in at ₹19.86 crore, the best figure in the company's modern history.1 Most of that came from one line: dividends of ₹25.53 crore, money sent up to STEL by the boards of companies whose shares it owns.1
The second page is the results statement for the quarter that ended on June 30, 2026. The first three months of the new financial year. It shows a loss of ₹0.13 crore.2
A small loss, to be clear. Thirteen lakh rupees is a rounding error next to a portfolio worth well over a thousand crore. But the change in direction is the point. In a single filing cycle, a company that had just posted a record year reported that, for one quarter, it had not covered its own modest costs.
For most listed companies, a swing like that would set off a hunt for the cause. Did a customer walk away? Did raw-material costs spike? Did a factory go down? None of those questions works here, because STEL Holdings has no customers, no raw materials and no factory. It is a core investment company in the RPG group, the business family led by the Goenkas, and its job is to hold shares in group companies and collect what those companies pay out.1 It is listed on both the NSE and the BSE.1 It is not the parent that runs CEAT's tyre plants, CESC's power grid or KEC International's transmission projects. It is a shareholder in them, and that is all.
So the June quarter is not an operating miss. It is a timing signal. Indian companies usually declare and pay their dividends around their annual general meetings, and most of those meetings fall from July to September. A quarter that ends in June often sees few dividends arrive. Whether that fully explains the loss is something STEL's own disclosure does not settle, and that gap turns out to be the theme of this whole story.
Here is the question that shapes everything that follows: is STEL's profit engine a dependable stream of group dividends, or a portfolio whose reported earnings simply rise and fall with what its investees decide to pay?
Four smaller questions sit beneath it, and each gets its own section:
- How reliable are the dividends? STEL books income only when an investee's board declares a payout, and it does not say which investee paid what.
- Does STEL allocate group capital well? Its largest recent decision, a ₹33.60 crore commitment to PCBL Chemical warrants, is the clearest test.
- Why does the market price the company below the reported value of what it owns? The gap between earnings, book value and quoted portfolio value is wide, and it changes.
- Does rising promoter control serve minority shareholders? The promoter group has steadily increased its stake while public investors' voice has shrunk.
One rule of the road before starting. This story is about STEL, not about its investees. CEAT's tyre volumes, CESC's tariff orders and KEC's order book are real stories, but they belong to those companies. They matter here only when they change one of three things: the dividends STEL receives, the market value of STEL's stakes, or the capital-allocation choices STEL makes. Keeping that boundary in view is what separates analysis of a holding company from a borrowed tour of the group.
The verdict to test is simple to state. STEL's economics do not follow an operating company's growth curve. They depend on what the portfolio pays, what the holdings are worth, and how well a three-person company deploys the cash in between. To see why the company ended up in that shape, the story has to go back to a tea business and a corporate reshuffle in 2010.
 Subscribe on LinkedIn
II. The 2010 Reshuffle Turned a Tea Company into a Holding Company
The company that became STEL Holdings was born in 1991 with a name that described a very different life: Sentinel Tea and Exports.3 The name points to the hills of Kerala and the export trade, to the RPG group's plantation interests centred on Harrisons Malayalam, one of the old planting companies of south India.
For most of its first two decades, Sentinel was one piece in a web of entities around Harrisons Malayalam. Group structures like that grow up for reasons that make sense at the time: a tax treatment here, a licence there, a family arrangement somewhere else. They also tend to accumulate complexity faster than anyone tidies it up.
The tidying came in 2010. A composite scheme of arrangement reorganised Harrisons Malayalam's subsidiaries.3 Three of them merged back into Harrisons Malayalam, folding the operating plantation activity into the company that actually ran estates. Sentinel Tea and Exports went the other way. It became the listed vehicle that would hold the group's investments, and it took the name STEL Holdings.3
That is the company's defining inflection, and it is worth pausing on what kind of inflection it was. There was no new product, no breakthrough plant, no founder's leap into a fresh market. It was a structural decision taken in a boardroom: which entity keeps the tea, and which entity keeps the shares. From that point, the economic life of STEL has been the life of a portfolio.
A small reminder of the old identity still sits in the accounts. STEL owns Doon Dooars Plantations Limited, a wholly owned subsidiary described as an inactive tea-plantation company.1 It contributes so little that STEL's standalone and consolidated income and profit for FY2026 are nearly identical.1 The plantation is a vestige, not a business line.
What a holding company's history looks like
Telling an operating company's history means following revenue as it climbs. Telling STEL's history means following income and profit as clues about two other things: what the portfolio paid, and how its value was marked.
The clues do not form a smooth line.
In FY2016, STEL was already describing investments and dividends as its main source of income. Total income was about ₹9.6 crore, and the company reported a loss of about ₹4.0 crore.4 That loss did not come from operations collapsing. It followed a provision for diminution in the value of investments: an accounting admission that something it held was worth less than the books had said.4
Two years later, in FY2018, income was lower, at roughly ₹6.9 crore, but the company earned a profit of about ₹5.8 crore.5 By FY2020, income had reached about ₹16.3 crore and profit about ₹15.2 crore.6 Then FY2021, a year shaped by the pandemic's effect on corporate payouts, brought both lines back down (more on that in Section IV).7 By FY2025, income was about ₹21.9 crore and profit about ₹15.9 crore,8 before the FY2026 high described in the opening.
Why the starting point matters
There is an easy trick available to anyone who wants to make STEL look like a growth stock: measure profit growth from FY2016. Going from a loss to nearly ₹20 crore of profit produces a growth rate that is either infinite or meaningless, depending on taste. It is meaningless, because the FY2016 base was distorted by a one-off write-down.
A fairer base is FY2018, the first clean year in the sample. From there to FY2026, income grew about 19% a year and profit about 17% a year.51 Those are respectable compounding rates. But they describe portfolio returns earned along a jagged path, not the steady expansion of a business that sells more each year. The path includes a write-down year and a pandemic dip, and its latest step is a loss-making quarter.
The lesson of the reshuffle is the lens for everything after it. STEL is a container. To understand its earnings, you have to understand what goes into the container and why, and that begins with a strange question for a listed company: what, exactly, does it sell?
III. What Does STEL Actually Sell?
Somewhere in Mumbai or Kolkata, a board of directors sits around a table at the end of a financial year. The auditors have signed off. The company has earned its profits. The chair turns to the last agenda item: a recommended dividend per share. The directors approve it, and a notice goes out to the stock exchanges.
At that moment, STEL Holdings records income. It has not shipped anything. It has not signed a contract or sent an invoice. A different company's board has made a decision, and STEL, as a shareholder, is entitled to a share of it.
That scene is the whole business model, and it is worth spelling out because it inverts nearly every assumption an investor brings to a listed company.
The pricing unit is someone else's decision
In FY2026, STEL's income was about ₹27.4 crore.1 Of that, ₹25.53 crore was dividends, about 93% of the total.1 Interest on fixed deposits added roughly ₹1.1 crore, and net gains from changes in the fair value of investments added about ₹0.8 crore.1 STEL reports all of this as revenue from operations, which is accurate for a company whose operation is holding investments. In most annual reports, dividends and interest would sit under "other income", the line analysts discount as non-core. Here they are the core.
The company recognises dividends when they are declared.1 That accounting choice makes the dependency explicit. There is no minimum payout, no contract and no commitment from the investees. STEL does not disclose any.1 The "price" of STEL's product, if one insists on the term, is set each year by the payout policies of other boards, which in turn depend on how those companies performed and how much cash they want to keep for their own expansion.
That has two consequences, and they pull in opposite directions.
The good one is cost. A business whose income arrives by declaration needs very few people to collect it. STEL reported three employees at March 31, 2026.1 It bought no tangible assets during FY2026.1 The gap between income of about ₹27.4 crore and profit before tax of about ₹26.7 crore is tiny, because there is almost nothing to spend money on.1
The harder one is control. STEL can neither raise its prices nor win new customers. If an investee decides to keep its cash to fund a new plant, STEL's income falls, and there is nothing STEL's three employees can do about it in the short run.
What the basket holds
The holdings themselves are a roll-call of the RPG group's listed companies. At March 31, 2026, STEL's largest quoted positions by market value were CEAT at about ₹491 crore, CESC at about ₹374 crore, KEC International at about ₹256 crore, PCBL Chemical at about ₹99 crore and RPG Life Sciences at about ₹98 crore.1
Read that list as an investor and a shape appears. Tyres, electricity distribution, power-transmission engineering, carbon black and specialty chemicals, pharmaceuticals. It is a diversified basket of Indian industrial and utility exposure, all under the same family's control. Diversified across industries, concentrated in one group.
The top three positions together are worth more than ₹1,100 crore. Against a company that earned under ₹28 crore of income in its best year, those numbers make the point vividly: STEL's balance sheet is dozens of times larger than its annual income statement. Changes in those values swamp anything the income line can do.
What STEL does not have, and what it does not tell
For an operating company, an analyst would ask about customer concentration, unit volumes, inventory cycles and operating margins. None of these fit. STEL has no inventory, a point its auditors made explicitly in the FY2025 report.8 It has no trade receivables. It has no product margin to defend.
The right replacements are: which investees supplied the dividends, how concentrated that supply is, and whether the portfolio's cash yield holds up over time.
And here the trail goes cold for a reason that sits with the company, not the analyst. STEL does not disclose dividend income by investee in its FY2024, FY2025 or FY2026 annual reports.981 An investor can see what the company owns and what it received in total, but not which board's decision produced which rupee. It is like knowing a fruit seller's total takings and the size of each crate on the stall, without being told which fruit sold.
That missing schedule is not a footnote. It is the difference between knowing whether FY2026's ₹25.53 crore came from five steady payers or from one unusually generous year at a single investee.
Reinvestment, holding-company style
The same inversion applies to reinvestment. R&D is not disclosed in the FY2024–FY2026 reports.981 Capital expenditure on physical assets is effectively zero: FY2025 purchases of tangible assets were well under ₹1 lakh, and FY2026 purchases were nil.81
STEL's reinvestment happens in the portfolio instead. In FY2026 it bought about ₹41 crore of investments and redeemed about ₹22 crore.1 In FY2025, purchases were about ₹46 crore.8 Those flows, not machinery or patents, are the company's version of capex. Every rupee of them is a capital-allocation choice, which is why the PCBL decision later in this story carries so much weight.
So STEL sells nothing, and earns a great deal relative to its tiny cost base. The real question is whether what it earns is a stream or a series of events. The record of the past decade has a cycle hidden inside it.
IV. The Dividend Record Has a Cycle Inside It
Set two facts side by side.
In FY2026, dividend income rose about 25% and total income rose about 25.2%.1 It was the best year STEL has reported.
In the quarter that followed, the company lost money.2
The bullish reading says the first fact is the trend and the second is noise. The bearish reading says the first fact may have been a peak, and the second is an early warning. Neither reading can be settled from STEL's own disclosure, and the reason why is the most important thing to understand about its earnings.
A record with reversals left in
Look at the decade without smoothing.
FY2016 was a loss year because of a write-down.4 FY2018 was small but profitable.5 FY2020 brought a big step up.6 Then in FY2021, income fell to about ₹12.3 crore and profit to about ₹8.7 crore,7 down by roughly a quarter and nearly 43% respectively from the year before. That was the year when Covid-19 lockdowns pushed many Indian companies to conserve cash and trim payouts; STEL, sitting downstream, absorbed the effect without any operational failure of its own.
From that trough, the line rebuilt. By FY2025, income had reached about ₹21.9 crore and profit about ₹15.9 crore.8 FY2026 extended it.
The shape of the record is a staircase with a few missing steps. The long-run income compounding of about 19% a year from FY2018 is real. But it includes one year in which earnings dropped by more than two-fifths for reasons entirely outside STEL's control, and one earlier year in which the portfolio's value had to be marked down. That is the base rate an investor should carry into any forecast: good years are common, and bad years arrive without warning.
Why margin and sales tools mislead here
An investor trained on manufacturing companies might look at STEL's FY2026 profit growth and ask whether margins expanded. That question does not travel well.
STEL's "margin" is mostly a function of what share of its income is dividends rather than taxable interest or gains, and how its tax charges fall in a given year. Profit before tax in FY2026 was about ₹26.7 crore and profit after tax about ₹19.9 crore.1 The difference is tax, explained in the company's current and deferred-tax notes, not a change in operating efficiency.1 When the denominator is a basket of other boards' decisions, ratios built for factories mostly measure mix.
The same goes for sales growth. The 25% rise in FY2026 income is not evidence that STEL did anything differently. It is evidence that, in aggregate, its investees paid more. Those are separate claims, and only the second is supported.
No customer to lose, but a payer to lose
In an operating company, the scariest event is losing a big customer. STEL has no customer contracts, and no major customer loss or insolvency features in its history, because there are no customers to lose.1
The equivalent risk is a dividend cut, pause or concentration. If one of the large investees decided to suspend its payout to fund an expansion, or if a regulator restricted distributions in a particular sector, STEL's income would fall with no offsetting lever. And because the company does not disclose dividends by investee,1 an outsider cannot tell how exposed it is to any single payer. A portfolio that looks diversified on the balance sheet could, in principle, be concentrated in the income statement.
Reading the June quarter properly
That brings the story back to the loss of ₹0.13 crore.2
The tempting conclusion is that the earnings engine broke. The evidence does not support that. STEL's expenses are tiny, so a quarter in which few investees declare dividends can easily show a small loss without anything structural changing. Indian annual dividends tend to cluster around AGMs, and STEL itself held its 36th AGM in late September 2026,10 a reminder of where the corporate calendar's centre of gravity sits.
But the opposite conclusion, that the June quarter means nothing, is also too quick. The right test is to compare the same quarter across several years and see whether the pattern is a seasonal dip or a new low. A single quarter cannot answer that. And because the annual reports do not attribute dividends to investees, the quarterly series is the closest proxy an outsider has for timing.
The useful discipline is to track two things together. First, the dividend declarations of the large investees through the year, which are public in their own exchange filings. Second, STEL's quarterly income line. If investee declarations hold up and STEL's income catches up in the September and December quarters, the June loss was timing. If they do not, the FY2026 peak was a cycle top.
The verdict on this section is narrower than either camp would like. Recent growth is real. A dependable run rate is not established. Without investee-level dividend history, investors cannot distinguish broad-based payout growth from a few large declarations.
Which raises the second question. STEL does not only collect cash; it also spends it. And in March 2024, it decided to spend a great deal of it on one stake.
V. The ₹33.6 Crore PCBL Bet Tested the Mandate
The end of March is a busy time on Indian exchanges. Financial years close, boards rush through approvals, and companies line up fundraises before the books shut.
In late March 2024, PCBL, the RPG group's carbon-black maker, then known as Phillips Carbon Black and now as PCBL Chemical, announced a preferential issue of warrants worth about ₹488 crore.11 A warrant, in plain terms, is a ticket that lets the holder buy a share later at a price fixed today. The buyer pays part of the price upfront to secure the ticket and the rest when converting it into an actual share. PCBL's shares rose about 5% on the news.11
STEL was one of the buyers. It committed to 12 lakh warrants at ₹280 each, a total commitment of ₹33.60 crore.8 A quarter of the money was payable upfront, and the remaining 75% on conversion.8 STEL's shareholders approved the investment at an extraordinary general meeting on April 25, 2024.8
Put that number next to STEL's own scale. ₹33.60 crore was more than one and a half times STEL's entire income in FY2025 and more than its FY2026 income.81 For a company whose annual operating spend fits on a single line, it was the largest capital-allocation decision in years. If STEL has a mandate, this is where that mandate was tested.
The related-party boundary
PCBL is under common control with STEL, so this was a related-party transaction. That alone is not damning. In group holding companies, investing in sister companies is the job description. What matters is how the transaction was priced, approved and disclosed.
On those points, the record is orderly. STEL described the transaction as ordinary-course and on arm's-length terms, with approval by its audit committee and by shareholders.8 The issue price was set under SEBI's rules for preferential issues, which tie the price to recent trading averages.8 STEL also disclosed a valuation of PCBL's shares at ₹271.37 as of March 27, 2024.8
So STEL paid about 3.2% more than the stated fair value. That is a small premium, consistent with a formula-driven price rather than a bargain negotiated in STEL's favour. It is also worth noting what the transaction was not. It was not a royalty arrangement, a management fee or a brand payment flowing value from STEL to the group; the reports disclose none of those.81 It was a purchase of listed equity.
This is a different kind of decision from an acquisition. There are no deal multiples or synergy targets to benchmark it against. The comparison is simpler and harsher: was ₹280 a good price to pay for a PCBL share, given what STEL could have done with the money otherwise?
Following the cash
The transaction left a distinct fingerprint on STEL's cash-flow statement, and it is the single best example of why a holding company's cash flow can mislead.
At March 31, 2025, ₹25.20 crore of the warrant price was still payable.8 Because that obligation sat as a liability, STEL's reported operating cash flow in FY2025 was flattered: about ₹43.2 crore of inflow against profit of about ₹15.9 crore.8 The company had not earned the extra cash. It simply had not yet paid a bill.
In FY2026, the bill came due. STEL converted the warrants and settled the balance.1 The liability fell by about ₹25.2 crore, and operating cash flow swung to an outflow of about ₹6.0 crore, despite profit of about ₹19.9 crore.1
Across the two years, the effect roughly washes out. But anyone reading either year alone would have drawn the wrong conclusion: a cash machine in FY2025, a cash drain in FY2026. Neither was true. The swing was one investment moving from promised to paid.
The same transaction helps explain a second change. STEL's cash and fixed deposits fell from about ₹27.3 crore at March 2025 to about ₹2.4 crore a year later.81 The company did not borrow to fund the PCBL payment; it spent its liquid reserve. That leaves a debt-free balance sheet with very little cash, a point Section VI returns to.
Conversion is not a return
Here is where enthusiasm needs a brake. Converting warrants into shares does not create value. It simply completes a purchase. The value question is whether, over time, PCBL's dividends to STEL plus any eventual sale proceeds exceed the full ₹33.60 crore cost, with a reasonable return for the years of capital tied up.
STEL does not disclose that return separately.1 It also does not disclose PCBL's contribution to dividend income.1 At March 2026, the company's quoted PCBL holding was valued at about ₹99 crore,1 but that figure covers its total PCBL stake, not just the warrant-derived shares, and it is a market mark rather than realised cash.
The wider allocation record
PCBL was not the only allocation decision. In FY2026 STEL also bought about ₹41 crore of investments and redeemed about ₹22 crore.1 That is active management of a portfolio, not business expansion, and the reports do not break down what was bought or how those purchases have performed.
An honest stress test also needs the company's longest record. The FY2016 provision for diminution showed that STEL's portfolio marks can disappoint badly enough to push it into a loss.4 That is one documented episode over a decade. It does not establish a pattern of failed investments, and the reports reviewed here do not show repeated write-downs. Nor does it prove the opposite. A clean record is not the same as a demonstrated record of superior returns.
So the verdict on capital allocation stays open, in a specific way. Procedurally, the PCBL deal was transparent: approved, priced by rule, disclosed with a valuation. Economically, it is unproven. The test that would settle it is cash realised from the PCBL shares, through dividends or disposals, set against ₹33.60 crore.
Which leads to the uncomfortable fact behind every holding-company investment. Even when the underlying shares do well, the market often refuses to give full credit for them. STEL is a case study in that discount.
VI. The Discount: Portfolio Value Is Not Cash in Hand
Imagine a shareholder checking two numbers on the same evening in September 2026.
The first is STEL's share price. On September 4, 2026, it stood at about ₹608.1213 The second is STEL's reported book value per share, about ₹872 according to a June 2026 market-data page.12 The share traded at roughly 0.7 times book.12
The obvious reading is a bargain: buy ₹872 of assets for ₹608. Now add a third number. During FY2026, the market value of STEL's investments fell from about ₹1,884 crore to about ₹1,710 crore.81 The portfolio lost more than ₹170 crore of quoted value in a year when dividends hit a record.
Those three numbers together are the whole valuation puzzle in miniature. The answer depends on separating three different things that are easy to blur.
Three different numbers that measure different things
Earnings are what the portfolio paid in the year: dividends, interest and small gains. They are cash-like but discretionary.
Book value is what accounting rules say the company's equity is worth. For STEL, most investments are carried at fair value, and changes in that value flow through other comprehensive income, or OCI, a separate line that hits equity without touching reported profit. In FY2026, OCI after tax was negative about ₹164 crore.1 Profit said STEL had a great year. Equity said it had a poor one.
Quoted portfolio value is what the shares would fetch at market prices on a given day, before tax, transaction costs or the price impact of selling large blocks.
An analogy helps. Think of a landlord who owns a building. The rent is the earnings. The valuer's estimate is the book value. What a buyer would actually pay, after negotiation and stamp duty, is the exit value. Rent can rise while the building's appraised value falls, and the appraisal is not cash until someone signs.
Why the P/E looks high and the P/B looks low
The same market snapshot that put STEL at 0.7 times book showed a price-to-earnings ratio of about 56.6.12 At first glance that seems contradictory: expensive on earnings, cheap on assets.
It is not a contradiction. STEL's earnings are dividends, and dividend yields on Indian equities are low relative to their prices. A portfolio that yields a percent or two in dividends will produce a high P/E almost by definition, even if the holding company trades at a deep discount to the portfolio. The P/E tells you the market is not paying for dividend income. The P/B tells you the market is not paying full price for the assets either.
Note the dates, because they matter. The share price and multiples are from September 4, 2026; the book value is a June 2026 figure; the portfolio's market value is a March 2026 figure.121 Group share prices have moved in between. Without a single-date bridge, any precise discount figure is an approximation, not a measurement.
Liquidity at the holding-company level
The cash depletion described in Section V changes how to think about STEL's liquidity.81 A conventional company converts operating profit into cash. STEL's liquid resources now consist almost entirely of three things: next year's dividend receipts, the listed shares it could sell, and the remaining small deposit balance.
Selling is possible in principle, but it is a blunt tool. Large blocks of group-company shares cannot always be sold quickly without moving the price, and selling them would cut into the group's ownership of its own operating companies. For a minority shareholder in STEL, that means the portfolio's quoted value is not a pool of cash waiting to be distributed. It is a set of stakes the controlling family has every reason to keep.
Peers, used carefully
India has other listed investment holding companies, such as Summit Securities and Bajaj Holdings & Investment, that also trade at discounts to the value of their holdings. The comparison is useful for one point: deep holding-company discounts are common in India, and they can persist for years.
It is less useful for precise ranking. These companies differ in portfolio composition, dividend policy, tax position, liquidity and control. A like-for-like comparison would need consistent dates and a consistent net-asset-value methodology for each, and STEL itself does not publish an NAV bridge that would make that possible.
What is missing
Three pieces of evidence would turn this section from a puzzle into an answer.
- An updated NAV bridge from the quoted value of the portfolio to book value to share price, on a single date, including the tax that would fall due on a sale.
- Investee-level dividend contribution, so the yield of each holding can be judged.
- An explicit view of the liquidity and control discount, so investors can tell how much of the gap reflects things that could change and how much reflects things that will not.
STEL publishes none of these. The discount is therefore meaningful but not self-explanatory. Part of it is the fair price of market risk, discretionary dividends and limited liquidity. Part of it may reflect something else: the question of who decides what happens to the portfolio, and how much say public shareholders have in that.
VII. Who Controls the Portfolio—and Who Gets a Say?
On September 26, 2026, STEL announced the results of its 36th annual general meeting.10 Every resolution passed. That is normal for a company in which the promoter group owns nearly three-quarters of the shares.
But inside the scrutiniser's report sits a smaller, more interesting number. Among public non-institutional shareholders who voted, about 37% voted against the reappointment of a director.10 More than a third of the participating outside investors in that category said no.
That number captures the governance question at STEL better than any annual-report paragraph: a tightly controlled company, a tiny public float, and a minority that is small in votes but not silent.
The people running the portfolio
There is no chief executive in the usual sense. STEL's executive is its Whole-time Director, Abraham Ittyipe.1 The company reported a board of eight in FY2026, including three independent directors.1 Day-to-day work is carried by a handful of people: the three employees reported at March 2026 include the company's finance and secretarial functions.1
The company secretary role changed hands during the year. Lakshmi P.S. left in February 2026 and Sruthi Sindhu took over on March 1, 2026.1 For a company this small, a change in the secretarial function is not trivial: that role carries much of the compliance, disclosure and shareholder-communication load.
Pay that does not tempt
Pay at STEL is modest by any standard. Total key-management remuneration was about ₹19.65 lakh in FY2026, roughly 1% of profit.1 The Whole-time Director received about ₹2.55 lakh, with no bonus, up from ₹2.40 lakh in each of the previous two years.18 The CFO received about ₹3 lakh.1 No equity incentive plan is disclosed.1
This removes one of the classic governance worries: management paying itself excessively out of a portfolio it does not own. But it also removes a classic alignment tool. People paid a few lakh a year, with no stake in STEL's share price, have little personal incentive to close the holding-company discount. The real decisions sit with the promoter group and the board, and pay is not where the governance test lies.
Control tightening
Promoter-group ownership rose from 69.47% in June 2025 to 71.66% in March 2026 and 72.06% by June 2026.1214 The increase came partly from purchases by promoter-group entities, including Lebnitze Real Estates and Sofreal Mercantrade.1512 No promoter shares were pledged at March 2026.14
Institutional ownership is almost absent. By June 2026, foreign institutional investors held about 0.01% and domestic institutions about 0.07%.12 Put plainly, STEL has almost no professional outside shareholders to ask hard questions at meetings or in private.
There are two readings of rising promoter ownership. The bullish one: insiders who know the portfolio best are buying shares below book value, which is a signal of confidence. The cautious one: each purchase shrinks the public float, reduces trading liquidity, and moves STEL closer to the point where minority shareholders' votes cannot affect any outcome. Both readings fit the evidence; they are not mutually exclusive.
Getting the denominator right
The about 37% dissent figure deserves careful handling, because it is easy to misread.
Measured against all votes polled, dissent was tiny. Adoption of the financial statements drew 968 votes against, about 0.007% of votes cast.10 The director reappointment drew 2,016 votes against, about 0.015%.10 The promoter's votes dominate the denominator.
The higher figures come from looking only at public non-institutional shareholders who voted: about 18% against the financial statements and about 37% against the reappointment.10 That pool is small. So the right conclusion is that a meaningful share of the outside shareholders who bothered to vote were unhappy, not that the company faced a failed mandate. It is a clue, not a revolt.
Controls and their limits
There is affirmative governance evidence. The FY2026 statutory audit opinion and the secretarial audit report were unmodified.1 Related-party transactions, including the PCBL investment, went through committee and shareholder approval.8
There is also a minor limitation worth noting. The auditor reported that edit-log functionality in STEL's accounting software, the audit trail that records who changed what, was implemented only from May 3, 2024, and was not available before that date.1 The auditor found no tampering after implementation.1 It is a remediated control gap of a kind many small Indian companies reported when the requirement came in, not evidence of wrongdoing. But it is part of the record.
The verdict: the filings show steadily rising control and a notable dissent signal within a small public vote, without any failed resolution. Pay is not the issue. The governance test that matters is whether capital allocation and disclosure serve the 28% of shareholders who do not control the portfolio. The next AGM's breakdown of public votes, alongside any further related-party investments, will be the best evidence.
Control and disclosure frame how risks land on minority shareholders. The risks themselves are different from those of an ordinary company.
VIII. What Could Break the Holdco Case?
Imagine a board meeting at one of STEL's largest investees. The company has a big expansion plan. The chair proposes holding the dividend flat, or cutting it, to keep cash for the new capacity. Nobody objects; it is a reasonable choice for that company.
Several hundred kilometres away, STEL's next annual income just fell, and there is nothing STEL can do about it.
That scene is the heart of the risk map. For a holding company, the dangers are not the usual ones. They are the things that reduce cash coming up, or reduce the value shareholders can realise.
The four risks that matter
Concentration. Five large listed positions dominate the portfolio's quoted value.1 A sharp fall in one or two of those share prices moves STEL's book value far more than any income line can offset, as FY2026's negative OCI showed.1
Dividend discretion. Investee boards can cut or pause payouts at any time, and STEL does not disclose which investees pay what (Section III). The FY2021 dip shows how quickly that can bite.7
Market-value declines. Fair-value accounting puts market swings directly into equity. STEL owns no hedge against that, and does not attempt one.1
Holding-company liquidity. With cash and deposits down to about ₹2.4 crore at March 2026,1 STEL's cushion for new investments, or for any unexpected obligation, depends on the next round of dividends or on selling shares.
Counterparties: small and mostly internal
There are no trade receivables or contract assets to worry about; the FY2025 directors' report said there were no receivables in FY2024 or FY2025.8 The FY2026 notes show small balances: about ₹7 lakh of advances due from the inactive subsidiary Doon Dooars Plantations, plus smaller other advances and about ₹5 lakh of accrued deposit interest.1 The ageing of these advances is not disclosed.1
The DDPL balance is trivial against annual income. But advances to an inactive subsidiary are, by nature, the kind of balance whose recovery depends on the parent's goodwill rather than the borrower's cash flows. It is worth watching only to see that it does not grow.
Commitments, disputes and debt
STEL's balance sheet is unusually clean. At March 31, 2026, claims not acknowledged as debts, guarantees, pending capital contracts and other commitments were all reported as nil.1 The only contingent item was about ₹11 lakh of uncalled liability on partly paid shares and investments.1 The auditor reported no pending litigation affecting the financial position and no disputed statutory dues.1
There is no debt. The CARO annexure confirms STEL did not borrow from banks or financial institutions and issued no debentures.1 Lease liabilities are not material.1 The PCBL payable discussed in Section V was an investment obligation, not borrowing, and it has been settled.1 So this is not a refinancing story, and it is not a covenant story.
Tax and the profit gap
The gap between profit before tax of about ₹26.7 crore and profit after tax of about ₹19.9 crore in FY2026 is explained by current and deferred tax.1 Dividends received by an Indian company are taxable in its hands, and fair-value movements create deferred-tax effects. When STEL's effective tax rate moves from year to year, the cause is typically the mix of dividends, interest and gains, and the deferred-tax position on investments, not any shift in operating efficiency.
Currency: a small inconsistency
The FY2026 directors' report says STEL is not exposed to foreign-exchange risk and does not hedge.1 Yet the investment note lists about ₹8 lakh of fully paid shares in Sri Lankan companies, denominated in Sri Lankan rupees and carried at amortised cost.1 Foreign-currency effects on those holdings are not separately quantified.1
The amount is immaterial against a portfolio worth more than ₹1,700 crore. But a flat "no FX exposure" statement sitting beside an LKR-denominated holding is a small disclosure tension, and small inconsistencies are worth noting in a company whose disclosure is otherwise sparse.
Credit: no outside opinion
STEL obtained no credit ratings in FY2025 or FY2026.81 No rating-agency rationale specific to STEL appears in public records. Being debt-free is a fact; it is not the same thing as a rated credit view, and investors should not infer one from the other.
Regulation
As a core investment company, STEL sits within the Reserve Bank of India's framework for CICs, which governs how companies whose business is holding group investments may operate.161 That framework is a constraint on what STEL can do with leverage and non-group investments, not a source of advantage. Any tightening of the rules for CICs would matter more to STEL than any operating-sector regulation.
What is not a direct risk
The usual risk radar items, such as AI disruption, cybersecurity incidents, input-cost inflation and supply-chain shocks, are not STEL's own operating exposures. They matter only through the investees: a tyre maker hit by rubber prices, a power utility facing tariff pressure, an engineering contractor struggling with commodity costs. Each of those can reduce a dividend or a valuation. None of them is STEL's to manage.
The overall verdict: STEL's risks are concentration, dividend discretion, market-value swings and holding-company liquidity. It is not a debt or customer-credit story. With the risk map drawn, the remaining question is whether STEL has any structural reason to win at all.
IX. Frameworks & Bull vs. Bear Case
Imagine a sheet of paper split down the middle. On the left, the listed shares STEL owns, priced every second on the NSE, worth about ₹1,710 crore at March 2026.1 On the right, STEL's own share price, implying the market values the company at a discount to book.12
Every argument about STEL is really an argument about the gap between those two columns, and about whether anything STEL does can close it or justify it.
Porter's Five Forces, adapted
Porter's framework is built for companies that buy inputs and sell outputs. STEL does neither, so the forces need translating.
Suppliers become the investees. They "supply" dividends, and they hold most of the power: their boards set payouts without negotiating with STEL. STEL is a shareholder, sometimes a meaningful one, but the group's operating decisions are not made to suit STEL's income line.
Buyers become the public market investors who set STEL's share price. Their power shows up as the discount. They can buy the underlying investees directly, so they demand compensation for holding them through a wrapper.
Substitutes are obvious and cheap: an investor can own CEAT, CESC, KEC, PCBL and RPG Life Sciences directly through any brokerage account. That is the most important force, and it works against STEL.
New entrants are not a real concern. Nobody can create another vehicle with STEL's specific blocks of group shares.
Rivalry among listed holding companies is weak in the usual sense; they do not compete for customers. They compete only for investor attention and capital, and on that front STEL, with negligible institutional ownership,12 barely competes.
The adapted picture: STEL's supply of income is controlled by others, its buyers have a cheap substitute, and its only protection is that its particular portfolio cannot be replicated. That protection preserves STEL's existence. It does not give minority holders a way to extract more value.
Hamilton Helmer's Seven Powers, used cautiously
Helmer's seven sources of durable advantage are scale economies, network economies, counter-positioning, switching costs, branding, cornered resource and process power.
Most do not apply. STEL shows no scale economies (it is tiny), no network effects, no switching costs (its "customers" are not locked in), no brand power at the STEL level, and no evident process power.
The candidate is cornered resource: privileged access to group stakes and group transactions, such as the right to participate in the PCBL warrant issue.8 That access is real. But Helmer's test for a cornered resource is that it produces superior returns, not merely that it exists. The evidence on that is thin. STEL does not disclose realised returns on its investments, and the PCBL return is still open.1
There is one other source of advantage worth naming: an extremely low cost structure. Three employees and director pay in single-digit lakhs mean almost all income reaches profit.1 That is efficient. But it is a feature of the structure, not a moat: any holding vehicle can be run cheaply.
The bull case
- A diversified basket of real businesses. STEL owns meaningful stakes in companies across tyres, power, engineering, chemicals and pharma.1 Over long periods, a basket of operating businesses can compound value.
- Momentum. FY2026 income and profit each grew about 25%, well above the long-run rate.1
- No leverage. STEL reports no debt and no material contingent liabilities.1 A bad year hurts it, but cannot trigger a solvency crisis.
- Insiders are buying. The promoter group has increased its stake through market purchases while the shares traded below book value.1512
- The discount itself. Buying a share at roughly 0.7 times book offers a margin of safety if the discount narrows.12
The bear case
- Dividends are discretionary and opaque. STEL does not disclose which investees paid what, so investors cannot judge concentration or durability.1
- Portfolio value can fall sharply. FY2026 negative OCI of over ₹160 crore shows that a record income year can coincide with a large loss of equity.1
- Capital allocation is unproven. The largest recent decision, the PCBL warrant investment, distorted two years of cash flow and has no disclosed return yet.81
- The discount may persist. With promoters at over 72% and institutions near zero, the forces that usually push holding-company discounts closed, such as activist pressure, buybacks, distributions in kind are absent.12
- Liquidity is thin. Cash fell to a few crore, and the free float is shrinking.112
The skeptical-investor test
An activist-minded investor would ask one question: why should a minority shareholder own STEL instead of the investees directly?
A convincing answer would need four pieces of evidence. A transparent NAV discount on a single date. A liquidity adjustment for the portfolio. A multi-year history of dividends by investee. And a demonstrated record of capital-allocation returns from purchases like PCBL. STEL supplies none of these today. Without them, the only honest answer is: you might own STEL because the discount is large enough to compensate for the opacity, and for no structural reason beyond that.
The verdict on the moat question follows. STEL's advantage is access to a group portfolio and a low-cost structure. It is not a proven operating moat, and the case for owning it depends on dividend durability, capital allocation and the price paid for the wrapper.
Three KPIs that matter
- Dividend income by investee. The latest aggregate reading is ₹25.53 crore in FY2026, up about 25%,1 but the investee breakdown is not disclosed. That breakdown is the single most valuable disclosure STEL could add.
- Portfolio NAV and the quoted discount, measured on one date. The latest readings are a ₹1,710 crore portfolio at March 2026, down from about ₹1,884 crore,18 and a P/B of about 0.7 in September 2026.12 Direction: portfolio value down, discount wide.
- Cash realised from investments versus cost, especially PCBL. Latest reading: not disclosed. The ₹33.60 crore cost is the benchmark.8
If those three numbers were published and moved the right way, most of the bear case would weaken. Until they are, the framework analysis points less to a verdict than to a set of lessons.
X. Playbook: Lessons from a Company That Owns Companies
Go back to April 25, 2024. STEL's extraordinary general meeting approved its investment in PCBL warrants.8 It was a routine-looking resolution, but its financial effects were outsized.8
That is the defining feature of a holding company. One allocation decision can outweigh years of operating expense. STEL's whole annual cost base is smaller than the swing a single investment can produce. Which is why the lessons here are about measuring holding companies, not about borrowing the stories of the businesses they own.
Lesson 1 — "A dividend is a decision, not a contract."
As Section IV showed, a record year was followed by a June-quarter loss.12
The wider lesson for investors in any holding company, or in any business whose income depends on other people's choices, is to treat each payment as a vote, not an entitlement. Track the voters. For STEL, that means following the dividend declarations of CEAT, CESC, KEC, PCBL and RPG Life Sciences through the year, because STEL will not hand you that schedule.
Lesson 2 — "A group connection is access, not proof of a good price."
As Section V showed, the PCBL warrant deal was approved and priced under SEBI's formula.8 All of that is procedural hygiene. None of it is a return.
For founders and investors in group structures, the lesson is that privileged access to a sister company's securities is only an advantage if it produces better returns than an outsider could earn. The proof is not the approval document. It is the cash that comes back.
Lesson 3 — "Book value is a map, not an exit."
As Section VI showed, FY2026's record profit coincided with a large OCI loss, and STEL traded below book value.112
The lesson: a reported asset value is a description of terrain, not a door you can walk through. Before treating a holding company's discount as free money, ask who could ever unlock it, how, and at what tax and liquidity cost.
Lesson 4 — "Low overhead does not excuse opaque allocation."
As Section VII showed, STEL's three-person staff1 and low director pay1 make its cost base exceptionally lean. That can make investors relax.
They should not. When almost all value flows through a few capital-allocation decisions, the most important cost is not salaries. It is the information minority shareholders lack to judge those decisions. A cheap company that does not publish investee-level dividends or realised investment returns is economical with expenses and also with disclosure. The second matters more.
XI. Epilogue
Tonight, STEL Holdings sits at an odd intersection. It has just reported its best full year and then its weakest quarter. Its portfolio is worth far more than its market capitalisation implies. Its promoter group owns more of it than ever.12 And it has run its liquid cash down almost to nothing after paying for the PCBL shares.1
The next chapter will be written by events that mostly happen elsewhere.
The dividend season that just passed. Most of STEL's large investees held their AGMs over the summer and early autumn of 2026. Their declared dividends will show up in STEL's September and December quarter results. If those quarters recover strongly, the June loss will look like simple timing. If they do not, FY2026 will start to look like the top of a cycle. Either way, investors will still lack the investee-by-investee view that would explain why.
The next annual report. The FY2027 report will bring a fresh schedule of quoted investments and an updated market value for the portfolio. It will show whether the FY2026 decline in portfolio value deepened or reversed. It is also an opportunity: STEL could choose to publish dividend income by investee and a NAV bridge. If it does, the central question of this story becomes answerable. If it does not, the discount has one more reason to persist.
The PCBL scorecard. Every PCBL dividend STEL receives, and any eventual sale, counts against the ₹33.60 crore cost.8 The investment will look good if cash returns and market value together clearly exceed the cost plus a fair return on the capital tied up. Until STEL reports that comparison, the decision remains a question mark rather than a win.
The ownership line and the next AGM. If promoter ownership keeps rising, the public float keeps shrinking, and the minority's leverage shrinks with it. At the next AGM, watch two numbers: how many public shareholders vote, and how many of them vote against. A rising dissent share among a shrinking public pool would say something different from a quiet, consenting minority.
Each outcome maps back to a central question. Steady investee payouts would answer the dividend question in the bull's favour. Disclosed PCBL returns would answer the allocation question. A published NAV bridge would turn the discount from a mystery into a price. And a more engaged public vote would test whether governance keeps pace with control.
What will not answer any of them is a single quarter's profit. STEL's next result could be a large profit or another small loss, and neither would tell investors much without the attribution the company does not publish. The tension that remains is not whether STEL makes money. It is whether its minority shareholders will ever be shown enough to know what that money is worth.
XII. Outro
Return to that boardroom at the start of the story.
That is the strangeness at the heart of STEL Holdings. Owning the companies and owning the company that owns their shares sound like the same bet. STEL is the reminder that they are not.
References
-
Annual Report 2025–2026 — STEL Holdings Limited, 2026 ↩↩↩↩↩↩↩↩↩↩↩↩↩↩↩↩↩↩↩↩↩↩↩↩↩↩↩↩↩↩↩↩↩↩↩↩↩↩↩↩↩↩↩↩↩↩↩↩↩↩↩↩↩↩↩↩↩↩↩↩↩↩↩↩↩↩↩↩↩↩↩↩↩↩↩↩↩↩↩↩↩↩↩↩
-
Annual Report 2024–2025 — STEL Holdings Limited / NSE, 2025-08-25 ↩↩↩↩↩↩↩↩↩↩↩↩↩↩↩↩↩↩↩↩↩↩↩↩↩↩↩↩↩↩↩↩
-
Annual Report 2023–2024 — STEL Holdings Limited / NSE, 2024-09-04 ↩↩
-
36th AGM Voting Results and Scrutinizer's Report — STEL Holdings Limited, 2026-09-26 ↩↩↩↩↩↩
-
Shares of PCBL shoot up by 5% on warrant issue worth Rs 488 cr — Business Standard, 2024-03-28 ↩↩
-
STEL Holdings Shareholding and Price Snapshot — Value Research, 2026 ↩↩↩↩↩↩↩↩↩↩↩↩↩↩↩↩↩
-
March 2026 Shareholding Pattern — STEL Holdings Limited, 2026 ↩↩
-
Core Investment Companies Directions — Reserve Bank of India ↩
 LinkedIn
 WhatsApp
 Reddit
 Hacker News
 Email
Email Kindle
 RSS Feed
 Spotify
 Apple Podcasts
 Amazon Music
 Audible
 YouTube