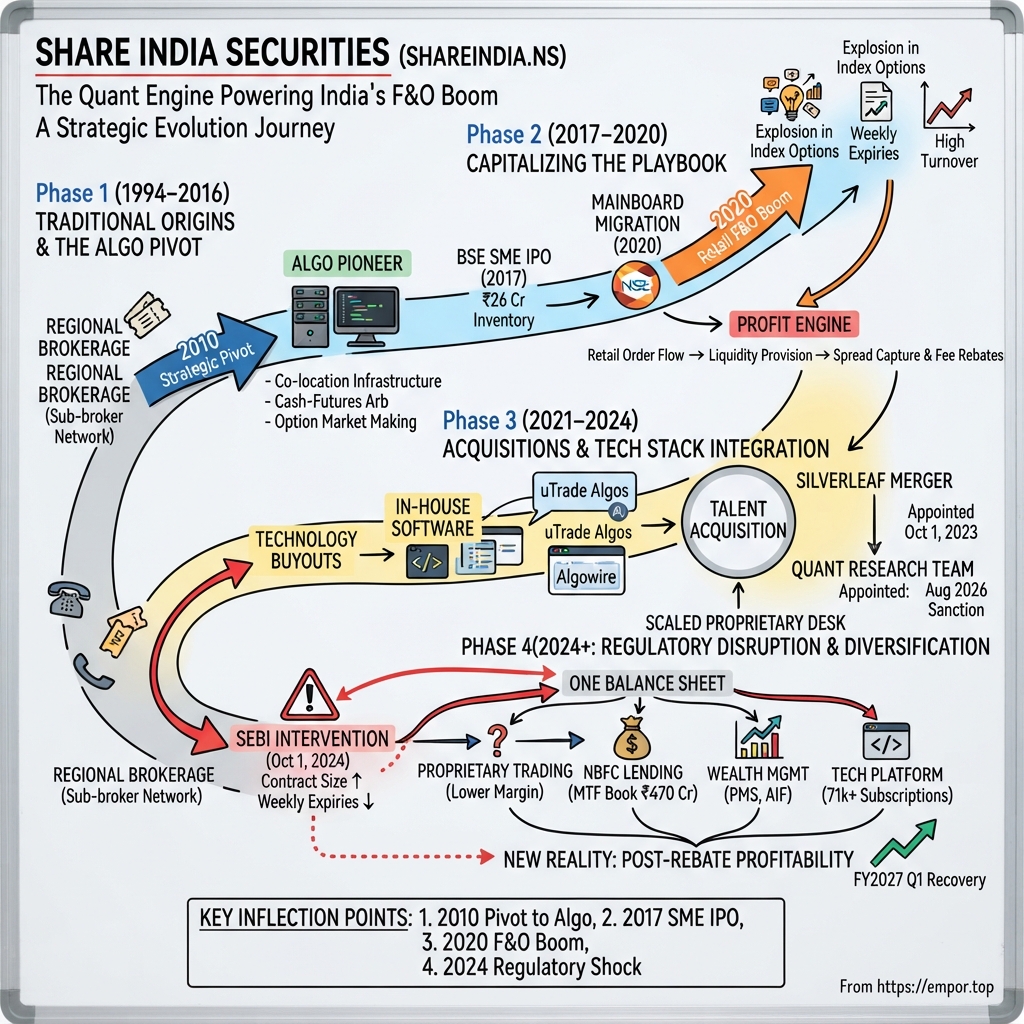
Share India Securities: The Quant Engine Powering India's F&O Boom
I. Introduction & Episode Roadmap
There is a particular room inside the National Stock Exchange's co-location facility in Mumbai that almost nobody outside the industry has ever seen. It is loud, cold, and monotonous — rack after rack of servers, each one leased by a trading firm, each one connected to the exchange's matching engine by a cable cut to the exact same length as every other cable in the building, so that no participant gains an unfair nanosecond. Inside that room, a mid-sized company from Noida rents space alongside Tower Research Capital, Jump Trading, and Hudson River Trading — firms whose global balance sheets dwarf its own by orders of magnitude.
That company is Share India Securities Limited, listed on the National Stock Exchange as SHAREINDIA and on the BSE under code 540725.12 It began life in 1994 as a regional brokerage in North India with a sub-broker network, a telephone, and thin commissions. Three decades later, it operates a proprietary trading desk, a retail and institutional broking franchise, a non-banking finance subsidiary lending against shares, a merchant banking arm, a portfolio management business, and an algorithmic-trading software platform it bought rather than built.
The narrative arc is unusual for an Indian financial company. Most brokers that survived the last decade did so by going asset-light and chasing retail accounts — Zerodha and Groww built enormous businesses on exactly that bet. Share India went the other way. It put capital on its own balance sheet, hired quants, leased servers, and made its money primarily by trading against the flood of order flow that the retail boom created. It then bought the software vendor it depended on and merged in a high-frequency trading firm, paying in its own equity.
The investment spine of this story is a single, uncomfortable question. Between 2020 and 2024, Indian index options turnover exploded to a scale that had no global precedent, and Share India's earnings compounded alongside it. Then the Securities and Exchange Board of India (SEBI) intervened. It banned brokers from pocketing exchange fee rebates, raised derivative contract sizes threefold, and cut the number of weekly expiries. Consolidated profit, which had peaked at ₹426 crore in FY2024, fell to ₹328 crore in FY2025 and ₹324 crore in FY2026 even as revenue held roughly flat.3 That marked two full years of stagnant earnings for a company that had previously compounded profit at roughly 32% a year over five years.3
So: was the historical alpha genuine quantitative skill, or was a meaningful slice of it a regulatory subsidy that has now been withdrawn? And can balance-sheet lending, wealth management, and retail algo software replace what was lost?
It is worth being precise about why this question is harder than it looks. In most businesses, an analyst can separate a cyclical tailwind from a structural advantage by looking at market share, pricing, and customer retention. A consumer brand that holds price during a recession has pricing power. A software company whose customers renew at a net revenue retention rate of 120% has switching costs. These metrics are observable.
Proprietary trading offers almost none of those diagnostic tools. There is no customer to retain — the counterparty is anonymous order flow. There is no price to hold — the spread is set by whichever firm quotes tightest. There is no market share disclosure — exchanges do not publish per-member market-making volumes. The only externally visible output is the profit and loss statement, and the P&L in a trading business combines skill, capital, leverage, volatility, fee structure, and luck into a single figure without breakdown. An investor analysing Share India is therefore in the uncomfortable position of having to infer the quality of a black box from how it behaved when external conditions changed.
Which is precisely why the 2024 regulatory intervention is so analytically valuable. A natural experiment was run on this company without its consent. One high-margin, zero-risk income line was removed by fiat while everything else — the algorithms, the servers, the people, and the market — stayed roughly constant. What happened to profit afterwards is the closest thing to a controlled test of the moat claim that this industry ever produces. The bulk of this piece is devoted to reading that experiment honestly.
The road ahead: the pivot from sub-broker to algo shop; the BSE SME listing that funded it; the acquisitions that bought the technology stack; the actual economics of a prop-trading-led financial group; SEBI's intervention and what it revealed; a hard falsification pass on the three claims that matter most; management, incentives, and governance; the competitive structure through Helmer and Porter; and finally the bull and bear cases with the handful of metrics that will settle the argument.
 Subscribe on LinkedIn
II. The Origins: From Traditional Broking to Algo Pioneer (1994–2016)
Picture Indian stockbroking in the mid-1990s. The screen-based trading introduced by the National Stock Exchange (NSE) in 1994 was still a novelty; much of the country's retail order flow moved through a pyramid of sub-brokers — local intermediaries with a single terminal, a client list built from relatives and neighbours, and a fraction of the commission passed up to a member firm. Trust was personal, settlement was slow, and margins were continually squeezed as commission rates trended downward.
Into that environment, Share India was incorporated in Gujarat in 1994 under the name FMS Securities Limited, operating as a regional broking and sub-broking network across North India.[^4] For roughly fifteen years, it followed the traditional model: executing trades, servicing retail clients, collecting a percentage fee, and absorbing the overhead of physical branches and staff. It was a high-touch, manual business, structurally constrained by declining per-trade commissions.
A decisive shift came around 2010, when the firm rebranded as Share India Securities Limited under a promoter group centred on Sachin Gupta, Kamlesh Vadilal Shah, Rajesh Gupta, Suresh Arora, and Parveen Gupta.[^4] The name change was cosmetic, but the strategic pivot beneath it was structural.
Reading the microstructure before the microstructure was obvious
By the late 2000s, the NSE had moved decisively to electronic order matching and began offering co-location — allowing market participants to rent server space inside the exchange's data centre, shaving execution latencies from milliseconds to microseconds. In the United States, high-frequency trading (HFT) had already reshaped market architecture. In India, co-location was nascent, dominated by foreign HFT firms deploying proprietary capital and C++ execution engines without seeking Indian retail flow.
Share India's management bet on a different model: that the most defensible revenue in Indian capital markets would come not from charging client commissions, but from providing market liquidity. A broker's commission is a tax on client activity; a market maker's revenue is a spread earned on that activity, scaled by balance-sheet capital and technology execution speed. The former is a service model with downward pricing pressure; the latter is a capital-and-technology business with potential returns to scale.
The firm allocated capital to co-location infrastructure, high-speed connectivity, and execution models. Its desk deployed the foundational strategies of systematic trading:
Cash-futures arbitrage. A stock and its futures contract trade at prices tied by interest rates and time to expiry. When prices diverge — often driven by aggressive directional orders — a desk executing in microseconds buys the underpriced instrument and sells the overpriced one, locking in a spread that converges at settlement. While theoretically low risk, execution depends entirely on speed and capital efficiency relative to competing desks.
Option market making. A market maker continuously posts bid and ask quotes, capturing the bid-ask spread. When order flow is balanced, the firm collects that spread across thousands of transactions while maintaining a delta-neutral stance to keep net directional index exposure near zero. Rather than taking directional market risk, the desk operates akin to a currency exchange counter, generating revenue from turnover and spread width.
Statistical arbitrage. High-frequency algorithms identify temporary price dislocations across related instruments, capturing small margins over high trade volumes.
None of these strategies rely on proprietary secrets; all are established quantitative techniques. Operational profitability depends on execution latency, risk controls, capital costs, and, critically, exchange fee structures — a factor that later became central to the company's financial trajectory.
The unglamorous truth about being early in India
The 2010 strategic pivot was less an act of foresight than a response to industry pressures. The traditional brokerage model faced dual headwinds: regulatory caps on trading friction and competitive price-cutting among member firms. For a regional sub-broker network, margin erosion made business model transformation mandatory.
Management evaluated several potential paths. Expanding into wealth management and financial product distribution — earning trail commissions on mutual funds and insurance — was a path taken by many regional peers. Developing a digital discount brokerage was another option, though it required consumer marketing scale and software design capabilities that a Noida-based member firm lacked at the time. Share India chose instead to move upstream toward exchange infrastructure, positioning itself as market plumbing rather than a retail distributor.
That choice reshaped the firm's balance sheet and cost structure, converting Share India into a capital- and technology-intensive business with low headcount relative to revenue. While most Indian brokerages remained human-capital businesses, Share India built an automated trading architecture supported by a lean operating structure.
This pivot also introduced explicit market risk. Traditional brokers face client credit risk and operational risk, but typically do not take balance-sheet exposure to market movements. A proprietary trading desk, by contrast, absorbs market risk as a core element of its income statement. Even with hedged, delta-neutral strategies, trading firms remain vulnerable to rapid volatility shifts or model breakdowns — risk factors that external financial disclosures cannot fully illuminate.
By 2016, Share India had built an automated trading desk, but faced the structural constraint of proprietary trading: position limits and potential earnings are strictly bounded by available equity capital. To expand trading scale, the firm required additional capital, setting the stage for its public listing.
III. Capitalizing the Playbook: SME IPO & Mainboard Migration (2017–2020)
The BSE SME platform is rarely a venue for high-profile corporate debuts. It is built for smaller enterprises, characterized by lot-based trading, thin liquidity, and limited institutional participation. In September 2017, Share India Securities listed on the platform, offering shares at ₹41 apiece and raising roughly ₹26 crore.4
A capital raise of ₹26 crore — roughly three million dollars — was modest in absolute terms, but it addressed a fundamental structural requirement that separated Share India from retail discount brokerages.
Why a prop desk is a balance-sheet business
Retail brokers such as Zerodha or Groww can expand their user bases without proportional increases in capital, as clients fund their own trades while the broker simply intermediates. That asset-light software model features an incremental cost per user approaching zero.
A proprietary trading firm operates on the opposite principle. Every position held intraday or overnight must be collateralized by margin deposited directly with the clearing corporation. Equity functions not as a safety buffer, but as working inventory. Provided strategies can scale, doubling available capital enables a firm to carry larger position sizes and capture greater gross spreads. The IPO proceeds functioned primarily as trading inventory rather than marketing or branch expansion capital.
A public listing offered a second operational advantage. Exchanges, clearing corporations, and institutional counterparties evaluate trading members on balance-sheet strength and regulatory transparency. Operating as a listed entity with audited quarterly disclosures, an independent board, and visible net worth improved Share India's standing when seeking institutional position limits.
2020: migration, and then the flood
In 2020, the company migrated from the SME platform to the mainboards of the BSE and NSE — the standard graduation route for SME issuers that clear size and profitability thresholds.12 The timing coincided with an unprecedented shift in Indian retail trading.
Pandemic lockdowns, smartphone adoption, zero-commission equity delivery, and household savings drove millions of new investors into Indian equities. The bulk of incremental retail activity landed in NIFTY and BANKNIFTY index options — low-cost contracts featuring weekly expiries and high leverage.
For liquidity providers, this shift produced a major volume surge. Retail option buyers traded heavily in aggregate while paying bid-ask spreads. Subsequent research by the Securities and Exchange Board of India (SEBI) detailed the scale of retail losses during this period: a study covering FY2022 to FY2024 found that roughly 93% of individual traders in equity derivatives lost money, with cumulative losses exceeding ₹1.8 lakh crore over three years.5 Those capital losses were redistributed across the ecosystem to exchanges, government taxes, intermediaries, and market makers taking the opposite side of the trades.
Share India captured a portion of this order flow. Consolidated revenue grew from ₹453 crore in FY2021 to ₹862 crore in FY2022 and ₹1,088 crore in FY2023; net profit went from ₹81 crore to ₹202 crore to ₹331 crore across the same span.3 Return on equity exceeded 30% during this window, highlighting the analytical question of how much performance stemmed from proprietary trading execution versus broader market conditions.
Why the boom was even better than the volume numbers suggest
The structural mechanics of Indian index options amplified profitability for market makers beyond what raw volume metrics indicated.
Weekly contract expiries created a continuous cycle of time decay, as out-of-the-money options purchased by retail traders regularly expired worthless. Market makers selling options and managing dynamic hedges earned spreads on entry and exit across weekly cohorts.
Contract sizing further drove trading velocity. With small minimum premium requirements relative to underlying contract values, individual retail order counts remained high. For market-making algorithms, high transaction frequency across small order sizes offers more favorable spread capture than larger, negotiated institutional trades.
Additionally, exchange fee tiering allowed high-volume participants to realize lower effective transaction costs than those billed to end clients. As a result, trading desks generated revenue from three concurrent sources: the bid-ask spread, fee differentials, and operating leverage on fixed infrastructure costs.
These revenue streams reported as a single top-line figure on the income statement, obscuring the relative contributions of quantitative execution skill, regulatory fee structures, and market tailwinds. Regulatory changes in 2024 subsequently isolated these underlying components.
Alongside its proprietary trading operations, Share India expanded its physical network to hundreds of branches and franchise points across 16 states — which gave it clearing relationships, institutional flow, and a distribution footprint that pure-digital brokers deliberately avoided.6
By 2020, Share India had secured the capital and exchange access required to intermediate rising derivative volumes. The subsequent period tested whether the firm could convert cyclical market gains into durable institutional infrastructure.
IV. The Acquisition Spree: Buying the Tech Stack (2021–2024)
By 2021, Share India faced a structural challenge common among expanding trading firms: dependence on third-party software. Execution platforms, order-management systems, and risk engines — the operational core of modern trading — were largely leased from external vendors. In an industry where competitive edge is measured in microseconds and strategies must adapt overnight, relying on vendor architecture creates a strategic vulnerability.
In September 2021, the company announced two acquisitions concurrently: Algowire Trading Technologies Private Limited and uTrade Solutions Private Limited, framing the combination as a platform for AI-driven automated trading, strategy development, and execution for retail investors.7 The uTrade transaction closed that November, with Share India acquiring a 63.50% post-issue equity stake for a consideration of ₹13.68 crore, making it a subsidiary.8
At under ₹14 crore, the outlay was modest relative to the ₹331 crore net profit Share India would generate two years later. Rather than a transformational bet, it represented a disciplined capital allocation to bring core capability in-house at a reasonable valuation.
Build versus buy, and what the price tag actually implies
The rationale for controlling technology infrastructure is straightforward. Latency tuning, order routing, and risk engines are critical execution components where vendor abstraction layers add delay and restrict operational flexibility. Internalizing these systems converts recurring software expenses into owned assets and eliminates key supplier dependencies.
The secondary claim — that uTrade would become a meaningful external software business selling algorithmic tools to retail and HNI traders under the uTrade Algos brand — is a different proposition entirely, and it deserves scepticism.9 Distributing B2B2C trading software in India requires competing on distribution against discount brokers that bundle execution tools at zero marginal cost. As of FY2026, the company reported roughly 71,000 subscriptions to its algo platform, and management flagged around 20% sequential subscription growth going into the June 2026 quarter.1011 While these figures reflect steady product adoption, even favorable revenue-per-subscriber assumptions leave this business segment immaterial relative to a corporate entity earning ₹1,470 crore of revenue.3
A balanced assessment suggests a narrower conclusion: the acquisitions were competent, cheap, defensive infrastructure purchases that reduced vendor risk while giving the firm a retail-facing product to cross-sell. Treating uTrade as embedded software optionality with a large independent value would require evidence — disclosed standalone SaaS revenue and margin — that the company has not separately broken out.
What "retail algo" actually means, and why it is harder than it sounds
The uTrade Algos platform functions primarily as a visual strategy builder. At its core, the product allows non-programmers to define automated trading rules — such as triggering an option purchase or stop-loss exit when a technical indicator breaches a threshold — and execute them automatically against the user's broking account. The commercial premise targets retail investors seeking to eliminate emotional decision-making through automated execution.
However, monetizing retail algorithmic software faces structural headwinds in the Indian brokerage market. Major brokers frequently offer comparable functionality free as a retention feature rather than a revenue line, deriving their economics from brokerage commissions and client cash floats. A standalone subscription product must therefore justify a price against free alternatives, selling to a customer base that SEBI's own research shows is overwhelmingly losing money and therefore has a shrinking ability to pay.5 Consequently, customer churn remains structurally high because subscriber budgets are funded by trading profits that mostly do not exist.
This dynamic does not render the product worthless. It positions uTrade Algos as a value-added retention feature with a price tag rather than a standalone platform with a competitive moat. Validating the platform's standalone value would require explicit reporting on subscription revenue, customer retention rates, and average revenue per subscriber over multiple reporting cycles. Until such metrics appear, the honest position is that uTrade is an internal capability with a modest external revenue attachment.
Silverleaf: paying in equity for quant talent, and then waiting three years
The second major deal involved greater structural complexity. Share India agreed to amalgamate Silverleaf Capital Services Private Limited — a quantitative trading firm — into itself, with an appointed date of October 1, 2023. The exchange ratio was 500 equity shares of Share India (face value ₹2) for every 1 equity share of Silverleaf (face value ₹10), determined on the basis of a valuation report dated March 18, 2024.12 Shareholders approved overwhelmingly: of 13,82,49,606 valid votes cast by 204 shareholders, 13,80,07,689 were in favour — 99.83%.12
Regulatory approval, however, experienced a multi-year delay. The National Company Law Tribunal's Ahmedabad bench sanctioned the scheme only on August 20, 2026 — pronounced nearly three years after the appointed date.13
That multi-year gap introduces analytical complexity for external observers. Scheme-of-arrangement delays at the NCLT are common in India and are not evidence of wrongdoing. However, an acquirer whose combination sits unresolved for three years leaves reported consolidated economics, share count, and comparative growth rates harder for an outside investor to read cleanly across that period. Retrospective appointed dates create restated comparatives. Anyone modelling FY2024 through FY2026 growth needs to understand which entity was inside which set of numbers, and when.
On strategic merit, equity-funded acquisitions of quantitative trading firms primarily function as talent acquisition and retention mechanisms. Trading models are not factories; their alpha decays as markets become more efficient and competitors converge on identical signals. Enduring value resides in the quantitative researchers who generate next-generation models when current strategies stop working. Issuing equity aligns talent incentives over a multi-year horizon. Whether the merger proves accretive depends on ongoing quantitative output that merged financial reporting cannot cleanly isolate.
Furthermore, retrospective accounting adjustments complicate historical performance evaluation. When a scheme carries a retrospective appointed date, financial statements are restated to include the transferor from that date once the scheme is sanctioned. An investor comparing FY2024 or FY2025 figures published at the time against figures published after August 2026 may evaluate different corporate perimeters without realizing it, altering calculated growth-rate arithmetic.
The equity raises
Share India has returned to capital markets repeatedly to fund its balance sheet expansion. The rights issue documented in this cycle was a 2023 offering of 6,38,131 equity shares priced at ₹700 each, aggregating up to approximately ₹804 crore.14 The proceeds direction was consistent with its strategic pivot: funding the margin trading facility book through its NBFC subsidiary, Share India Fincap, and supporting exchange margin requirements. The company has also used debt, allotting non-convertible debentures on private placement and later seeking approval for early redemption of ₹74.9 crore of NCDs.15 Reflecting this capital expansion, consolidated borrowings rose from ₹119 crore in FY2021 to ₹695 crore in FY2026.3
Taken together, the 2021–2026 capital allocation record shows a management team that raised equity and debt repeatedly, bought technology cheaply, bought talent expensively in stock, and levered the balance sheet to build a lending book. The strategy is coherent. Whether it is accretive per share remains an open question: flat earnings across FY2025 and FY2026, set against a rising share count and expanding net worth, highlight the key point of friction for any analytical evaluation.
V. Core Business Economics & Segment Breakdown
Underneath its corporate structure, Share India operates as four distinct businesses sharing a single balance sheet and technology platform. Analyzing how each segment generates revenue — and how closely their underlying risk profiles correlate — is central to evaluating the firm's long-term trajectory.
Proprietary trading and market making. Historically the group's primary profit engine, this segment commits internal capital to quote, arbitrage, and hedge across cash equities, futures, and index options, capturing spreads on substantial trading turnover. The business operates with a high fixed-cost base, including co-location fees, exchange connectivity, quantitative researchers, and software engineers. Once fixed overheads are covered, incremental trading volume generates high profit margins. Consequently, operating leverage drove exceptional returns during the derivative volume surge, but offers little cushion when market activity moderates.
Broking and depository services. This division provides execution, clearing, and custody services for retail, high-net-worth, and institutional clients across both digital channels and a physical branch and franchise network. Operating in a highly commoditized market segment, it faces persistent pricing pressure from discount brokerages.
NBFC financing. Through its subsidiary, Share India Fincap, the firm extends margin trading facility (MTF) loans, allowing clients to leverage their equity portfolios for larger positions. The unit operates on a conventional net interest margin model, borrowing wholesale funds to lend at a spread secured by liquid equity collateral. As of the June 2026 quarter, the MTF book stood at approximately ₹470 crore, alongside a broader NBFC loan book reported near ₹268 crore.1011 While these loans offer attractive yields, they present a clear correlation risk: demand for margin funding expands during buoyant market cycles and contracts during downturns, while the underlying collateral remains tied to the same equity markets that drive the trading desk's performance.
Technology and software. This unit generates recurring revenue through subscriptions and API access for uTrade Algos and Algowire, alongside providing internal execution infrastructure.
Newer adjacencies. In FY2026, the group expanded into wealth management by launching portfolio management services (PMS) and initiating setup for a Category III alternative investment fund, while incorporating Share India Cred Capital Private Limited to build a technology-driven fixed-income platform.9 By the June 2026 quarter, PMS assets reached roughly ₹150 crore, institutional client count expanded from 186 to 212, and the merchant banking division completed a ₹200 crore SME IPO and a ₹167 crore mainboard IPO. Meanwhile, the Cred Capital fixed-income platform reported ₹674 crore in gross sales against ₹1.08 crore in EBITDA.10 That disparity highlights the economics of fixed-income distribution: high gross transaction volumes yield wafer-thin take rates, making the segment immaterial to near-term group earnings.
The hidden structure: one balance sheet, four claims on it
A simple segment-by-segment overview obscures a critical operational reality: these four business units compete directly for the firm's core balance sheet capital.
Every rupee of equity must be allocated among competing priorities: deposited as exchange margin to support proprietary trading positions, extended to clients through the MTF loan book, held as regulatory capital at the NBFC, or deployed toward branch expansion and product development. Management's capital allocation across these competing uses represents the single most important strategic variable driving long-term return on equity.
The pivot toward balance-sheet lending represents a strategic reallocation of capital away from high-margin, high-volatility proprietary trading toward lower-margin, more predictable interest income. This transition deliberately lowers the firm's return ceiling in exchange for establishing a higher return floor. Whether this shift benefits shareholders depends on whether historical proprietary returns reflected sustainable quantitative alpha or temporary market conditions.
Additionally, expanding into margin lending alters the firm's regulatory surface area. Lending against securities introduces direct oversight from the Reserve Bank of India (RBI), bringing capital adequacy requirements and funding restrictions. On the Q1 FY2027 earnings call, management cited shifts in RBI funding norms among its operational risk factors.10 Reallocating capital from SEBI-regulated trading to RBI-regulated lending diversifies regulatory risk across two independent authorities, though it does not eliminate policy exposure altogether.
The industry Share India actually competes in
In proprietary trading, Share India competes against global quantitative institutions, including Tower Research Capital, Jump Trading, Hudson River Trading, Graviton Research Capital, and AlphaGrep Securities operating in Indian co-location. These entities possess global research capabilities, custom hardware, and lower capital costs than a mid-cap domestic firm. In microsecond-level execution races, operational efficiency alone is insufficient; latency dominance determines capture rates.
In retail broking, the market is similarly concentrated. Digital-first platforms such as Zerodha, Groww, and Angel One dominate active client accounts on the NSE, while established full-service firms including Motilal Oswal, IIFL Securities, and ICICI Securities maintain leadership in advisory-led segments. Share India's retail market share remains modest by comparison.
Management's response has been to pursue a hybrid operational model: proprietary trading profits capitalize the balance sheet, the branch network generates client order flow, the NBFC monetizes client leverage, and the internal software stack supports all three units. On the Q1 FY2027 earnings call, management reported that client activity accounted for roughly 60% of total volume, explicitly framing the strategy as a diversification effort to reduce reliance on proprietary trading.10 This disclosure acknowledges that the firm's historical earnings engine requires structural replacement rather than simple supplementation.
That strategic shift brings into focus the regulatory interventions that forced the transformation.
VI. SEBI Regulatory Disruption & Historical Falsification Layer
On July 1, 2024, the Securities and Exchange Board of India (SEBI) issued a circular mandating that charges levied by market infrastructure institutions be "true to label."[^17] Taking effect on October 1, 2024, the ruling eliminated a lucrative fee structure across Indian broking economics.
The rebate machine, explained plainly
Historically, stock exchanges charged transaction fees on a tiered scale: higher trading volumes unlocked lower effective fee rates. Member brokers, however, routinely billed clients at the standard top-tier rate and retained the surplus rebate. This volume-based spread generated risk-free income independent of capital deployment or execution edge.
SEBI mandated that brokers pass exchange charges directly to clients without markup, wiping out the rebate pool overnight. Industry estimates projected total broker revenue losses near ₹2,000 crore, with rebate income representing roughly 8% to 10% of top-line revenue across the sector; Zerodha publicly guided toward a potential 10% revenue decline.16
For Share India, operating a high-turnover proprietary trading desk relative to its balance-sheet size created disproportionate exposure to this regulatory shift. Because exchange rebates scaled directly with transaction volume rather than account counts, the mandate targeted the firm's primary profit engine.
The second blow: shrinking the retail F&O pool
SEBI expanded its regulatory tightening through late 2024 and 2025 by raising minimum derivative contract sizes from roughly ₹5 lakh toward ₹15 lakh to ₹20 lakh, restricting weekly option expiries to one benchmark index per exchange, and enforcing stricter intraday margin rules. The measures followed regulator-published loss studies, including a follow-up report spanning FY2025 and FY2026.175 Despite these interventions, reported derivatives turnover moderated while the proportion of loss-making retail participants remained elevated through FY2025.18
These structural changes reshaped market-making economics. Proprietary trading returns depend on bid-ask spreads multiplied by trading volume. Limiting expiry calendars and increasing contract values reduced the participation of short-term retail traders whose frequent orders had funded market-maker spreads.
Myth versus reality
Three common market assumptions regarding Share India warrant scrutiny against disclosed performance data.
Myth: Share India operates as a high-frequency trading firm competing head-to-head with global quantitative institutions. Reality: While the firm leases co-location space and deploys automated strategy families, company disclosures indicate that client transactions account for roughly 60% of total trading volume.10 Share India is structured as a diversified capital-markets group running an automated desk rather than a pure-play high-frequency trading shop.
Myth: The FY2025 earnings contraction resulted from cyclical market weakness. Reality: Consolidated revenue remained steady at ₹1,483 crore in FY2024, ₹1,449 crore in FY2025, and ₹1,470 crore in FY2026.3 Stable top-line revenue alongside declining net profit demonstrates that volume remained intact while operating margins contracted, reflecting the direct impact of fee-rebate elimination.
Myth: Strategic expansion into wealth management, fixed income, and lending insulates earnings from broader equity market cycles. Reality: Diversification mitigates reliance on specific regulatory fee structures, but the new operating units remain dependent on broader Indian capital-market activity.
Falsification pass, claim by claim
Evaluating the firm's investment thesis requires testing three core bull-case claims against disclosed operating data.
Claim 1: Share India maintains a durable proprietary trading moat derived from proprietary execution algorithms.
Financial results challenge this thesis. Consolidated net profit fell from ₹426 crore in FY2024 to ₹328 crore in FY2025 and ₹324 crore in FY2026 on flat revenue.3 A persistent margin decline during a period of steady revenue indicates the loss of high-margin regulatory fee rebates rather than a temporary drop in market demand.
A significant portion of historical proprietary profitability stemmed from structural exchange fee capture rather than un-replicable quantitative execution. Nevertheless, the desk maintained group profitability following the regulatory change. In the first quarter of FY2027, consolidated net profit rose approximately 47% to 48% year-over-year to ₹124 crore on revenue of ₹448 crore, up about 31%.1119 This performance suggests baseline trading profitability absent fee rebates, though consolidated return on equity stood at approximately 13% in FY2026, well below peak historical levels.3
Verdict: Claim narrowed. The firm operates a scaled trading desk, but its margins remain sensitive to regulatory structures and competitive pressures from global quant desks.
Claim 2: The firm's acquisition strategy represents disciplined, value-accretive capital allocation.
The historical record displays mixed results. Acquired for ₹13.68 crore, the 63.5% stake in uTrade represented a low-cost infrastructure addition.8 Conversely, the Silverleaf merger involved an equity-based exchange ratio based on a March 2024 valuation report that remained in regulatory approvals until August 2026.1213 Additionally, the 2023 rights issue raised equity capital at ₹700 per share.14
While net worth expanded to approximately ₹2,577 crore by March 31, 2026, and ₹2,760 crore by June 30, 2026, earnings per share declined from ₹22.22 in FY2024 to ₹15.01 in FY2025 and ₹14.78 in FY2026.3910 Capital expansion alongside lower per-share earnings across consecutive years highlights the challenge of reinvesting capital at historical return rates.
Verdict: The claim of a high-margin external software franchise is rejected on available disclosures, while broader capital allocation effectiveness remains unproven pending sustained per-share earnings recovery.
Claim 3: Expansion into retail broking and wealth management will decouple earnings from proprietary trading volatility.
Establishing market share in retail broking remains challenging given the dominance of established discount brokers. Management's plans to add 30 physical branches over two years with an estimated 8 to 12-month breakeven period per site reflect a gradual capital deployment model.10
Furthermore, margin trading interest income, broking commissions, portfolio management fees, and software subscriptions remain correlated with equity market volumes.
Verdict: Unproven and likely overstated. Margin lending provides incremental net interest income, but non-proprietary business segments remain tied to overall market activity.
The activist's angle
Additional balance-sheet items warrant ongoing monitoring. Filings list contingent liabilities of approximately ₹2,182 crore alongside promoter share pledging of roughly 57.8%.3 While contingent liabilities primarily represent bank guarantees provided for exchange margin requirements, promoter pledging links personal balance sheets to equity market valuations.
Additionally, managing multiple operating units—including proprietary trading, margin lending, wealth management, and technology development—creates significant intercompany activity, requiring ongoing scrutiny of related-party transactions and capital allocation across subsidiaries.
VII. Management, Governance, & Incentives
Indian financial services is filled with promoter-led firms where the founder's name is the brand. Share India is not one of them. There is no charismatic public face, no bestselling book, and no viral founder. Instead, a promoter group has maintained a controlling stake through every capital raise and continued operating the business through a regulatory shock that removed a substantial portion of its profit pool.
Sachin Gupta serves as CEO and Whole-time Director, holding a direct stake of roughly 5.97%, and has driven the group's technology integration and expansion into adjacent capital-market businesses.20 Kamlesh Vadilal Shah serves as Managing Director with a direct holding near 3.41%, focusing on regulatory strategy and group administration — a critical role in an industry where SEBI can eliminate a key revenue line with a single circular.20 Combined promoter-group shareholding has remained between 50% and 55%, aligning insiders with long-term equity outcomes while ensuring minority shareholders remain dependent on promoter decision-making.20
What the promoter group has avoided is equally informative. The company has eschewed diversification into unrelated industries — avoiding real estate, hospitality, or infrastructure ventures. Every entity added to the group sits directly within financial services and the broader capital-markets value chain: broking, margin lending, trading software, merchant banking, portfolio management, fixed-income distribution, and an IFSC unit. For Indian promoter-controlled companies, where expanding into fashionable adjacencies has frequently destroyed shareholder value, maintaining focus within a single core competency is a positive sign — though it also leaves the group without a counter-cyclical buffer during market downturns.
Reading the behaviour rather than the biography
Management credibility is best assessed through historical actions, where three distinct patterns emerge.
First, capital-return behaviour has been consistent but modest. The company issued 1:1 bonus shares in 2023 and completed a 1:5 stock split in 2024 — both cosmetic actions that increase liquidity without transferring economic value.21 Cash dividends were maintained through the recent downturn, with a final dividend of ₹0.50 per share (face value ₹2) for FY2026 and an interim dividend of ₹0.50 declared for Q1 FY2027.922 Sustaining distributions while net profit fell provides a modest signal of balance-sheet stability, though payouts remain small relative to earnings — a prudent stance for a capital-intensive margin and lending operation.
Second, management has explicitly shifted its strategic narrative. During the boom years, messaging focused on algorithmic trading prowess and market-making scale. By the FY2026 annual report and the Q1 FY2027 earnings call, focus shifted to wealth management, fixed income, institutional clients, merchant banking, and physical branch expansion, framed explicitly as a strategy to reduce dependence on proprietary trading while noting that client transactions now account for most volume.910 This pivot invites two interpretations: adaptive management responding to regulatory changes, or a deliberate de-emphasis of a slowing growth engine. Both perspectives carry weight, but ultimate evaluation depends on whether these new business lines generate meaningful net profit rather than raw volume. The experience at Cred Capital — which generated ₹674 crore in gross sales but just ₹1.08 crore in EBITDA — illustrates that transaction volume does not automatically convert into bottom-line earnings.10
Third, financial disclosures remain adequate rather than exemplary. Management provides operational color on investor calls, quantifying the margin trading book, portfolio management assets, subscription counts, and institutional client figures.10 However, disclosures lack a clean, consistently reported multi-year breakdown of net profit — rather than revenue — separating proprietary trading from client-facing segments. For a company whose central investment case hinges on that structural distinction, the absence of standalone trading desk profitability prevents outside investors from independently verifying the success of its diversification strategy.
On broader governance matters, the Silverleaf merger scheme received 99.83% shareholder approval, indicating minimal organized minority dissent, though a promoter voting block exceeding 50% renders such approvals largely routine.12 Given the complex corporate structure, intercompany financial flows between the parent company, Share India Fincap, uTrade, and the newly integrated Silverleaf operations warrant detailed examination in the annual report's related-party disclosures.
A key test of management credibility lies in how leadership addressed the earnings slowdown. The disclosure record shows a concrete rather than evasive response: management directly cited SEBI regulatory changes, quantified its diversification initiatives through loan book growth, client counts, and subscription metrics, and established explicit operational targets for its branch rollout.10 Committing to open roughly 30 branches over two years with an expected breakeven timeline of 8 to 12 months per location provides a clear, verifiable benchmark for future performance.
However, that transparency remains selective. While branch targets and user metrics are explicitly reported, the standalone profit contribution of the proprietary trading desk remains undisclosed. In corporate reporting, detailed disclosures often concentrate in areas of positive operational traction. Investors should note this reporting asymmetry when evaluating group performance.
Overall, the governance profile does not present immediate structural alarms. It reflects a typical Indian mid-cap promoter architecture: closely held, operationally aligned, adequately disclosed, and requiring ongoing monitoring — particularly regarding promoter share pledging, which remains a key variable for balance-sheet risk should equity valuations decline.
VIII. Strategic Frameworks: 7 Powers & Porter's 5 Forces
Frameworks are only useful when they force uncomfortable honesty. Applied to Share India, they mostly do.
Hamilton Helmer's 7 Powers
Scale economies — moderate, and bounded. Co-location racks, connectivity, and engineering are fixed costs spread across trading turnover. Higher volume yields a lower cost per trade. That advantage is real, but it is bounded by a hard ceiling: the global quantitative firms competing for the same queue positions operate across dozens of international venues. Share India possesses scale relative to domestic mid-caps, but remains subscale compared to the global desks trading against it.
Process power — moderate. Fifteen years of latency tuning, order routing, and delta-neutral risk management represent genuine institutional knowledge that cannot be replicated overnight. However, process power in proprietary trading carries an expiration date that process power in manufacturing does not: algorithms adapt, competitors converge, and yesterday's quantitative edge becomes today's table stakes.
Cornered resource — low to moderate. The quantitative trading team integrated from Silverleaf and the software architecture from uTrade are useful operational assets, but neither represents a cornered resource. Quantitative researchers move between firms, and software platforms can be rebuilt. A cornered resource is an asset a competitor cannot obtain at any reasonable price; neither acquisition meets that threshold.
Switching costs, network economies, branding, counter-positioning — essentially absent. Retail trading clients face near-zero switching friction. Network effects do not exist in a market where liquidity accrues to the exchange matching engine rather than the broker. The Share India brand commands no premium pricing power. Finally, counter-positioning works in reverse: discount brokerages counter-positioned against traditional full-service firms, leaving Share India on the traditional side of that structural shift.
The missing power — regulatory dependence. This represents the defining structural feature of the business. A single SEBI circular removed a high-margin income stream with only a few months of advance notice. Corporate strategy cannot easily neutralize regulatory mandates; it reflects an exposure rather than a competitive power.
The absence of a structural moat is not an indictment of management. Helmer's framework evaluates the structural distribution of industry returns rather than operational competence. Disciplined cyclical operators, commodity producers, and market-making desks can generate strong equity returns without possessing a durable moat. The analytical mistake is applying a moat-driven valuation framework to a cyclical, balance-sheet-dependent business. Companies with competitive power command valuation multiples based on cash-flow durability; companies without power must be evaluated on balance-sheet strength, position in the market cycle, and capital deployment discipline.
Porter's Five Forces
Supplier power — extremely high. The primary suppliers in this ecosystem are SEBI and the stock exchanges. They dictate contract sizes, expiry schedules, margin requirements, co-location access, and fee structures. The regulatory interventions of 2024 demonstrated that these institutions exercise their market power directly.
Buyer power — high. Retail trading clients can switch execution platforms within minutes, while institutional clients routinely negotiate fee structures. Price discovery in Indian equity broking has trended downward for decades.
Competitive rivalry — high, on two fronts simultaneously. Global quantitative firms compete away bid-ask spreads inside co-location facilities, while domestic discount brokerages compete for retail order flow through user experience and brand marketing. Operating on two fronts against specialized competitors creates a demanding operational environment.
Threat of substitutes — moderate to high. If regulatory tightening dampens retail derivatives activity, retail capital does not automatically remain within high-frequency trading channels. Capital flows instead into mutual funds, systematic investment plans, fixed-income instruments, gold, or real estate, reducing total transaction volume. Share India's expansion into wealth management and fixed-income distribution attempts to capture these capital flows, though it places the company in direct competition with established asset managers.
Threat of new entrants — moderate. Substantial capital requirements and infrastructure complexity deter informal entrants into proprietary market making. However, well-capitalized global trading desks continue to expand their operational presence within Indian co-location facilities.
The composite picture reveals a capable operator in a structurally challenging industry environment: no durable power under Helmer's criteria, intense pressure across four of Porter's five forces, and a regulatory authority willing to reshape industry profit pools. These constraints do not make Share India an unviable business; capital-backed cyclical firms can yield strong investor returns when evaluated appropriately across market cycles. However, future earnings must be understood as cyclical and policy-dependent rather than the predictable output of an entrenched competitive moat.
IX. Bull vs. Bear Case & Key Forward KPIs
The bull case
The bull case does not depend on the proprietary desk recovering its peak performance. It relies instead on three strategic substitutions.
Balance-sheet lending replaces rebate income. Margin trading facility lending against equity collateral operates as a high-yield business backed by liquid security and supported by an existing brokerage client base. If Share India Fincap scales its book meaningfully beyond the roughly ₹470 crore margin trading book reported in mid-2026, net interest income provides a recurring, predictable earnings stream of the type the company previously lacked.10 Broad growth in the Indian margin lending market provides expansion room.
Algo tooling and wealth products deepen client relationships. Reaching approximately 71,000 algorithmic trading subscriptions growing at a double-digit sequential rate, alongside expanding portfolio management assets, a planned alternative investment fund, and a growing institutional client base, represents the early stage of a client franchise rather than a standalone trading desk.910
International and IFSC optionality. GIFT City operations contributed modestly — generating around ₹2 crore of positive returns in the June 2026 quarter — while broader policy initiatives to establish GIFT-IFSC as an international financial hub provide a regulated, tax-advantaged venue for cross-border trading strategies.10 Though minor today, the unit represents an operational growth option as the ecosystem matures.
Near-term operating results provide supporting evidence: in the first quarter of fiscal 2027, consolidated revenue grew roughly 31% and net profit rose about 47% year-over-year, indicating that the business adapted faster than fiscal 2025 performance suggested.1119
The bear case
Regulatory tightening remains ongoing. SEBI has repeatedly demonstrated its willingness to adjust derivative market structures when retail trading losses become a public policy focus, supported by its ongoing research findings.17 Additional restrictions directly compress market turnover, presenting a headwind across all operating segments.
Spread compression from better-capitalized competitors. As Indian index option markets mature, international high-frequency trading firms bid spreads tighter. Market-making margins naturally trend toward the cost of capital of the most efficient participant — a standard that poses a challenge for a domestic mid-cap entity with a ₹2,700 crore net worth.
Capital dilution without matching earnings growth. Capital expansion through rights issues, the Silverleaf share swap, and higher debt coincided with flat consolidated earnings and declining per-share profit over a two-year span.3 If incremental capital generates returns below historical averages — reflected in a fiscal 2026 group return on equity of roughly 13%, down from over 30% during peak market cycles — the equity thesis shifts from earnings compounding to book-value accumulation.3
Correlated business segment exposure. The firm's expansion areas — margin lending, portfolio management, retail brokerage, algorithmic subscriptions, and merchant banking — remain tied to overall Indian capital-market activity. In a prolonged market downturn, these revenue lines face simultaneous pressure.
Balance-sheet leverage and promoter pledging. Consolidated borrowings of ₹695 crore alongside promoter share pledging near 57.8% remain manageable during market expansions but introduce vulnerability during market contractions.3
The risk radar, filtered to what actually applies
Evaluating the firm requires filtering broad industry risks down to those with direct operational transmission mechanisms.
Regulatory risk remains the dominant exposure and has already affected historical earnings. Future adjustments to contract expiries, position limits, margin requirements, or fee arrangements would transmit directly to quarterly performance.
Technology and operational risks present substantial exposure. For a systematic trading firm, major operational risks often stem from unhedged market positions, execution algorithm errors, connectivity disruptions, or risk-control failures. While internal controls exist and undergo audit, their real-time effectiveness cannot be independently verified, and risk distributions in high-frequency trading exhibit long-tail characteristics.
Cybersecurity and data integrity risks apply directly to a firm managing retail client collateral, securities, and financial records across digital applications and physical branches. Compliance with SEBI's cybersecurity framework represents both a regulatory and operational requirement.
Cost-of-capital and refinancing risks expand alongside the margin lending portfolio. Borrowings of ₹695 crore fund loans collateralized by equity securities.3 During a sharp market decline, falling collateral values and client margin calls coincide with tighter wholesale funding conditions, creating classic securities-lending liquidity pressure.
Concentration risk in promoter share pledging compounds balance-sheet exposure, as severe equity drawdowns exert concurrent pressure on the lending book and promoter collateral values.
Conversely, standard corporate risk factors such as input-cost inflation, supply-chain disruption, and direct geopolitical exposure carry minimal relevance for a domestic, technology-focused capital-markets group.
The three metrics that settle the argument
Evaluating Share India's strategic transformation ultimately hinges on three core metrics.
1. MTF and NBFC loan book size, alongside net interest margins. As the primary replacement growth engine, sustained book expansion with stable interest spreads supports the diversification thesis. Growth achieved primarily through rate concessions or relaxed collateral requirements would indicate volume expansion at the expense of credit quality.
2. Proportion of group profit derived from non-proprietary sources. Revenue breakdown overstates diversification because high-volume, low-margin distribution inflates top-line figures. Segment net profit distribution provides the definitive test of whether client-facing operations can cushion trading volatility. Increased disclosure clarity around segment earnings will serve as an indicator of operational progress.
3. Annual return on equity across the expanded capital base. This comprehensive metric reflects post-rebate trading margins, return on acquired assets, and equity dilution. Fiscal 2026 return on equity of approximately 13% serves as the baseline benchmark.3 Sustained improvement toward historic twenty-percent-plus levels would validate the strategic pivot, whereas persistence in the low teens would confirm that peak historical returns were primarily driven by favorable market conditions.
X. Epilogue & Outro
There is a version of the Share India story that is genuinely compelling. A regional sub-broker facing commission compression looked at the evolution of electronic markets and decided, well before most domestic peers, that future returns belonged to whoever owned capital and speed rather than client relationships. It listed on an SME platform to fund that pivot, graduated to the mainboard, acquired its primary software vendor at a modest price, and rode one of the largest derivatives booms in financial history. Few incumbents anywhere execute a transformation of that scale.
There is also a version that serves as a cautionary case study on the fragility of profits dependent on regulatory policy. When SEBI mandated that transaction charges be true to label, it did not question anyone's execution competence. It simply closed a fee differential between exchanges and brokers, and a meaningful slice of industry earnings vanished with it. The subsequent two years of flat profit on flat revenue provide the clearest evidence of how much historical performance reflected quantitative capability versus regulatory configuration.
Both versions contain truth, which is why evaluating the firm remains analytically complex. What can be stated with confidence is narrower than either extreme: Share India built a functioning automated trading operation, remains profitable without exchange rebates, is deploying capital into lending and wealth management adjacencies that are plausible but unproven at scale, and operates in an industry where the regulator holds far more power over profit pools than any participant does.
For founders and investors, three broader lessons emerge:
First, business models built on regulatory or structural rebates warrant lower valuation multiples than those built on customer pricing power, as policy mandates can alter revenue lines in a single quarter.
Second, vertical ownership of technology in latency-sensitive markets is essential for operational independence and cost control, but owning the execution stack is a defensive measure and a dependency removal, not automatically a standalone software business.
Third, when a cyclical financial firm raises equity near the top of a market cycle, the test of capital allocation is not whether the strategic narrative sounded coherent; it is whether earnings per share, years later, exceed pre-dilution levels.
That test, for Share India Securities, remains ongoing.
References
-
NSE Equity Profile & Regulatory Filings: SHAREINDIA — National Stock Exchange of India ↩↩
-
Share India Securities Ltd Stock Profile & Filings: 540725 — BSE ↩↩
-
Share India Securities Consolidated Financials, Ratios and Shareholding — Screener.in ↩↩↩↩↩↩↩↩↩↩↩↩↩↩↩
-
Share India Securities BSE SME IPO Prospectus & Details — Chittorgarh, 2017-09-28 ↩
-
Updated SEBI Study Reveals 93% of Individual Traders Incurred Losses in Equity F&O between FY22 and FY24 — Securities and Exchange Board of India, 2024-09-23 ↩↩↩
-
Share India set to disrupt the algo-trading and fintech industry with two strategic acquisitions — PR Newswire India, 2021-09-23 ↩
-
Share India Securities acquires 63.5% stake in Utrade Solutions — Business Standard, 2021-11-23 ↩↩
-
Share India Securities Limited Annual Report for FY 2025-26 — InvestyWise ↩↩↩↩↩↩
-
Share India Securities Ltd (BOM:540725) Q1 2027 Earnings Call Highlights — Yahoo Finance / GuruFocus, 2026 ↩↩↩↩↩↩↩↩↩↩↩↩↩↩↩
-
Share India Q1 Results FY27: PAT Rs 124 Cr, Revenue Rs 448 Cr — Univest, 2026 ↩↩↩↩
-
Share India's Silverleaf Merger Gets 99.83% Shareholder Vote — Multibagg Market Pulse ↩↩↩↩
-
NCLT Ahmedabad Sanctions Share India–Silverleaf Capital Merger — LiveLaw Biz, 2026-08-20 ↩↩
-
Share India Securities seeks approval for early redemption of ₹74.9 crore NCDs — ScanX ↩
-
SEBI's New Rules Drag Down Stock Brokers' Profits — Finology Select ↩
-
Study — Profitability of Individual Traders in the Equity Derivatives Segment (FY25–FY26) — Securities and Exchange Board of India, 2026-08 ↩↩
-
SEBI sees dip in derivatives turnover; 91% of retail traders lose money in FY25 — Business Standard, 2025-07-08 ↩
-
Share India Securities consolidated net profit rises 47.48% in the June 2026 quarter — Business Standard, 2026-07-25 ↩↩
-
Share India Securities Ltd — Shareholding, Promoters and Corporate Actions, Trendlyne ↩↩↩
-
Share India Securities Ltd — Financial Profile and Corporate Actions, Moneycontrol ↩
-
Share India Securities Reports Strong Q1 FY27 Performance with 47% Jump in Net Profit — EquityBulls, 2026 ↩
 LinkedIn
 WhatsApp
 Reddit
 Hacker News
 Email
Email Kindle
 RSS Feed
 Spotify
 Apple Podcasts
 Amazon Music
 Audible
 YouTube