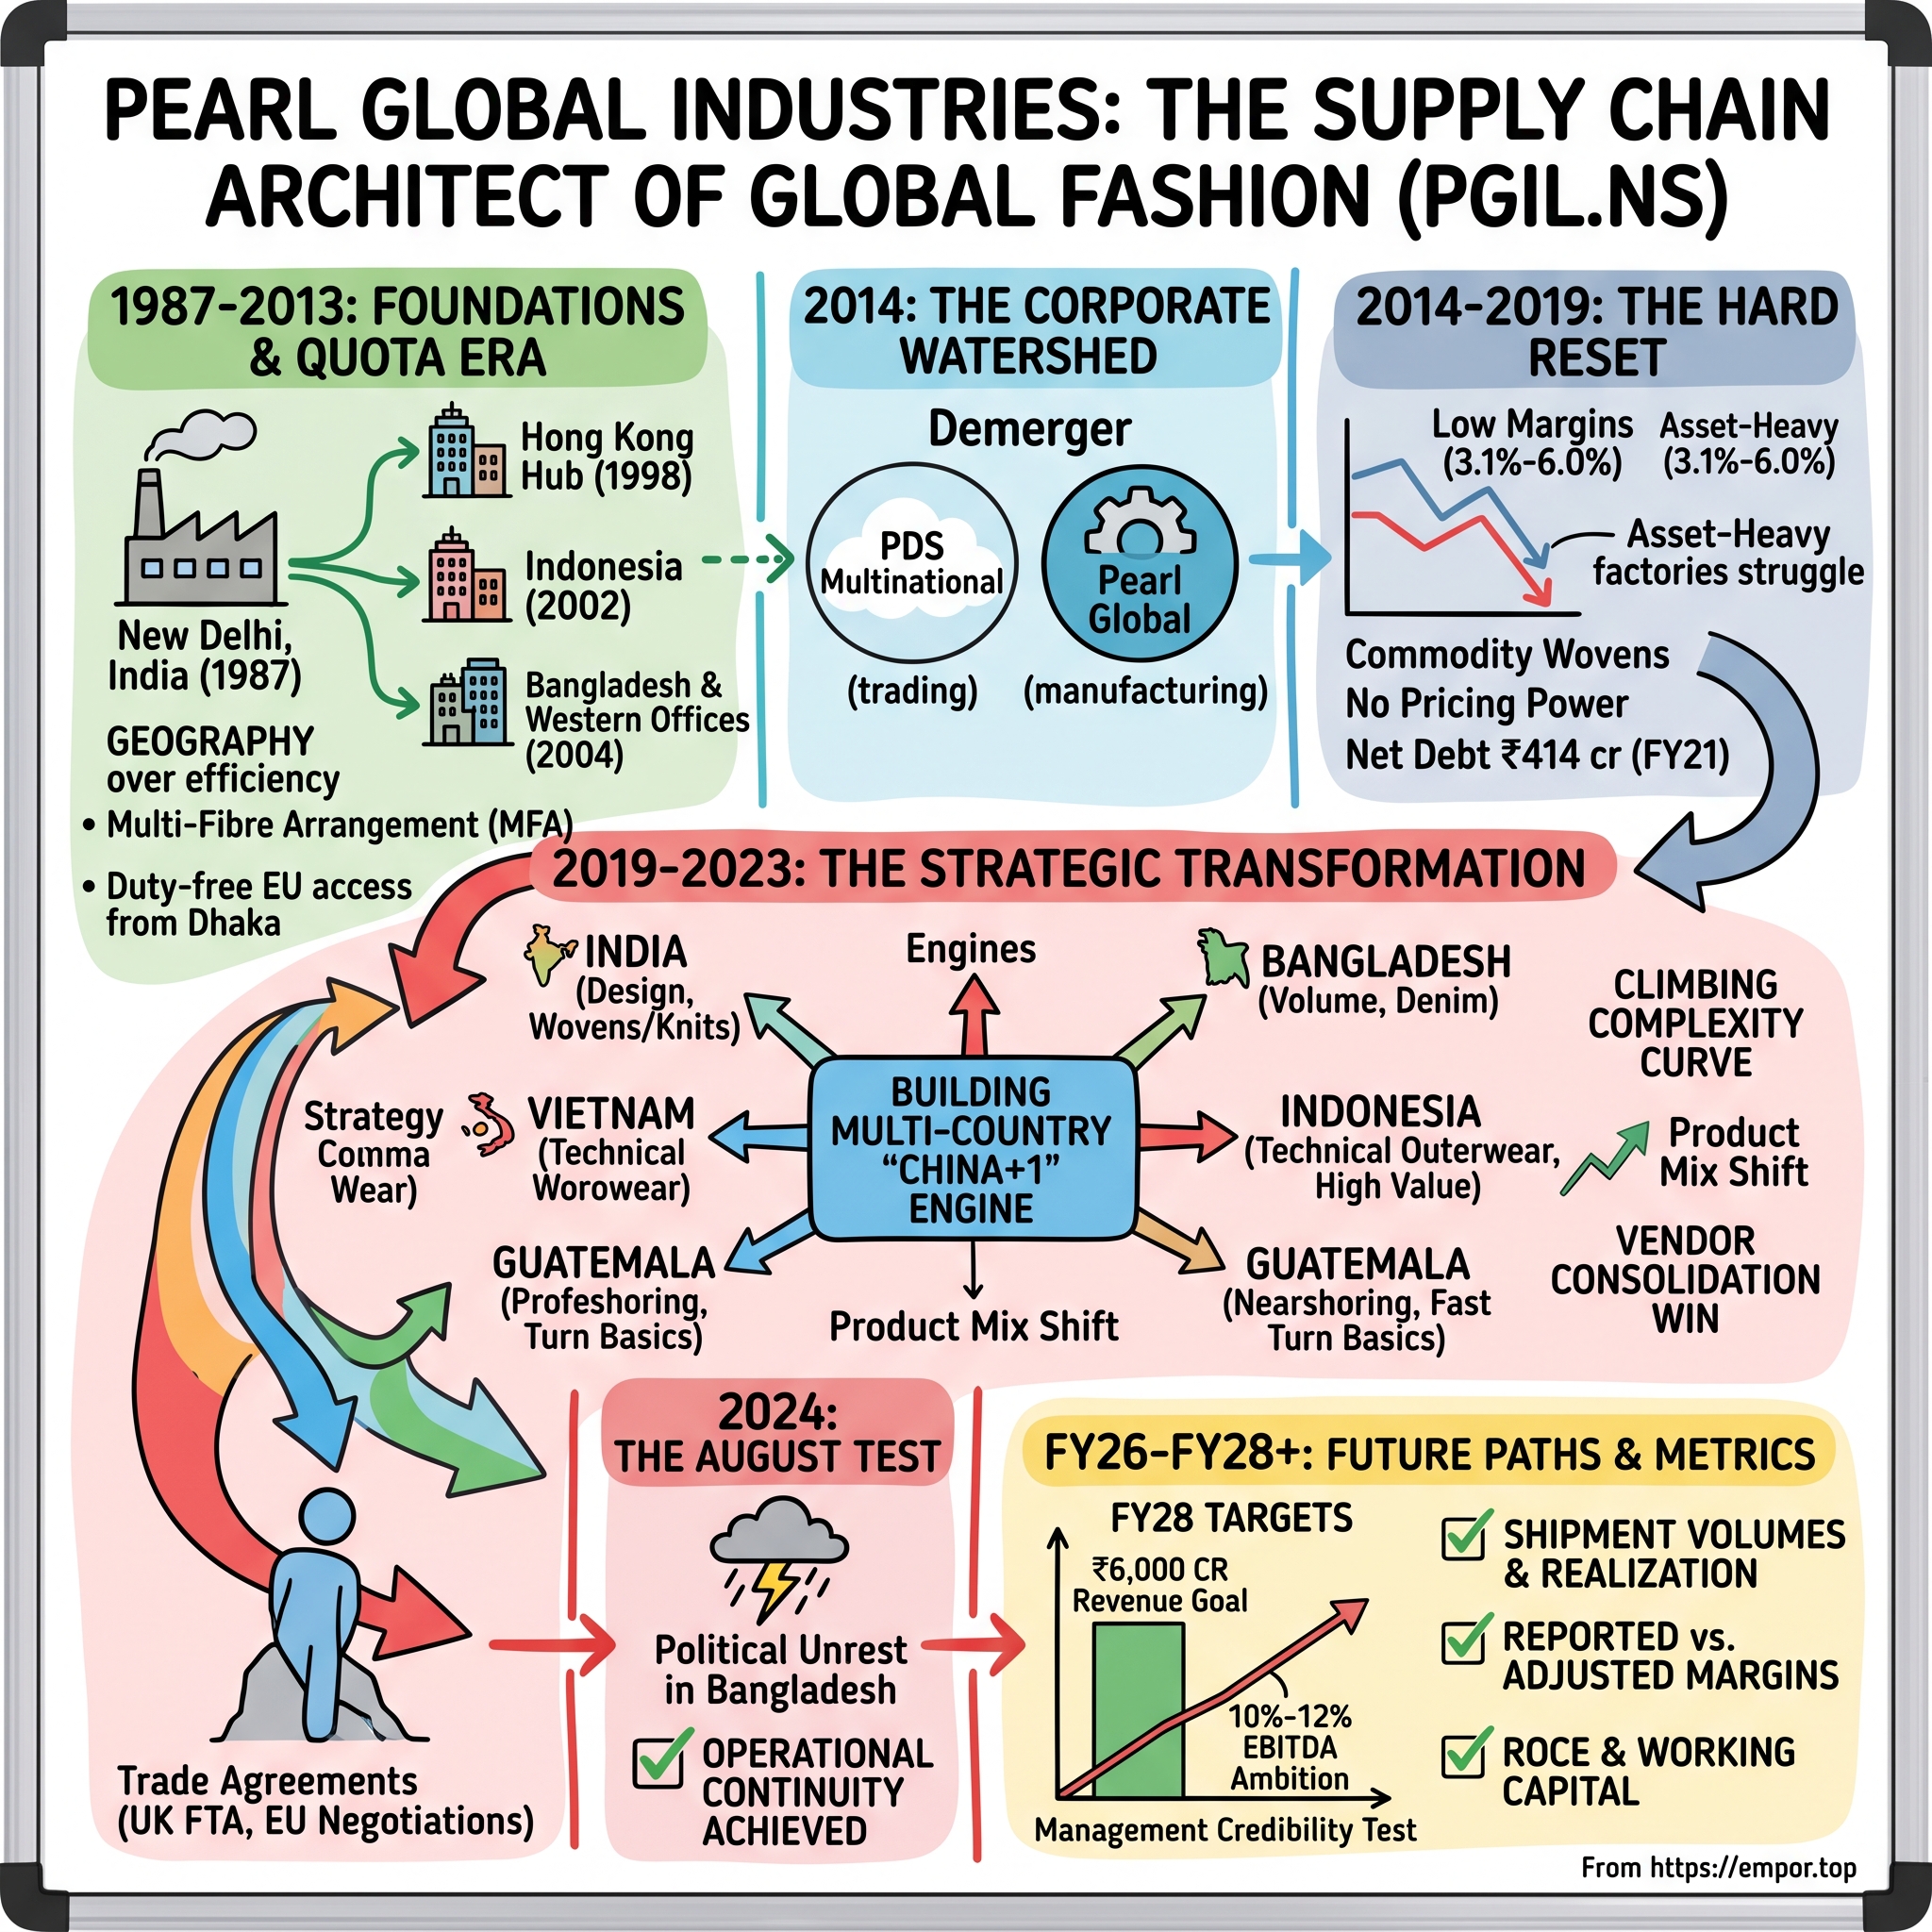
Pearl Global Industries: The Supply Chain Architect of Global Fashion
I. Introduction & Episode Roadmap
In May 2026, on a conference call with Indian sell-side analysts, the managing director of Gurugram-headquartered Pearl Global Industries addressed a delicate tension in the company's full-year results. The group had just crossed ₹5,000 crore in revenue for the first time—a milestone management had targeted for three years. Installed capacity surpassed 100 million garments a year, shipments reached a record 78.1 million pieces, profit after tax rose 17 percent to ₹270 crore, and the board declared the largest dividend in company history.1
Yet the headline margin barely moved. Adjusted EBITDA came in at 9.3 percent of revenue—twenty basis points higher than the prior year, but below management's stated ambition of 10 to 12 percent.1 Meanwhile, the India business—the company's home base and design hub—contracted: standalone revenue fell from ₹1,196 crore to ₹1,081 crore, and in the March quarter alone, India revenue dropped 23 percent year over year.23
The contraction stemmed from tariffs rather than lost competitiveness. For much of the fiscal year, Indian apparel entering the United States faced a duty stack that at its peak pushed effective rates on cotton garments toward 65 to 69 percent. American buyers responded by requesting vendors absorb part of the cost. On the second-quarter call, management said U.S. customers were requesting discounts of 14 to 15 percent to offset a 25 percent penalty tariff.4 Pearl Global absorbed roughly ₹36 crore over the year to keep those client relationships intact, along with ₹13 crore in losses at facilities still ramping up.2 Excluding those two items, management calculated an adjusted margin of 10.3 percent.2
This brings into focus the central question behind the company's strategy. Pearl Global Industries Limited (PGIL.NS on the NSE) has spent a decade building a structure unusual for an Indian garment exporter: manufacturing across five countries, design and sales offices in nine, a client list featuring major U.S. retailers, and the operational flexibility to shift purchase orders among Dhaka, Hanoi, Chennai, and Guatemala City depending on seasonal tariff advantages. Management calls this a multi-country model, while optimistic investors view it as a competitive moat.
Is it?
Five days after the latest shift in U.S. tariff policy, the evidence remains mixed and the test ongoing. On one hand, the company executed a significant financial expansion between FY21 and FY25: revenue roughly tripled from ₹1,491 crore to ₹4,506 crore, adjusted EBITDA expanded from ₹61 crore to ₹411 crore, net debt of ₹414 crore turned into a modest net cash position, and return on capital employed—by management's metric—rose from 5.5 percent to 30.5 percent.5 These results reflected a genuine operational turnaround.
On the other hand, in FY26—the first year the multi-country model faced a sustained shock directed at one of its key production origins—the group grew volumes by only about 5 percent, lost ground in India revenue, absorbed customer discounts, and delivered a consolidated margin below that of Gokaldas Exports, its closest listed Indian peer, which maintained 10.7 percent for the same year.6 Diversification mitigated the impact, but it did not provide full insulation.
The core investment thesis rests on three mechanisms: first, that major retailers will continue consolidating vendor lists around compliant, multi-country suppliers, leaving Pearl Global among the survivors; second, that moving from basic tops into outerwear and technical garments will steadily increase unit prices and customer retention; and third, that trade agreements signed by India—such as the completed UK deal and ongoing EU negotiations—will convert underutilized domestic capacity into higher-margin volume without fresh capital expenditure. Conversely, the case against centers on a structural reality: Pearl Global remains a contract manufacturer selling to far larger retail clients, and FY26 demonstrated that when trade costs escalate, buyers decide who absorbs them.
The narrative ahead traces this evolution. It begins in 1987 with a single facility in New Delhi under a quota regime that made geography more valuable than operational efficiency. It moves to 2014, when the founding Seth family divided the company, handing the asset-light trading business to one son and the manufacturing plants to the other—followed by five difficult years during which the standalone factory operations struggled. It examines how a professional managing director restructured the operating model between 2019 and 2023, testing its primary proof point during the collapse of Bangladesh's government in August 2024. It evaluates the Guatemala nearshoring strategy—highlighting its modest scale and operational friction—and analyzes the underlying economics, including items left undisclosed. It reviews management commentary across three years of earnings calls to evaluate consistency during margin pressures, concluding with a stress test, key falsifiers, and the critical metrics that will determine the outcome.
It begins with a quota system and a founder who understood that in global apparel, geography is the business.
 Subscribe on LinkedIn
II. Foundations & The Legacy Garment Exporter Era (1987–2013)
Understanding why Pearl Global exists in its current form requires examining a piece of global trade policy that no longer exists.
From 1974 until the end of 2004, global textile and apparel trade operated under the Multi-Fibre Arrangement—a system of country-by-country, product-by-product import quotas that developed nations used to ration garment imports from developing countries. The economic effect was distinct: because Western markets capped volume rather than price, the scarce asset in apparel manufacturing was not a factory, machinery, or a skilled workforce. It was a quota allocation tied to a specific country.
For three decades, garment manufacturing was fundamentally a game of geography and policy relationships rather than operational scale or unit cost. A manufacturer with capacity in a country holding unused quota had a viable business; one located where quotas were exhausted faced idle factories regardless of operational quality.
Deepak Seth commenced commercial operations of Pearl Global in 1987 with a single unit in New Delhi.7 This was India in the late License Raj—a period when machinery imports required extensive approvals, foreign exchange was rationed, and exports represented one of the few avenues for earning hard currency. Garment exports were a favored channel, turning the National Capital Region around Delhi into India's premier woven-garment cluster. Seth built inside that cluster, manufacturing for European and American fashion importers.
What distinguished the company early was not superior manufacturing efficiency, but a strategy to follow the global quota map outward rather than expanding solely within India.
In 1998 the company established a presence in Hong Kong—the trading and sourcing hub of Asian apparel, where East Asian fabric mills, trim suppliers, and agent networks converged.7 A Hong Kong desk provided access to Chinese and Taiwanese fabric at competitive regional prices—a crucial advantage given that fabric typically represents the single largest cost component of a garment. Operations expanded to Indonesia in 2002. In 2004, Pearl Global established import and distribution capabilities in the United States and the United Kingdom, and commenced its first Bangladesh operation.7
Evaluating those milestones against the trade policy calendar underscores the strategy. The MFA was set to expire at the end of 2004, an event that would eliminate quota rents and prompt global buyers to consolidate orders around low-cost, reliable production bases. An exporter relying solely on Indian quota allocations faced rapid devaluation of its business model. Seth responded by building multi-country operational flexibility prior to the transition. Bangladesh offered a structurally lower wage base than India alongside duty-free access to the European Union under preferential trade schemes for least-developed countries—a combination that eventually propelled Bangladesh to become the world's second-largest garment exporter.
The company listed on the BSE and NSE in 2007 and expanded its Bangladesh footprint again in 2011.7
The market dynamics that confronted Indian garment exporters between 2005 and 2013 explain the strategic anxiety that defined Pearl Global's subsequent trajectory. When quotas ended, global buyers consolidated orders where economics were most favorable. China absorbed massive market share across categories. Bangladesh, leveraging minimum wages well below peers and duty-free European access, captured high-volume knitwear. Vietnam, following its 2007 accession to the World Trade Organization and an influx of East Asian capital, secured technical apparel and outerwear. India—handicapped by higher wages than Bangladesh, smaller plant scales than China, restrictive labor regulations, and an absence of preferential trade agreements with major import markets—became a mid-cost producer with structural advantages limited largely to cotton availability and design capability.
This was the structural trap Pearl Global spent the next decade and a half attempting to escape, explaining why its strategic response was geographic rather than purely operational. Remaining solely an Indian exporter meant relying on a production origin that the global cost curve had relegated to the middle tier.
By the early 2010s, however, Pearl Global operated less as a unified corporate entity than as a loose federation. The group encompassed owned manufacturing facilities, a sourcing agency earning commissions on third-party production, distribution and brand licensing units in Western markets, and subsidiaries across Hong Kong, the UK, the US, and South and Southeast Asia—each with distinct working capital profiles, client bases, and operating economics.
Two businesses with conflicting capital structures were bound to a single balance sheet. Owned manufacturing was capital-intensive, requiring heavy investments in land, buildings, machinery, and working capital to cover fabric purchases months before receiving payment for finished goods. Sourcing and agency operations, by contrast, were asset-light intermediary services requiring minimal capital. Consolidating the two created financial statements that understated the performance of both: return on capital was weighed down by heavy manufacturing assets, while manufacturing metrics were diluted by lower-margin trading revenue.
Through the early 2010s, the company remained caught in a classic contract-manufacturing trap characterized by high capital intensity, fragmented operations, erratic working capital, and operating margins in the low-to-mid single digits. Pearl Global operated as a price taker in commoditized woven apparel, competing against lower-wage manufacturers in Bangladesh and Vietnam and massive scale in China. The group possessed geographic breadth, but lacked concentrated operational depth.
Resolving this tension required deciding which core business Pearl Global would pursue. In 2014, the founding family addressed the dilemma by splitting the company into two separate entities.
III. The Corporate Watershed: The 2014 PDS Demerger & The Hard Reset (2014–2019)
Corporate demergers in Indian family businesses are usually described in the language of "unlocking value." Occasionally that is even true. What makes the Pearl Global split unusual is that it was simultaneously a strategic restructuring and a succession decision, and the two were almost impossible to disentangle.
On 10 March 2014, the High Court of Delhi approved the spin-off of Pearl Global's sourcing, marketing, and distribution division into PDS Multinational Fashions. Shareholders received six PDS shares for every five Pearl Global shares held, and the new entity was capitalized at roughly ₹26 crore on 5 June 2014.8 Deepak Seth remained chairman of both boards. His elder son, Pallak Seth, took PDS. His younger son, Pulkit Seth, took Pearl Global.8
The asset split was clean in a way that revealed what each side prioritized. PDS received the capital-light operations: the sourcing network, agency relationships, brand licensing, and the design-and-order orchestration business that earns margins on third-party factories. Pearl Global retained the hard assets—the garment factories in India, Bangladesh, and Indonesia, along with the direct export contracts attached to them.7
For investors, the key aspect of the demerger was what it failed to fix.
The theory of a demerger is that each entity, freed from the other, will be valued on its own economics and managed by its own logic. That logic held for PDS, which grew into a large orchestration platform. For Pearl Global, however, the split exposed an underlying vulnerability that consolidation had previously obscured: on its own, the standalone manufacturing business struggled to generate strong economics.
The financial performance of the factory operations in the years after the split reflected these structural hurdles. Revenue grew from about ₹1,024 crore in FY15 to ₹1,758 crore in FY19, but operating margins fluctuated unpredictably between 3.1 percent and 6.0 percent. Net profit for FY18 stood at ₹23 crore—worse in absolute terms than four years earlier.13 This pattern is characteristic of a contract manufacturer lacking pricing power and fixed-cost absorption: when order volumes expanded, margins improved slightly; when demand softened, profits evaporated.
The physical dynamics of garment manufacturing explain why. A factory's cost structure is anchored by two fixed commitments: the physical facility and a skilled sewing workforce. Laying off sewing operators during a six-week lull risks losing them permanently to neighboring facilities, while retraining new workers depresses production efficiency for months. Consequently, a manufacturer facing a soft season must choose between two costly alternatives: operating at low capacity and absorbing fixed overhead, or taking low-margin orders that barely cover variable costs just to keep assembly lines running. Both erode profitability. The only sustainable path is securing an order book deep and diverse enough to maintain continuous plant utilization. In 2017, Pearl Global lacked that depth, offering standard products in a few locations to buyers with ample alternative suppliers.
The pressure intensified in FY21. Revenue fell to ₹1,491 crore, adjusted EBITDA dropped to ₹61 crore on a 4.1 percent margin, and profit after minority interest shrank to ₹17 crore. Return on capital employed dropped to 5.5 percent against net debt of ₹414 crore—a net debt-to-EBITDA ratio of 3.43 times.5 Given that Indian corporate borrowing rates in 2021 averaged in the high single digits, earning 5.5 percent on capital while paying higher interest on debt meant the company was eroding economic value—operating essentially to service debt obligations.
The underlying cause was clear within the industry. Pearl Global produced commodity wovens and basic tops in conventional manufacturing locations without the cost advantages of pure-play Bangladeshi exporters or the massive single-site scale of Chinese leaders. For comparison, global industry benchmark 申洲國際 Shenzhou International operates a vertically integrated model manufacturing its own fabric, generating over RMB 30 billion in annual revenue at gross margins near 26 percent.9 An exporter operating eight scattered Indian plants and a few Bangladeshi units could not compete on unit cost against that scale.
In response, the group restructured its leadership. Pallab Banerjee was brought in as managing director, while the founding family stepped back from daily operations while maintaining controlling ownership. The promoter group retained approximately 61 percent of equity, with Pulkit Seth moving to vice-chairman in a non-executive role and Deepak Seth serving as chairman.75
This governance setup warrants evaluation. Controlling ownership at 61 percent aligns family wealth with long-term equity value and insulates management from short-term market pressures. However, it also leaves minority shareholders unable to outvote the controlling family, makes related-party transactions harder to monitor independently, and leaves professional management accountable to board members who represent the controlling family. Assessing this structure depends on execution over time—specifically whether capital is deployed to maximize returns rather than scale, whether corporate disclosure improves, and whether independent oversight strengthens.
Banerjee shifted the operational focus. Rather than prioritizing order volume alone, management reoriented the strategy around product mix, geographic allocation, capital efficiency, and return on capital. Building that operating model required the next four years.
IV. The Strategic Transformation: Building the Multi-Country "China+1" Engine (2019–2023)
The economic distinction between a basic T-shirt and a padded winter jacket illustrates why product complexity dictates pricing power in contract apparel.
A basic knit tee requires only a few pieces of fabric joined by a handful of seams. Labor requirements are minimal, cycle times are short, and tens of thousands of factories globally can meet standard retail specifications. Price is the dominant variable: if a competitor in a lower-wage country offers the same garment for four cents less, the order moves.
A down-filled parka represents a far more complex manufacturing challenge. It requires an outer shell, lining, insulation injected into individual baffles at precise weights, seam-sealing, zippers, storm flaps, and dozens of components from disparate suppliers arriving in sync. Assembly requires multiple production steps under tight tolerances, restricting the pool of capable suppliers to hundreds rather than tens of thousands. Furthermore, once a retail brand audits a facility, establishes technical standards, and completes multi-season trials, switching costs become material—requalifying an alternative facility can easily cost a year.
Pearl Global’s operational shift from 2019 onward focused on climbing this complexity curve while distributing production across multiple countries. The two moves reinforced each other: complex garments raised unit prices and customer retention, while a multi-country footprint allowed the company to route production through whichever origin offered the lowest cost or fewest trade barriers at any given time.
By FY25, the group's footprint reflected this strategic division of labor. India operated eight in-house units with approximately 24.5 million pieces of annual capacity, focusing on woven and knit tops, dresses, shirts, women's fashion, children's wear, and sleepwear—while hosting the group's central design hub and a low-cost expansion into Bihar. Bangladesh served as the high-volume engine, combining four in-house units and five partner-managed facilities to deliver 54.8 million pieces of annual capacity—representing over half the group total—across knits, wovens, denim, sleepwear, loungewear, and activewear at a group-leading blended utilization rate of 87.7 percent. Vietnam operated as the technical specialist; despite its modest capacity of 6.5 million pieces, it concentrated on high-value outerwear including down jackets, woolen coats, seam-sealed jackets, puffers, parkas, blazers, and anoraks. Indonesia produced women's professional attire, performance wear, woven tops, and loungewear across roughly 4.1 million pieces of capacity. Guatemala, the newest addition, accounted for 3.3 million pieces focused on polo shirts, heavy and lightweight knits, bottoms, and denim.7
Consolidated capacity reached 93.2 million pieces across 25 manufacturing units in five countries, supported by design and sales offices in nine nations and a workforce exceeding 28,000 employees.7
This structure created a specialized, asymmetrical network: Bangladesh provided volume, Vietnam generated higher per-garment margins, and India housed the core intellectual property and design capabilities. Consequently, political or economic disruptions in any single origin affected the business differently. A disruption in Bangladesh threatened volume; a shock in Vietnam imperiled product mix and margins; and a setback in India—as demonstrated in FY26—damaged the company's highest-touch, design-driven operations.
This architecture underpinned a distinct commercial pitch. A merchandising executive at a major U.S. retailer placing seasonal orders for millions of garments seeks to avoid managing separate tenders, compliance audits, quality standards, and shipping documentation across multiple suppliers in different countries. Pearl Global allowed buyers to place master orders with a single partner that managed design and raw material sourcing, while dynamically allocating production among facilities in Chittagong, Bac Giang, Chennai, or Guatemala City based on tariffs, lead times, and available plant capacity.
This model operationalized the "China+1" strategy—which evolved to include "Bangladesh+1" after 2024. As global retailers sought to reduce reliance on Chinese manufacturing amid geopolitical tensions and duties, Pearl Global offered to absorb shifted order volumes without requiring buyers to onboard new vendor accounts.
An additional operational advantage shows up in financial execution. Controlling both design and fabric relationships grants the manufacturer earlier visibility into seasonal order books than pure contract sewers enjoy. Early visibility allows the company to secure fabric, optimize line loading, and select the optimal manufacturing origin well in advance. Design capability is thus a strategic asset, generating the informational lead time required to arbitrage geographic advantages across the network. Pearl Global deployed roughly 75 designers globally and utilized 3D rendering software—including Optitex, CLO, and Browzwear—to iterate from concept to approved sample without physically shipping prototype garments.7 The commercial promise of "concept to store" gave management control over origin selection rather than passive acceptance of client instructions.
The Indian footprint warrants specific examination as both a strategic anchor and an operational vulnerability. Beyond established facilities around Gurugram, Chennai, and Bengaluru, the company expanded into Muzaffarpur, Bihar—a region offering significantly lower wages than traditional textile hubs alongside state subsidies designed to attract industrial employment.7 The rationale was straightforward: if Indian manufacturing could not match Bangladeshi labor costs from Delhi or Chennai, it might bridge the gap in Bihar. However, establishing a greenfield facility in a region lacking a mature garment manufacturing ecosystem requires years to train labor and build managerial capacity. Consequently, Bihar joined Guatemala as a recurring drag on earnings, appearing on management's list of loss-making new operations for three consecutive years.32 Low nominal wages generate cost advantages only after labor reaches baseline productivity.
The August 2024 test, examined honestly
The primary operational test of this multi-country model occurred during political upheaval in Bangladesh in late 2024.
Following the resignation of Prime Minister Sheikh Hasina on 5 August 2024, civil unrest swept through the industrial belts surrounding Dhaka. Garment factories across Ashulia and Savar suspended operations to protect assets, telecommunication outages delayed export documentation, and global apparel brands warned of supply chain disruptions.10 The operational damage persisted beyond the immediate crisis, with hundreds of facilities across major industrial zones closing permanently over the subsequent year due to cancelled orders.10
In FY25 results reported in May 2025, Pearl Global disclosed total shipments of 74.3 million pieces—a 30 percent increase over the 56.9 million pieces shipped the prior year—despite operating through the severe industry downturn in Bangladesh.3 Vice-Chairman Pulkit Seth noted that "despite early-year disruptions in Bangladesh, we maintained operational resilience, achieving our highest-ever shipment volumes without any delays."3
While these results demonstrated operational continuity, two analytical caveats qualify management's narrative. First, Pearl Global provided no detailed operating metrics regarding how many orders were physically reassigned from Bangladesh to alternative facilities, the incremental air freight or margin costs incurred by those transfers, or the duration and extent of capacity downtime in Dhaka. Consequently, the assertion that multi-country flexibility was the primary driver of performance rests on management narrative rather than verifiable segment data. Second, Bangladeshi facilities operated at an 87.7 percent blended utilization rate in FY25—the highest across the group.7 Operating a primary production center near full capacity allows temporary buffers through overtime and accelerated scheduling during brief disruptions, but offers limited flexibility to absorb prolonged crises.
The multi-country strategy functions less like complete risk immunity and more like insurance with an operational deductible. That reality became clear when tariff shocks subsequently impacted the Indian operations—a geography hosting the group's design center, corporate leadership, and fixed overhead that could not be easily shifted elsewhere.
Prior to that test, however, the company executed its most debated capital allocation decision, entering a market nine thousand miles from its primary Asian manufacturing hub.
V. Nearshoring & M&A: The Guatemala Acquisition & The Asset-Light Playbook
The strategic pivot to nearshoring addressed a distinct operational crisis. Between 2021 and 2022, American retailers experienced a severe supply chain bullwhip effect. Erratic pandemic-era demand, soaring ocean freight rates, and unprecedented port congestion extended standard 60-to-90-day lead times from Asian factories into unpredictable delays. Retailers responded by over-ordering, leaving them burdened with excess inventory in 2022 and forcing steep markdowns.
The lesson for American buyers was clear: speed carries significant option value. Garments manufactured in Central America can reach a U.S. warehouse within weeks rather than months and, under the Dominican Republic-Central America Free Trade Agreement (CAFTA-DR), enter duty-free if they meet specific rules of origin. Nearshoring does not replace Asia for bulk seasonal buys—where production costs remain lower and fabric ecosystems far deeper—but it offers crucial flexibility for fast-turn inventory replenishment, where restocking key sizes in three weeks yields greater value than trimming minor unit costs.
Capturing CAFTA-DR duty-free access, however, is subject to strict operational constraints governed by the "yarn-forward" rule. To qualify for duty-free entry into the United States, a Guatemalan-assembled garment must use yarn spun and fabric knitted or woven within member nations—Central America, the Dominican Republic, or the United States. Importing fabric from an Asian mill for assembly in Guatemala forfeits duty exemption, subjecting the finished garment to standard tariffs.
Consequently, nearshoring depends heavily on regional supply chain depth. Central America's textile ecosystem is concentrated largely in basic cotton knits—matching the output of Pearl Global's Guatemalan operations across polo shirts, heavy and lightweight knits, bottoms, and denim.7 Pearl Global cannot replicate its specialized Vietnamese outerwear operations in Guatemala because technical shells, synthetic insulation, and specialized trims are unavailable within the CAFTA-DR trade zone. Nearshoring expands the group's capacity for fast-turn basic apparel, but it does not extend its complex, high-value product lines.
To secure this regional footprint, Pearl Global established a presence in Guatemala, though public accounts of the transaction frequently misstate the deal's structure and scale.
Myth versus reality on the Guatemala deal
Market narrative frequently conflates two distinct transactions into a single acquisition, suggesting Pearl Global acquired "Alpha Apparel" in Guatemala in 2023 at half its annual sales. In reality, management executed two separate investments in different geographies.
Alpha Clothing Ltd is a Bangladeshi manufacturer. Pearl Global agreed to acquire a 52.11 percent stake in the business on 21 April 2022 for approximately US$1.05 million, adding roughly 8 million pieces of annual capacity in Bangladesh alongside LEED Gold certification and established buyer approvals that enabled immediate operational integration.11
The Guatemalan transaction was a much smaller investment. On 27 June 2023, Pearl Global agreed to acquire 55 percent of Pearl GT Holdco Ltd for US$550,000, funded through internal accruals. Pearl GT Holdco serves as the holding entity for two Guatemalan operating companies, Shoretex Sociedad Anónima and Corporación de Productos y Servicios Asociados. At acquisition, these entities generated approximately US$3.8 million in annual revenue across three production lines. Management outlined a plan to deploy up to US$2 million in additional capital expenditure to expand capacity to twelve lines, targeting eventual annual revenue of roughly US$20 million.12
The transaction represents a low-cost entry rather than the purchase of an established production hub: a controlling stake in a three-line facility for just over half a million dollars, granting an option for future expansion. Structured like an initial venture check, this approach limited financial downside to a fraction of group earnings—at a time when Pearl Global generated ₹258 crore in adjusted EBITDA—while establishing a physical footprint nine time zones from its primary hub.5
Operational integration, however, proved more challenging than acquisition. Guatemala operated at a group-low 38 percent blended capacity utilization in FY25.7 The facility featured repeatedly in management's margin disclosures, beginning as part of new-facility operational losses that reduced Q4 FY25 consolidated margins by roughly 80 basis points,3 continuing in FY26 as part of a ₹13 crore drag from expanding units,2 and persisting on the Q2 FY26 call as an unprofitable operation diluting group profitability.4 On the FY26 full-year call, management reported positive momentum under a restructured strategy, projecting operational breakeven during FY27.2
For investors, this timeline represents a key test of execution credibility. Achieving breakeven will have taken three to four years from initial investment. Should the FY27 target slip, it would signal that establishing Central American manufacturing presents structural hurdles for Asian management—specifically regarding labor dynamics, retention, and supervisory practices—mirroring challenges faced by other Asian garment producers expanding into Latin America and Africa.
The asset-light model, and what it actually is
A more significant capital allocation strategy was Pearl Global's adoption of its asset-light partnership model.
Under this framework, Pearl Global supplies working capital, design capabilities, fabric procurement, and on-site industrial engineers responsible for quality assurance and compliance monitoring. The manufacturing partner funds factory capital expenditures and direct labor costs, receiving compensation on a contracted per-piece basis.7
This structure shifts fixed assets and labor liabilities to local partners while Pearl Global retains high-margin capabilities: client relationships, design IP, and supply chain orchestration. In effect, the company leases assembly capacity on a variable-cost basis while capturing value-added margin.
By FY25, the group's network comprised sixteen owned facilities and nine partner-managed units. Partner facilities were concentrated in established regions, with five located in Bangladesh and four in Vietnam.7 This distribution demonstrates that Pearl Global deploys the partnership model primarily to expand output rapidly within labor markets where it already possesses deep operating experience.
The financial impact of this structure was visible across key balance sheet metrics. Between FY21 and FY25, group revenue nearly tripled while net debt transitioned from ₹414 crore to a net cash balance, and return on capital employed—by management's metric—rose from 5.5 percent to 30.5 percent.5 Working capital compressed from 67 days to 38 days over the same period, driven primarily by debtor days falling from 59 to 26 as the company tightened terms with major U.S. retail clients.5
Two analytical caveats qualify these financial metrics. First, management's ROCE formula incorporates cash earmarked for letter-of-credit payments into capital employed alongside equity and net debt.5 Independent financial databases calculated an FY26 ROCE of 20 percent, compared with management's reported 28 percent.213 While both metrics reflect valid methodology, investors evaluating return trends should recognize that management's formula yields a higher return profile than standard accounting benchmarks.
Second, joint ventures and non-wholly owned subsidiaries divert a portion of consolidated earnings away from parent shareholders. Pearl Global reports profit after minority interest to reflect this distinction, holding 55 percent of its Guatemalan entity and 52 percent of Alpha Clothing.1112 Consequently, consolidated EBITDA overstates the earnings attributable directly to parent shareholders—a difference that remains modest today but will expand if partnership arrangements grow as a proportion of total volume.
While this asset-light framework successfully expanded physical capacity, the broader question remains whether that capacity yields sustainable economic returns.
VI. Core Business Economics: Segment Breakdown, Competitive Landscape, & Operational Mechanics
Let us begin with a confession the company itself makes only implicitly: Pearl Global does not tell you very much about where its money comes from.
The geographic revenue disclosure in the corporate presentation is a two-way split — India versus Rest of the World. In FY25 that was ₹1,196 crore from India and ₹3,310 crore from everywhere else.7 There is no published country-by-country revenue breakdown, no disclosed EBITDA by geography, and no revenue split by product category with associated margins. What the company does publish is capacity and utilization by country, blended volume, and a product split by value between wovens and knits.
This matters because the widely circulated claims about this business — that Vietnam contributes 25 to 30 percent of revenue, that outerwear generates 30-plus percent gross margins, that the top five customers are 55 to 60 percent of sales — are not sourced to company disclosure. They are estimates, and some are hard to reconcile with what is disclosed. Vietnam held 6.5 million pieces of the group's 93.2 million pieces of FY25 capacity.7 For Vietnam to be a quarter of group revenue, its average realization per garment would need to be roughly four to five times the group average. Down jackets do carry multiples of a T-shirt's price, so it is not impossible — but it is an inference, not a fact, and an investor should treat it as one.
Here is what can be said with confidence from published numbers.
Volume and realization. The group shipped 56.9 million pieces in FY24, 74.3 million in FY25, and 78.1 million in FY26, with a record 22.0 million in the March 2026 quarter alone.31 Set those against revenue of ₹3,436 crore, ₹4,506 crore and ₹5,025 crore.5 The arithmetic tells a clear story about how the character of growth changed. FY25 was a volume year: pieces rose about 31 percent and revenue rose 31.1 percent, meaning average realization per garment was essentially flat.3 FY26 was the opposite: volumes rose about 5 percent while revenue rose 11.5 percent, so realization per piece rose meaningfully.1 Management confirmed the volume slowdown directly on the Q2 FY26 call, noting first-half volume growth of just 3 percent against 30 percent in the prior year.4
That divergence is the single most informative operating fact of FY26. It says the mix genuinely moved up — toward higher-value garments and higher-value origins — at the same moment the company was granting tariff-related discounts to American buyers. Both were happening, and the mix improvement was large enough to more than offset the discounting on the revenue line. What it did not do was offset it on the margin line, which is why adjusted EBITDA margin landed at 9.3 percent rather than the 10-plus that the mix shift alone would imply.1
Utilization, which is the ceiling on operating leverage. Blended group utilization was 79.6 percent in FY25 — Bangladesh at 87.7 percent, India 78.3 percent, Vietnam 62.7 percent, Indonesia 38.8 percent, Guatemala 38.0 percent.7 By FY26 Vietnam had improved from about 63 percent to above 80 percent and Indonesia from about 39 percent to 47 percent.2 Those are real gains and they are where incremental margin comes from: in garment manufacturing, the marginal piece produced on an already-staffed line carries very high contribution margin.
But notice management's own FY28 framing: installed capacity of 125 to 130 million pieces with roughly 100 million pieces actually shipping.2 That is a structural utilization assumption of about 77 to 80 percent — no better than FY25. The company is not, by its own guidance, planning to run tighter. It is planning to run wider. Which is a defensible strategy for a business selling optionality across origins, but it means investors should not model a large utilization-driven margin unlock.
Customers. The published customer roster is genuinely impressive and spans department stores, specialty retail, fast fashion and off-price: Gap, Old Navy, Kohl's, Macy's, Target, Ralph Lauren, PVH's Tommy Hilfiger and Calvin Klein, Chico's, Ann Taylor, Loft, American Eagle Outfitters, Primark, Next, Zara, Bershka, Mango, 無印良品 MUJI, Walmart, Nordstrom, Belk, JCPenney, Ross, TJ Maxx, Aritzia, Talbots, Levi's, and Australian chains including Target Australia, Kmart Australia and Big W.7
Concentration is not disclosed as a top-five percentage. What is disclosed is the tenure mix: about 60 percent of FY25 revenue came from customers of five years or more, 40 percent from newer relationships, and customers acquired in the preceding five years grew from 4.7 percent of revenue in FY19 to 40 percent in FY25.7 On the FY26 call management identified 無印良品 MUJI as contributing roughly US$65 million annually and positioned it as a top-six customer.2 Against group revenue of about US$521 million for FY26, that implies a single customer at roughly an eighth of the business — which, if MUJI is indeed only sixth-largest, suggests the top five are collectively very substantial.14
The strategic wind at the company's back here is real and is worth naming precisely. Large retailers have spent the past decade cutting vendor lists — going from a hundred-plus factories to a much smaller set of strategic partners who can pass ESG and labor audits, provide traceability documentation, and handle multiple categories across multiple countries. Pearl Global has invested visibly in exactly the qualifying infrastructure: garment-level QR coding through cutting, production, washing and finishing; a documented cotton traceability chain from ginning through spinning, knitting or weaving, processing and manufacture; and water-reduction technology in denim washing.7 These are not marketing items. They are the entry ticket to a consolidated vendor list, and they are a genuine barrier to a smaller competitor.
Second-layer diligence: what sits under the reported numbers
Four things are worth flagging that do not appear in the headline results.
Minority interest is not trivial and it grows with the model. The company reports profit after minority interest precisely because several operating entities are not wholly owned — 55 percent of the Guatemala holdco, about 52 percent of Alpha Clothing in Bangladesh.1211 The gap matters: FY25 consolidated profit after minority interest was ₹248 crore on the company's reporting, while Screener's consolidated net profit line for the same year shows ₹231 crore, a reminder that different profit definitions circulate for this company and that consolidated EBITDA overstates what accrues to the parent.313 As partner-managed and majority-owned capacity expands, this wedge widens.
Credit quality has improved faster than margins. The move from BBB stable in 2021 to A stable with A1+ short-term by 2026 is a three-notch upgrade in five years.2 Rating agencies weight balance-sheet resilience and cash conversion more heavily than profitability, and on those measures the company genuinely transformed. It is a useful independent check on management's claims — and a reminder that the debt market's view of this business is considerably more settled than the equity market's.
Labor and compliance risk is a live operating exposure, not an ESG checkbox. More than half the group's capacity sits in Bangladesh, an industry where a single audit failure, a wage dispute or a building-safety incident can cost a Tier-1 customer relationship outright. The traceability infrastructure and the environmental investments — the waterless denim finishing process the company claims reduces water use by 85 percent in the relevant steps — are best read as the price of remaining on consolidated vendor lists rather than as differentiation.7 Competitors are building the same thing.
Cyclical working capital is the swing factor in cash flow. Inventory days ran 73 at March 2021, fell to 53 by March 2024, and drifted back to 57 by March 2025; debtor days more than halved over the same window.7 A garment exporter's cash position is essentially a function of how well it forecasts fabric needs. When mix shifts toward complex outerwear with longer-lead-time components, inventory naturally lengthens — so some working capital expansion is the cost of the strategy, not evidence of sloppiness. The discipline is to distinguish the two, which requires watching inventory days and shipment volumes together.
The competitive set, honestly benchmarked
The most useful way to judge whether Pearl Global's model is producing an advantage is to put its numbers beside the people it competes with.
Gokaldas Exports is the closest listed analogue: an Indian garment exporter that has also diversified abroad, in its case toward Africa and the Middle East, and has also moved into outerwear and jackets. For FY26 Gokaldas reported total income of ₹4,065 crore, up 4 percent, with EBITDA of ₹434 crore at a 10.7 percent margin — down just 15 basis points despite the same US tariff headwind.6 Pearl Global grew revenue far faster (11.5 percent versus 4 percent) but at a lower margin (9.3 percent versus 10.7 percent).16 The multi-country model is delivering growth. It is not, on this evidence, delivering superior profitability against the most comparable Indian peer.
KPR Mill is the vertical integration counter-argument. FY26 revenue of ₹6,377.64 crore, up 3.9 percent, EBITDA of ₹1,401.20 crore at a 20.65 percent margin, and net profit of ₹866.50 crore.15 KPR earns roughly double Pearl Global's margin because it owns the value chain from yarn spinning through fabric to finished garment, plus adjacent businesses. The trade-off is concentration: it is a South India operation, exposed to a single country's cost structure, wage inflation and trade treatment. FY26 was the year that trade-off bit Indian producers, and KPR's revenue grew barely faster than inflation.
申洲國際 Shenzhou International is the global ceiling. Calendar 2025 revenue crossed RMB 30 billion for the first time, up 8.13 percent, with gross margin around 26.3 percent and net profit of RMB 5.8 billion, though profit fell 6.7 percent on foreign exchange losses and a prior-year disposal gain.9 Sportswear was 67.7 percent of revenue.9 Shenzhou's model is deep vertical integration plus enormous scale concentrated on a handful of athletic mega-brands — the opposite of Pearl Global's wide-and-shallow customer diversification. It earns higher margins; it also carries the risk that comes with depending on a small number of very powerful buyers.
Shahi Exports, India's largest garment exporter, is privately held with correspondingly limited public disclosure. 晶苑國際 Crystal International, the Hong Kong-listed multi-country manufacturer, is the closest structural analogue to what Pearl Global says it wants to become — multi-category, multi-country, serving global brands from a diversified footprint.
Put the set together and a fair conclusion emerges. Vertical integration is the reliable route to high margins in this industry; geographic diversification is the reliable route to resilience and to share gains during trade dislocation. Pearl Global has chosen the second. In FY26 that choice produced faster growth than its peers, weaker margins than the integrated players, and — the point of the whole exercise — an intact customer base through a year that damaged the industry.
Whether the choice compounds depends heavily on the people making it, which is where we go next.
VII. Management Forensics, Capital Allocation, & Conference Call Analysis
Reading three years of Pearl Global's earnings calls in sequence produces an unusual impression for an Indian mid-cap: the story does not change much.
That sounds like faint praise. It is not. The most common failure mode in this market segment is narrative drift — a company that talks about capacity in one year, market share the next, and a new adjacency the year after, with each shift conveniently explaining why the prior year's target was missed. Pearl Global's management has repeated the same four things across quarters: asset-light capacity addition through partnerships, climbing into higher-value categories, deepening wallet share with existing marquee customers rather than chasing new logos, and a stated destination of ₹6,000 crore of revenue by FY28 at a 10 to 12 percent EBITDA margin.24
The target itself has been reiterated rather than revised. On the Q2 FY26 call, in the middle of the tariff shock, management maintained the ₹6,000 crore FY28 goal and the capacity expansion to 110–115 million pieces.4 On the Q4 FY26 call, management restated ₹6,000 crore by FY28, framed it as a 12 to 14 percent revenue CAGR, and put the capacity destination at 125–130 million pieces installed.2 Holding a number through a bad year, rather than quietly resetting it, is a form of accountability — and it also creates a hard, checkable test. Getting from ₹5,025 crore to ₹6,000 crore over two years requires roughly 9 percent annual growth, which is below the 12 to 14 percent CAGR management describes. That gap is worth watching; either the target is conservative, or the CAGR framing is measured from a base other than FY26.
The incentive question, and what is not published
Before assessing behavior, it is worth naming what an investor cannot see. Pearl Global does not publish, in any of the investor materials reviewed for this piece, the performance conditions attached to executive compensation or to the ESOP grants whose expense is routinely excluded from adjusted EBITDA. The claim that pay is tied to consolidated return on capital and margin thresholds rather than to revenue growth is a reasonable inference from how management talks about the business, but it is not a disclosed fact — the detailed remuneration criteria appear only in the statutory annual report and were not verified here. Similarly, while the promoter group's aggregate holding of 61.11 percent is public, the individual family members' stakes within that block are not confirmed by the sources used here.13
That matters because incentive design is the mechanism that converts a stated strategy into consistent behavior. A management team paid on revenue will add capacity in any geography that will take it. A team paid on return on capital will leave a bad expansion on the table. The observable evidence — capex funded from operating cash flow, a partnership model that deliberately keeps assets off the balance sheet, a Guatemala entry sized at half a million dollars rather than fifty million — is consistent with the second. But it is evidence about outcomes, not about the contract that produced them, and an investor should hold the two apart.
Where management has been candid, and where it has been convenient
The candid part is specific and to management's credit. Rather than burying the drag from immature facilities in unallocated overhead, the company has quantified it repeatedly: Q4 FY25 consolidated adjusted EBITDA of 9.7 percent rising to 10.5 percent excluding losses at Guatemala and Bihar;3 9M FY26 margins of about 9.0 percent rising to about 10.1 percent after adjusting for roughly ₹31 crore of tariff impact and about ₹11 crore of ramp-up costs;16 full-year FY26 margins of 9.3 percent rising to 10.3 percent after ₹36 crore of tariff and ₹13 crore of new-facility losses.2 Named facilities, quantified amounts, consistent methodology across quarters. Analysts can therefore audit the bridge, which is the whole point of disclosure.
The convenient part is that the "adjusted" number has been the headline for three straight years while the adjustments keep recurring. Adjusted EBITDA excludes ESOP expense as a matter of routine — a real economic cost to shareholders, however non-cash. Layered on top are new-facility losses that have been present since FY24 and tariff costs present through FY26. A skeptic's framing is straightforward: a company whose margin is 10.3 percent before items it incurs every year has a 9.3 percent margin. Management's framing is that these are transitional and will not recur at this scale. Both statements are true; the investor's job is to notice that the reported number has not yet caught up to the adjusted one, and to set a deadline.
Management's own words on the FY26 call gave one: "We are pretty confident at this stage to really maintain 10% EBITDA for the full year as we start FY 2027," alongside a trajectory toward 10 to 12 percent.2 That is a specific, falsifiable commitment on a reported basis, and FY27 is the year to check it against.
Capital allocation
The spending discipline is visible in the numbers rather than in rhetoric. FY26 capex was ₹250 crore, committed and expected to complete in the first half of FY27, with a further ₹200–250 crore planned for FY27 across geographies, including a Bangladesh expansion adding six to seven million pieces by FY28.2 Against FY26 operating cash flow of roughly ₹398 crore, that is capex funded from the business rather than the balance sheet.13
The balance sheet trajectory has been the cleanest part of the story. Net worth rose from ₹530 crore at March 2021 to ₹1,146 crore at March 2025 and ₹1,438 crore at March 2026, while cash and bank balances excluding letter-of-credit-earmarked funds rose from ₹109 crore to ₹513 crore and then ₹634 crore.51 Net debt to EBITDA fell from 3.43 times to a slightly negative figure by March 2025.5 The credit market ratified this: the long-term rating moved from BBB stable in 2021 to A stable by 2026, with the short-term rating at A1+.2 A three-notch upgrade over five years is an independent third party agreeing that the business became structurally more durable, not just more profitable.
Two things temper the picture. Gross borrowings stood at about ₹943 crore at March 2026 against ₹634 crore of cash, meaning the group carries meaningful gross debt — much of it the packing credit and working capital lines that any garment exporter runs — and the net position has moved back from net cash as capex stepped up.131 And Screener's data shows promoter holding has drifted down by roughly 5.5 percentage points over three years to 61.11 percent, with domestic institutions now at 19.16 percent and foreign institutions at 6.82 percent.13 Some of that reflects ESOP issuance rather than promoter selling, but it is worth tracking, because promoter behavior in a 61-percent-held company is one of the few governance signals minority holders actually get.
Shareholder returns have moved in the right direction alongside. FY25's total dividend of ₹11.50 per share represented a 22.9 percent payout, and FY26's ₹14.50 per share — 290 percent of face value — took the payout to about 25 percent of group profit, the highest in the company's history.31 Governance was strengthened by the induction of independent directors Rahul Mehta Narendra and Jyoti Arora during FY25,3 and the 37th AGM on 20 July 2026 approved the appointment of Rajesh Kumar Singh as a further independent director.17
What analysts have actually pushed on
The pressure points on recent calls have been consistent and legitimate: the margin impact of the US tariff regime and how much of it is permanent; when Guatemala reaches breakeven; whether India can recover the volume it lost to tariff-driven customer diversification; and how much visibility the company genuinely has on forward orders.
The answers have been mostly concrete and occasionally uncomfortable in a useful way. On tariffs, management did not claim the cost would disappear, saying instead that the ₹36 crore burden may reduce but would not reach zero.2 On order visibility, management acknowledged that strategic discussions with customers provide some forward view but that there are no long-term volume commitments — a candid admission that this business, for all its relationship depth, still runs season to season.2 On India, management attributed the 23 percent Q4 revenue decline to customers diversifying away from Indian origin during the tariff period, and pinned recovery to tariff normalization plus the India–UK and prospective India–EU trade agreements.2
There is one exchange from the FY26 call that captures the company's position better than any metric. Asked about the trajectory of the tariff burden, management did not offer the reassuring answer. It said the cost may reduce but would not go to zero, and separately described the Section 122 arrangement then in force as running only "through July."2 A management team optimizing for the share price would have talked about normalization. This one told analysts the meter was still running and that the statutory clock had a date on it. That is a small thing, and it is the kind of small thing that accumulates into credibility.
The counterweight is that credibility built on candour still has to convert into delivered numbers. Management has now missed its own margin band for the second consecutive year while explaining the miss clearly and quantifying it precisely. Explaining a miss well is genuinely better than obscuring one. It is not a substitute for not missing.
That tension is where the story meets policy, and where the risks are largest.
VIII. Strategic Moats & The Skeptical Investor Stress Test
On 20 February 2026, the US Supreme Court ruled that the International Emergency Economic Powers Act does not authorize the President to impose tariffs — invalidating the reciprocal tariff structure that had governed US imports.18 The same day, the administration issued Proclamation 11012 under Section 122 of the Trade Act of 1974, imposing a flat 10 percent duty on most imported goods from all countries, effective 24 February 2026.18 Section 122 carries a hard 150-day limit, so that authority expired on 24 July 2026 — six days ago.18 In between, on 7 May 2026, the Court of International Trade held that the Section 122 proclamation itself exceeded statutory authority, though relief was granted only to three named plaintiffs and the government's appeal to the Federal Circuit was stayed the following day.18 Separately, Section 232 duties on metals were restructured in April 2026, and Section 232 and Section 301 authorities remained in force throughout.19
If that paragraph is hard to follow, that is the point. This is the operating environment for a company that ships tens of millions of garments into the United States. The legal basis for American import duties has changed at least three times in six months, and the rate applicable to an Indian-made shirt has ranged from a punitive stack approaching 65–69 percent on cotton garments, down to 18 percent under a bilateral arrangement that cut the reciprocal rate on Indian textiles from 25 percent, down to a flat 10 percent under a temporary statute that has now lapsed.220
No amount of factory efficiency manages that. Only origin diversification does — which is the strongest available argument for Pearl Global's entire strategy, and simultaneously the reason the strategy has not yet shown up in the margin.
Seven Powers, applied strictly
Hamilton Helmer's framework asks whether a company possesses a condition that both raises its own economics and cannot be replicated by a competitor willing to try. Applied honestly to Pearl Global:
Cornered Resource — weak to moderate. A compliant, buyer-audited factory footprint across five manufacturing countries took the company nearly four decades and cannot be assembled quickly. But it is not cornered. Gokaldas has been building the same thing toward Africa and the Middle East; Crystal International already has it; any well-capitalized Asian manufacturer can buy a Bangladeshi or Vietnamese unit. This is a lead, not a lock.
Process Power — moderate, and the most defensible claim. Line balancing for complex outerwear, digital sampling, garment-level traceability and industrial-engineering discipline embedded in partner facilities are genuinely accumulated capabilities that resist copying because they live in people and routines rather than in machines.7 The evidence that they are working is the margin move from 4.1 percent in FY21 to 9.3 percent in FY26 on a business that is still, at bottom, contract manufacturing.51 The evidence they are not decisive is that Gokaldas achieves a higher margin without them.6
Counter-Positioning — moderate. The partnership model lets Pearl Global add capacity without adding depreciation, and an incumbent committed to owned factories cannot easily copy it without cannibalizing its own asset base. But the model is not proprietary and partner-managed capacity carries its own risks: less control over labor practices in an industry where a single audit failure can cost a customer, and dependence on partners who could in principle be recruited by a rival.
Scale Economies — weak. Aggregating fabric purchasing across 78 million pieces provides some leverage with mills in Taiwan, China and India. But at roughly US$521 million of revenue, Pearl Global is an order of magnitude smaller than Shenzhou and it does not make its own fabric.149 It is a price taker on its largest input. This is precisely the gap KPR's 20.65 percent margin illustrates.15
Switching Costs — moderate and rising. Qualification cycles, shared tech packs, co-design and compliance history make vendor changes costly for the buyer. The tenure data supports this: 60 percent of revenue from relationships over five years old.7 The counter-evidence is FY26, when customers diversified origin away from India quickly when the economics demanded it — showing switching costs bind at the vendor level more than the country level.
Branding and Network Economies — absent. Neither applies to a business-to-business contract manufacturer.
Porter's Five Forces, and where the pressure really comes from
Buyer power is the dominant force and it is high. A handful of very large American retailers with sophisticated sourcing organizations set the price. The FY26 discount episode is the cleanest possible demonstration: when a policy shock raised buyers' landed cost, buyers pushed a substantial share of it back onto the vendor, and the vendor paid to protect the relationship.4 That is what an absence of pricing power looks like in practice.
Supplier power is low to moderate. Fabric and trim supply is fragmented globally and Pearl Global buys in volume — though not making its own fabric leaves it exposed to cotton and synthetic input cycles.
Threat of new entrants is low at the tier the company competes in. Anyone can open a sewing unit. Almost nobody can pass a Target or PVH audit, produce traceability documentation, and offer four origins.
Threat of substitutes is low. People will keep buying clothes.
Rivalry is high and structurally so. Garment manufacturing has global overcapacity, low differentiation on basic product, and competitors in a dozen countries. This is a market share fight won on reliability, speed and compliance, not on a defensible product.
The composite verdict: Pearl Global operates in a structurally unattractive industry and has built a genuinely above-average position within it. Those are both true, and neither cancels the other.
The bear case
Buyer concentration meeting buyer power. With a single customer at roughly an eighth of revenue and undisclosed top-five concentration, the loss or material reduction of one large account would hit fixed-cost absorption immediately — and the FY26 discount episode showed that these customers will use their leverage.24
Tariff and trade regime volatility is now a permanent feature, not an event. The legal architecture of US import duties has changed repeatedly within a single year.1819 A company that ships primarily to America cannot plan around this; it can only diversify origins, which costs utilization.
Demand. The customer list is heavily weighted toward American mid-market and department-store retail, a segment under structural pressure. A US or European consumer slowdown produces retail destocking, and destocking hits garment vendors harder than it hits retailers.
Wage inflation in Bangladesh and Vietnam. More than half of group capacity sits in Bangladesh.7 Statutory wage increases there are a political matter, not an economic one, and the FY26 evidence is that cost increases cannot reliably be passed through.
Execution in immature geographies. Guatemala at 38 percent utilization and Indonesia at 47 percent are meaningful drags.72 If Guatemala misses its FY27 breakeven, it becomes a question about management's ability to operate outside Asia.
The activist's questions. A skeptical investor would ask three things. Why has reported margin sat at 9 percent for four consecutive years while the adjusted margin has been presented at 10 percent-plus? Why does the company report ROCE on a construction that produces 28 percent when a conventional calculation produces 20 percent?213 And with 61 percent promoter ownership, what independent process governs related-party transactions and the partnership arrangements through which a growing share of capacity is being added? None of these are accusations. They are the disclosure gaps a concentrated shareholder would press on.
The bull case
Vendor consolidation is a real and durable tailwind. Retailers cutting supplier lists to compliant multi-region partners is a decade-long structural shift, and Pearl Global has already demonstrated it can win share within it: customers acquired in the last five years went from under 5 percent of revenue to 40 percent.7
Mix improvement is measurable, not rhetorical. FY26's revenue growth substantially exceeded volume growth — the arithmetic signature of a genuine move up the value curve, achieved in a year of discounting.14
Trade agreements as a margin catalyst. The India–UK FTA eliminated a 10 to 12 percent duty disadvantage against Bangladesh, Cambodia, Vietnam and Turkey in a market where UK apparel imports were US$18.4 billion in 2024 and China's share had fallen from 35 percent in 2020 to 21 percent by early 2025.7 Pearl Global's UK exposure was around 5 percent of group revenue, and management targeted doubling or tripling it within one to two years off existing Indian capacity and an established UK design and sales office.3 A prospective India–EU agreement would be a larger version of the same trade.2 This is the highest-conviction element of the bull case because it requires no new capex — just utilization of assets that already exist.
Normalization arithmetic. If the ₹36 crore of tariff cost recedes and the ₹13 crore of new-facility losses turn to breakeven, the reported margin approaches the adjusted one without anything else improving.2 Management's commitment to hold 10 percent reported EBITDA in FY27 is the test.2
The balance sheet gives time. With a three-notch credit upgrade, cash of ₹634 crore, and capex funded from operating cash flow, this company is not forced to make decisions on anyone else's schedule.2113
The bull and bear cases converge on the same fulcrum: whether the FY26 margin was a tariff-induced dip in a rising trend, or the actual ceiling of a contract manufacturer that has diversified its geography without escaping its industry.
IX. The Playbook: Key Business & Investing Lessons
Structural resets beat incremental fixes — but the bill comes later. The 2014 demerger separated two businesses whose consolidated financials had been concealing each other. It was a necessary structural decision, yet it did not yield financial performance for six years. From FY15 through FY21, the standalone manufacturing company drifted at low single-digit margins and single-digit returns on capital before the turnaround took hold.13 Corporate separations remove structural friction, but they do not automatically build viable operating models; management teams must still execute the operational heavy lifting over years that shareholders must endure.
Geographic optionality is insurance, and insurance carries a premium. The central thesis for a multi-country footprint is that it protects buyer relationships when one production origin becomes unviable. The FY24–FY26 operating record confirms that resilience, but the premium remains visible on the income statement. Operating across five countries entails running lower blended utilization, absorbing sub-scale facilities in developing hubs, and maintaining duplicated overhead. Management's own FY28 plan assumes structural capacity utilization of roughly 77 to 80 percent.2 Geographic diversification is not free profit—it represents a deliberate choice to buy resilience through a permanent margin sacrifice, leaving the ultimate payoff dependent on whether buyers reward that flexibility with higher volume and customer retention.
Asset-light operations succeed when an operator retains the high-value assets. The core insight of the partnership model is that physical factories and direct labor represent capital liabilities, whereas customer relationships and design capabilities generate the core value. Renting assembly capacity while owning design IP enabled order volumes to expand 37 percent between FY24 and FY26 without a proportional expansion of the balance sheet.31 Across corporate orchestration models, the lesson is clear: companies must remain explicit about which segments of the value chain to own and which to outsource, recognizing that external manufacturing partnerships require sharing profits with minority partners and relinquishing direct operational control.
Climbing the complexity curve offers the only durable exit from contract price-taking — but progress is gradual. Every basis point of margin expansion Pearl Global achieved stemmed from manufacturing higher-value products: technical outerwear instead of basic knit tees. Yet the FY26 trade shock provided a sobering reality check. Even after years of product mix enrichment, sudden policy changes enabled retail buyers to demand 14 to 15 percent price discounts.4 Higher product complexity raises the margin floor, but it does not confer pricing power over dominant retail clients.
Consistent, quantified disclosure of bad news buys cheap and verifiable credibility. Naming loss-making operations in Guatemala and Bihar, quantifying their financial drag, and maintaining a consistent bridge methodology across quarters allowed analysts to verify management's narrative.3216 In doing so, management established a transparent, public scoreboard for its own execution: delivering a 10 percent reported EBITDA margin in FY27, reaching operational breakeven in Guatemala in FY27, and achieving ₹6,000 crore in revenue by FY28.2 Having established such explicit operational benchmarks, management should be judged strictly by whether it meets them.
Examine underlying accounting definitions, not just headline figures. Adjusted EBITDA excluding stock-based compensation, tariff absorption, and new-facility startup losses—alongside return on capital calculated on a denominator that includes letter-of-credit cash—flatters reported performance. While these metrics follow management's internal logic, they mask underlying volatility. An investor's discipline requires reconstructing unadjusted financial series to test whether the core earnings trajectory holds up.513
X. Epilogue & Key Investment Metrics
Nearly four decades after opening a single unit in New Delhi, Pearl Global Industries closed FY26 with more than 28,000 employees and roughly 101 million pieces of installed annual capacity across five manufacturing countries. Supported by design and sales offices in nine nations, the group shipped 78.1 million garments to major retailers across the United States, Europe, and Australia, generating revenue of about US$521 million.72114
That trajectory spans three distinct phases. The first, from 1987 to 2013, saw a quota-era exporter follow the global trade map outward, assembling a fragmented collection of businesses that proved unwieldy under a single corporate umbrella. The second, from 2014 to 2019, revealed that standalone factory operations struggled to generate returns above their cost of capital. The third, beginning in 2019, represents a professional management turnaround under stable family ownership—raising return on capital from 5.5 percent in FY21 while establishing an A-rated balance sheet, positive net cash, and a broad roster of major global retail clients.52
What remains unresolved is whether this transformation yields a durable competitive moat or merely a well-executed operation inside a structurally difficult industry. FY26 provided the first major stress test, delivering a clear split result: customer relationships held, product mix enriched, the balance sheet strengthened, but operating margins failed to expand.
Three specific operational metrics will determine the outcome, all directly observable in quarterly disclosures.
First: shipment volumes paired with realization per piece. Pearl Global discloses quarterly shipment volumes alongside revenue. Volume growth indicates whether vendor consolidation is generating genuine market share gains. Realization per piece reveals whether the shift into technical categories and outerwear is holding, or whether buyer discounts are eroding prices. In FY25, volume drove top-line growth; in FY26, realization provided the lift.31 Sustainable expansion requires both metrics to move upward together. Volume growth paired with declining realization would signal that the group is buying market share through price concessions—a classic trap in contract manufacturing.
Second: reported consolidated EBITDA margin versus adjusted figures. Management has committed to maintaining a 10 percent reported EBITDA margin in FY27 while targeting a 10 to 12 percent long-term band.2 Because management publishes a quarterly margin bridge detailing tariff absorption and new-facility startup drag, the gap between reported and adjusted profitability is transparent. The critical test is whether that gap closes. The adjusted margin has hovered above 10 percent for three years, but reported margins have yet to match it.
Third: working capital cycle length combined with return on capital employed. Working capital stretched from 38 days in March 2025 to 43 days in March 2026, while management's calculated ROCE softened from 30.5 percent to 28 percent over the same period.52 Both metrics reflected the capital requirements of ongoing expansions and ramping facilities. This combination provides an early warning indicator: if physical capacity expands faster than profitable order flow, working capital lengthens and capital returns compress before top-line revenue slows. Investors tracking these dynamics should evaluate return on capital using both standard accounting benchmarks and management's internal formula to verify whether underlying returns are improving.
The next three years present two competing paths. In the optimistic scenario, trade policies stabilize, an India–EU trade agreement materializes, facilities in Vietnam and Indonesia reach higher utilization, Guatemala achieves profitability, and a compliant, multi-country supplier captures market share from single-origin producers disrupted by policy shifts. In the cautious scenario, trade policy remains volatile, Western retail demand softens, dominant buyers continue extracting margin concessions, and a 9 percent operating margin proves to be the structural ceiling for a contract manufacturer, regardless of its geographic breadth.
Evidence supporting the growth thesis is tangible but incomplete; evidence favoring the cautious case is persistent but not decisive. FY27 will determine which trajectory prevails.
References
-
Pearl Global Industries records highest ever revenue of INR 5,025 crore for FY26, grew by 11.5% Y-o-Y — Apparel Views, 2026-05 ↩↩↩↩↩↩↩↩↩↩↩↩↩↩↩
-
Earnings call transcript: Pearl Global Industries Q4 2026 sees record revenue — Investing.com, 2026-05-15 ↩↩↩↩↩↩↩↩↩↩↩↩↩↩↩↩↩↩↩↩↩↩↩↩↩↩↩↩↩↩↩↩↩↩↩↩
-
Pearl Global Industries delivers highest ever revenue Rs. 4,506 Crores in FY25 — Pearl Global Industries Limited, 2025-05-20 ↩↩↩↩↩↩↩↩↩↩↩↩↩↩↩
-
Pearl Global Industries Ltd (BOM:532808) Q2 2026 Earnings Call Highlights — GuruFocus via Investing.com, 2025-11 ↩↩↩↩↩↩↩↩↩
-
Pearl Global Industries Limited Corporate Presentation, July 2025 — Pearl Global Industries Limited, 2025-07 ↩↩↩↩↩↩↩↩↩↩↩↩↩↩
-
Gokaldas Exports consolidated FY26 Total Income up by 4% YoY; EBITDA margins maintained at 10.7% — EquityBulls, 2026-05 ↩↩↩↩
-
Pearl Global Investor Relations — Corporate Presentations, Results and Annual Report Disclosures — Pearl Global Industries Limited ↩↩↩↩↩↩↩↩↩↩↩↩↩↩↩↩↩↩↩↩↩↩↩↩↩↩↩↩↩↩
-
Pearl Global Industries Limited agreed to spin-off PDS Multinational Fashions Ltd. — MarketScreener India, 2014 ↩↩
-
Shenzhou International Grows 2025 Revenue but Profit Hit by FX Losses — The Globe and Mail, 2026-03-30 ↩↩↩↩
-
Bangladesh: Garment factories shut indefinitely amid ongoing violence — Business & Human Rights Resource Centre, 2024 ↩↩
-
Pearl Global announces acquisition of Alpha Clothing — The Textile Magazine, 2022-04-21 ↩↩↩
-
Pearl Global Industries Limited announces acquisition of 55% stake in Pearl GT Holdco Ltd — EquityBulls, 2023-06-27 ↩↩↩
-
Pearl Global Industries Limited Consolidated Financials & 10-Year Track Record — Screener.in ↩↩↩↩↩↩↩↩↩↩↩
-
India's Pearl Global's FY26 revenue crosses $521 mn milestone — Fibre2Fashion, 2026-05 ↩↩↩
-
KPR Mill reports consolidated net profit for FY26; board recommends 250% final dividend — ScanX, 2026-05 ↩↩
-
India's Pearl Global reports solid Q3 FY26 with margin improvement — Fibre2Fashion, 2026-02 ↩↩
-
Pearl Global Industries approves FY26 financial statements at 37th AGM — ScanX, 2026-07-20 ↩
-
US Trade Court Strikes Down Section 122 Tariffs, but Ruling's Fate Is Uncertain and Practical Impact Is Limited — Skadden, Arps, Slate, Meagher & Flom LLP, 2026-05 ↩↩↩↩↩
-
Tariffs in Flux: IEEPA and Section 122 Struck Down, Section 232 Duties Expand — Miller Nash LLP, 2026-07-08 ↩↩
-
With US trade deal and EU FTA, will India's textile sector get its moment? — Business Standard, 2026-02-03 ↩
 LinkedIn
 WhatsApp
 Reddit
 Hacker News
 Email
Email Kindle
 RSS Feed
 Spotify
 Apple Podcasts
 Amazon Music
 Audible
 YouTube