Aditya Birla Money: The Transformation of India's Capital Markets Pioneer
I. Introduction & Episode Roadmap
A distinct quiet settles over a brokerage floor when trading volumes disappear. Terminals still display prices, compliance alerts still arrive, and relationship managers continue dialing clients, but the underlying momentum of an active market drains away. Broking desks across India experienced that shift during the second half of calendar 2025. Regulatory changes halved weekly index option expiries and tripled contract sizes, causing retail traders who had driven futures and options activity for five years to step back, revealing how much of the industry's profitability depended on temporary market conditions.
Aditya Birla Money Limited felt the full force of this slowdown. For the twelve months ended March 31, 2026, the company reported a net profit after tax of ₹58.48 crore—down 21.2% from ₹74.19 crore the previous year—on revenue that edged up 3.4% to ₹468.59 crore.1 In its FY26 annual report, management described the year plainly, noting that revenue grew 2% to ₹473 crore aided by higher interest income that was partially offset by lower fees and commissions, while profit dropped to ₹58 crore from ₹74 crore due to "challenging market conditions and subdued market activity."2 Beneath those consolidated numbers lay a sharp divergence: broking revenue fell 18.6%, while wholesale debt market revenue grew 63%.2 Those two figures highlight the strategic shift underway within the firm.
Yet the fourth quarter presented a stark contrast. In the three months ended March 31, 2026, standalone net profit more than doubled to ₹18.73 crore from ₹9.33 crore in the corresponding period of the previous year. Revenue from operations rose 30.5% to ₹129.80 crore over the same period as equity volumes and derivative activity recovered.1 A business that posted a significant annual profit decline ended the fiscal year with rapid growth, illustrating the dynamics of a high-operating-leverage, cycle-dependent financial intermediary where quarterly performance shifts much faster than long-term strategy.
The core analytical question is not simply whether Aditya Birla Money is a viable enterprise, but rather a more structural inquiry: How did a 1995 Chennai brokerage promoted by the founder of Apollo Hospitals become a specialised debt-broking and distribution engine inside the Aditya Birla conglomerate — and why, after eighteen years of conglomerate ownership, does it command roughly 68,000 active NSE clients against Groww's 1.33 crore?34
That disparity is the defining metric of the company. As of August 2026, Groww led India's retail broking market with a 29.04% share of active National Stock Exchange (NSE) clients, representing roughly 1.33 crore investors. Zerodha followed with a 14.79% market share, or 67.97 lakh clients, while Angel One held 14.62% with 67.19 lakh clients, and ICICI Securities accounted for 4.69%.3 By comparison, Aditya Birla Money's active NSE client count stood at 68,323, according to broker-comparison data compiled for 2026–27—roughly one two-hundredth of Groww's total and representing about 0.15% of the market.4 To put that scale in perspective, Angel One adds more active clients in a single month than Aditya Birla Money has accumulated over three decades.3
This disparity points to what the company built instead. A financial services firm operating with just 0.15% of retail trading clients while continuing to generate a return on equity in the mid-teens to low-twenties is clearly relying on revenue sources beyond mainstream retail equity broking.5
A key analytical framework helps explain this positioning. In most sectors, a firm that loses market share suffers a corresponding drop in revenue. In Indian broking between 2015 and 2025, however, a firm could lose substantial market share and still expand revenue because overall market participation grew dramatically and the most profitable clients were not necessarily the most numerous. That dynamic explains how Aditya Birla Money sustained its operations despite shrinking market share. It also illustrates why standard metrics can be misleading: headline client counts suggest limited scale, while segment disclosures reveal a specialized niche. Reconciling those two realities is central to understanding the firm.
The analysis proceeds through five key phases. Origins: the Apollo Sindhoori era, when the founder of Apollo Hospitals built a South Indian broking franchise based on branch-level relationships. The M&A pivot: Aditya Birla Nuvo acquiring control in 2008 and 2009 at an unfavorable moment in the market cycle, followed by a decade of operational recovery. The re-architecture: corporate reorganizations, amalgamations, digital platform upgrades, and the unheralded 2018 launch of a wholesale debt desk. The reality check: what fiscal 2026 results revealed about how much of the business provides recurring income versus a leveraged bet on market turnover. Strategic outlook: an examination of whether conglomerate brand equity can substitute for scale, whether a broker with fewer than 100,000 active clients should exist as a separately listed public entity, and what a skeptical investor should track going forward.
The central theme remains consistent throughout: Aditya Birla Money surrendered market share in mass-market retail broking to build a specialized institutional and debt-focused enterprise. Whether that model proves durable across market cycles remains an open question, with the fiscal 2026 results offering evidence for both perspectives.
 Subscribe on LinkedIn
II. Apollo Sindhoori Era: Origins of a Regional Broker (1995–2008)
In the mid-1990s, the Indian equity market underwent a structural shift. The National Stock Exchange introduced screen-based trading in November 1994, ending the Bombay Stock Exchange's floor-trading monopoly and eliminating the era when retail market access depended on physical proximity to trading rings and floor jobbers. Broking franchises shifted from managing exchange floor access to expanding customer reach.
Dr. Prathap C. Reddy, a U.S.-trained cardiologist who founded Apollo Hospitals in Chennai in 1983 and pioneered Indian corporate healthcare, recognized that transition. By the mid-1990s, the Apollo brand across South India represented institutional trust and reliability during critical financial and health decisions.
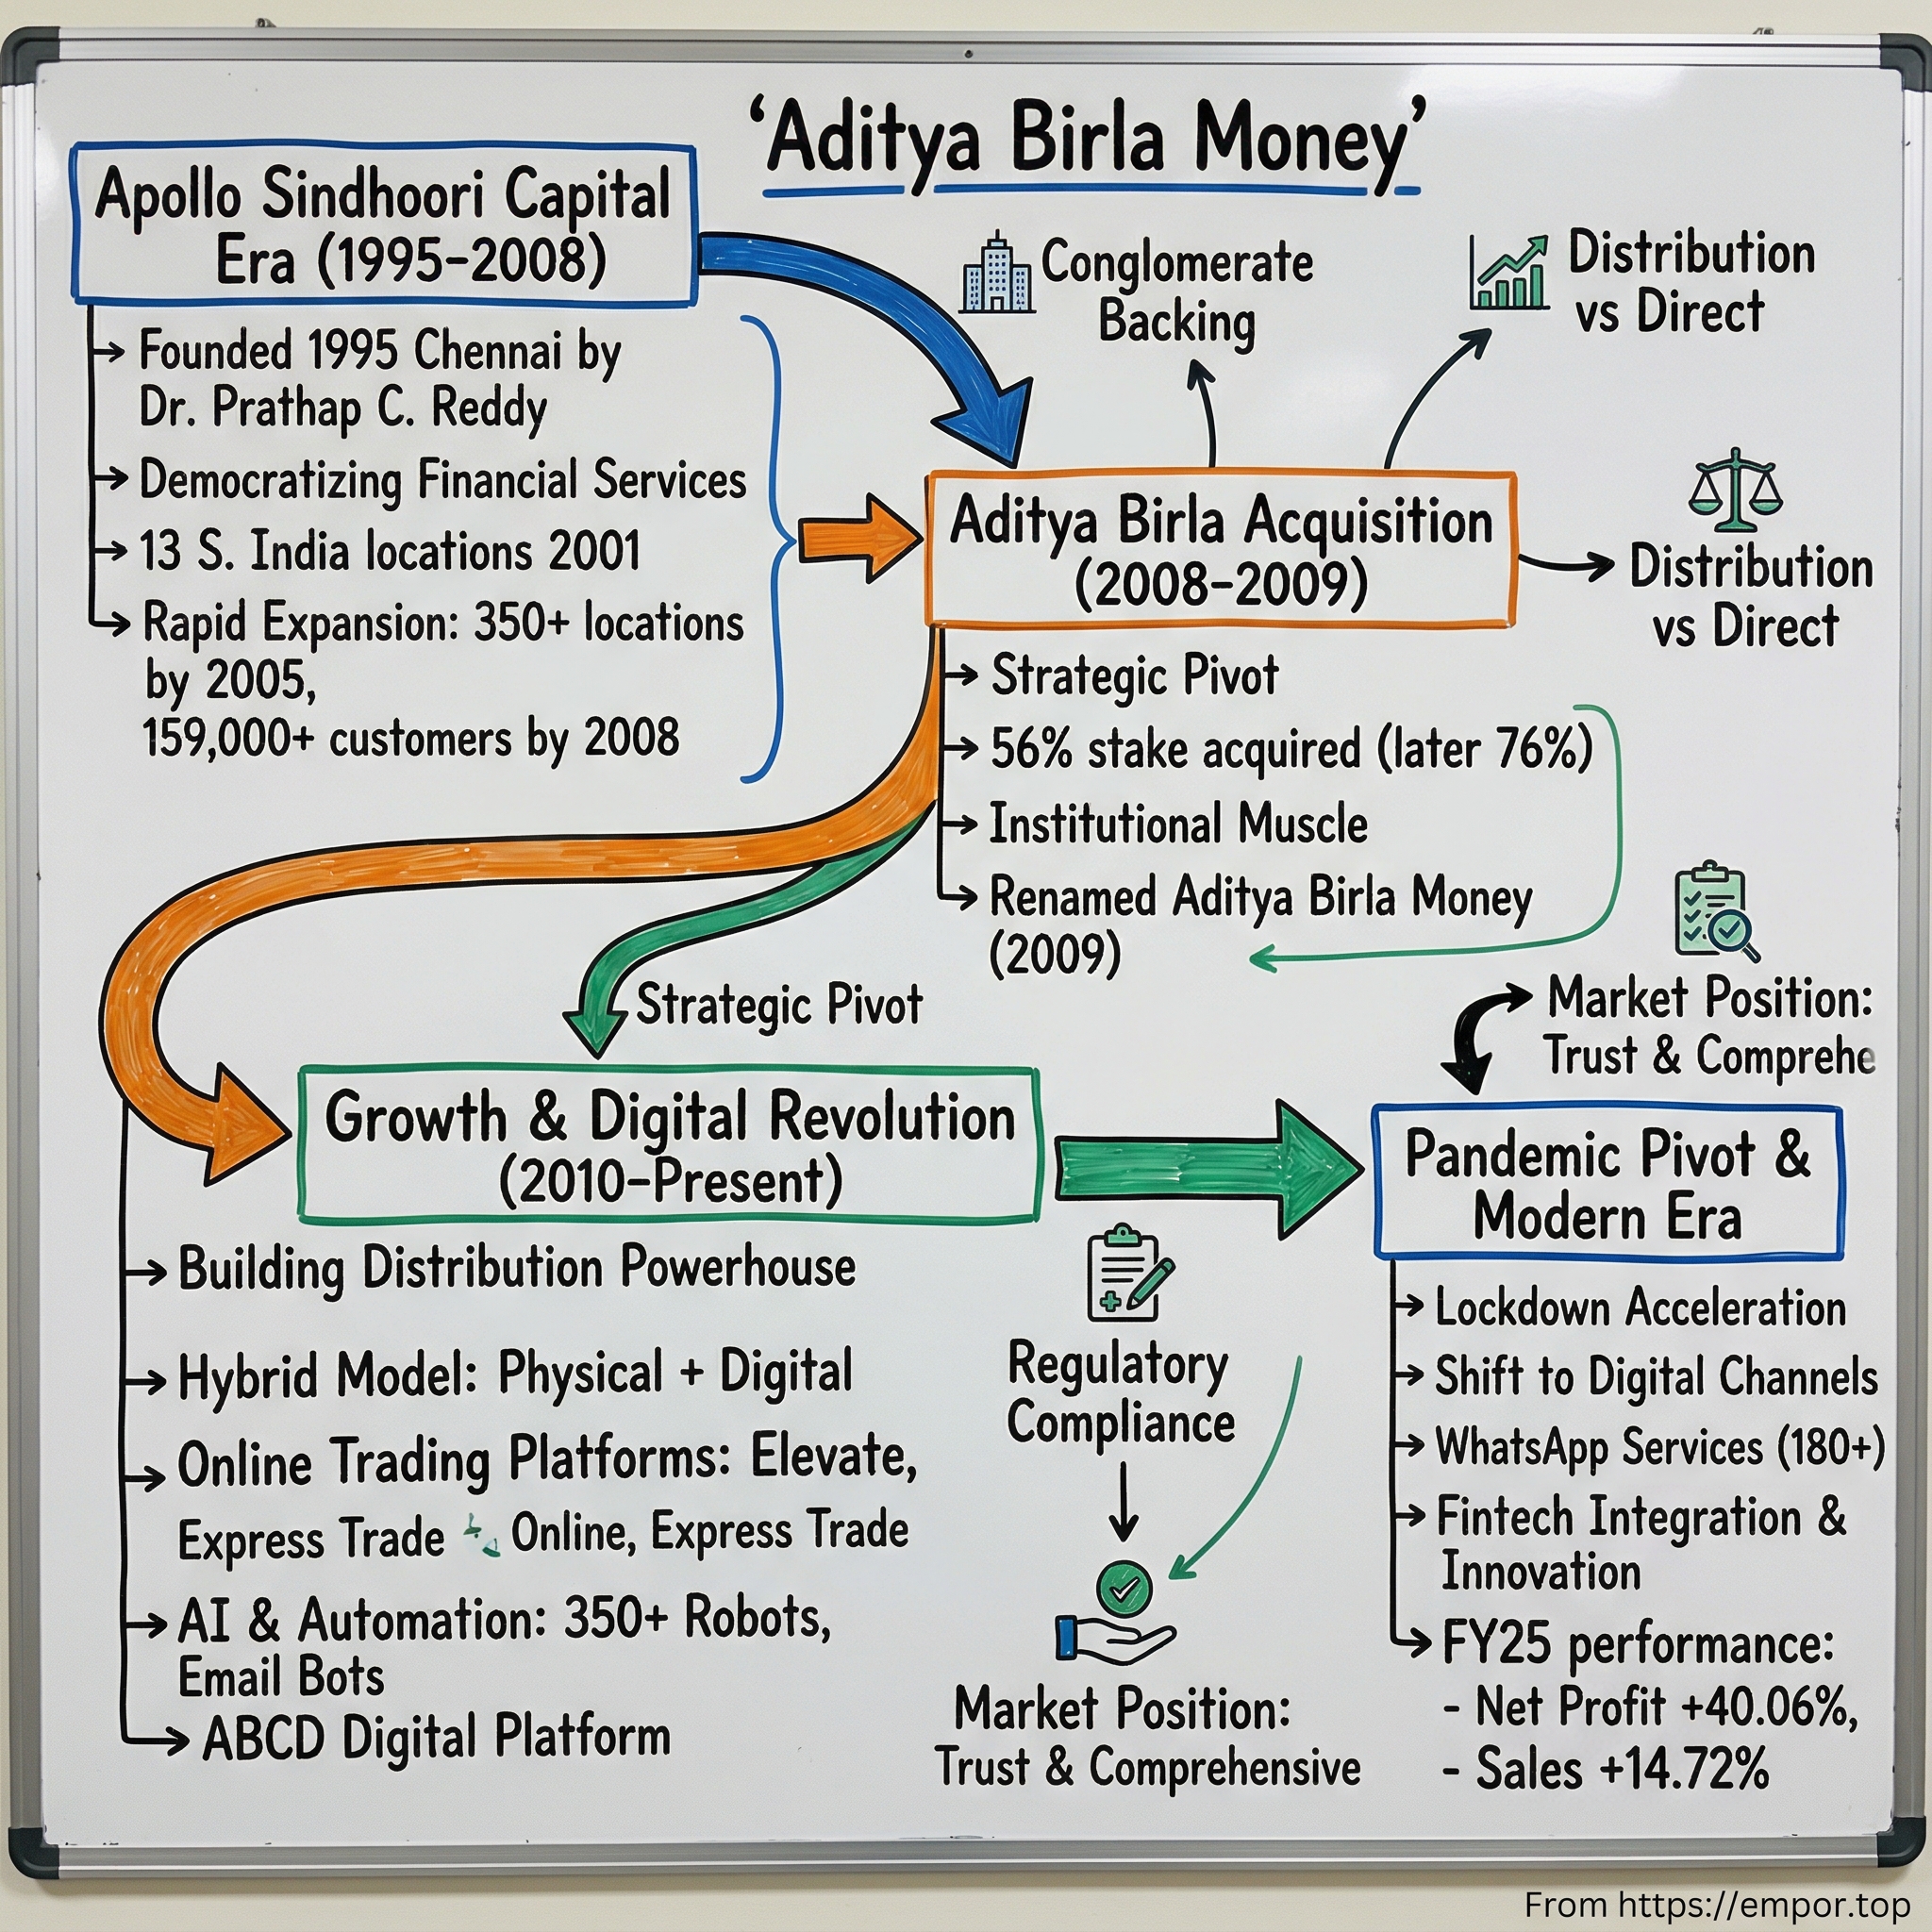
Apollo Sindhoori Capital Investments Limited was incorporated on July 4, 1995 and commenced operations the following year, promoted by the Apollo Hospitals group under Reddy's chairmanship.6 The strategic premise was straightforward: in an environment where retail investors gained direct market access but lacked objective criteria to evaluate thousands of new brokers, associating a brokerage with a respected healthcare brand served as an effective customer acquisition asset.
Trust as a distribution channel
The firm subsequently expanded its physical network. It grew from a handful of locations at the turn of the century into a network of hundreds of branches by mid-decade, extending outward from Chennai across Tamil Nadu's tier-two cities, and into Andhra Pradesh, Karnataka, and Kerala. A parallel entity, Apollo Sindhoori Commodities Trading Limited, extended this footprint into commodity futures—a early multi-asset expansion following India's re-authorization of commodity futures trading in 2003.
The business model reflected the era's standard full-service structure. A client visited a branch or received a call from a sub-broker, and a relationship manager executed orders over the phone. Brokerage commissions were charged as a percentage of turnover, typically ranging from 15 to 25 basis points on delivery trades—roughly 100 times the flat fees charged by modern discount brokers. From that fee revenue, the firm covered branch rent, relationship manager salaries, sub-broker commission splits, and manual back-office trade reconciliation.
For several years, substantial commission margins funded high-touch physical distribution. When a first-time investor in Coimbatore required guidance on a corporate rights issue, the 20-basis-point commission offset the cost of that high-touch advisory interaction. The physical branch served directly as the core product.
During the market expansion from 2003 to 2007, when the BSE Sensex rose from approximately 3,000 to over 20,000 points, key operational metrics—account openings, trading turnover per client, and aggregate commission income—expanded rapidly. Apollo Sindhoori's earnings grew accordingly, positioning the company by 2007 as a major regional broker with national ambitions.
What the branch economics actually looked like
Examining the unit economics of that period illustrates both the driver of initial growth and the underlying model's structural vulnerability.
Consider a typical branch in a tier-two southern city in 2005. The location employed a branch manager, three or four relationship managers, and back-office support staff. Fixed monthly expenses included property rent, dedicated telecom lines to the exchange, trading terminal fees, and allocated corporate compliance costs. Against those fixed overheads, the branch earned a percentage of client trading turnover. With active trading and delivery commissions at 20 basis points, a modest base of engaged clients allowed a branch to break even, while incremental turnover beyond that threshold generated high operating margins. Between 2003 and 2007, operating leverage worked strongly in the broker's favor.
However, if commission rates drop by 90%—as occurred industry-wide over the subsequent two decades—the same branch requires ten times the trading volume simply to break even. Similarly, if trading volume declines by half during a market downturn while fee rates remain unchanged, branch profitability deteriorates rapidly. The full-service model possessed limited defense against simultaneous fee compression and volume contraction.
This economic dynamic drove the subsequent consolidation across full-service Indian brokerages. The industry transition was less about brand preference and more about fixed-cost physical networks colliding with compressed variable-commission revenues.
A commodities side-bet that mattered more than it looked
The decision to establish a commodities brokerage across a broad branch network early in the lifecycle of India's re-established commodity futures market demonstrated a strategic focus on leveraging distribution reach rather than equity-specific research. A branch footprint supported by brand trust could distribute multiple exchange-traded financial products.
That emphasis on distribution capabilities and exchange memberships re-emerged two decades later in the firm's development of a wholesale debt desk and margin lending book. Across the firm's history, effective strategic initiatives centered on monetizing institutional relationships and trading licenses, whereas less successful phases stemmed from relying on physical branch networks as the primary distribution channel.
Falsification: was this a scalable capital markets business?
The valuation thesis implicit in the firm's 2008 acquisition was that Apollo Sindhoori represented a nationally scalable capital markets platform that a larger parent entity could expand across India.
The historical record indicates a more bounded reality. Pre-2008 earnings expansion was primarily driven by two macroeconomic conditions outside the firm's direct control: sustained equity market appreciation and high industry commission rates. Excluding the bull market cycle and the 15-to-25-basis-point fee structure, the core asset consisted of a regional branch network without proprietary execution technology, automated risk management systems, or cost advantages over competing regional brokers. The firm's main competitive advantage—the Apollo brand's standing across four southern states—was geographically defined and difficult to transfer into northern or western regional markets.
Furthermore, the cost structure remained vulnerable to cyclical shifts. A branch-and-sub-broker model combines high fixed operating expenses with turnover-dependent revenue. That structure generates strong profit growth when trading volumes and fee rates rise, but exposes operating margins when market volume contracts or commission rates drop.
The empirical evidence does not support the view that the business was a self-sustaining, nationally scalable franchise in 2008. Apollo Sindhoori was a well-regarded, regionally strong distribution network whose financial performance was highly levered to broader equity market cycles.
III. The Aditya Birla Acquisition & The Post-GFC Reckoning (2008–2015)
In August 2008, as the global financial crisis began to unfold, Indian corporate leaders still largely viewed equity market declines as a routine correction within a structural bull run. The BSE Sensex had fallen from above 20,000 points in January into the mid-10,000s, yet optimism regarding long-term domestic financial participation remained strong.
On August 28, 2008, Aditya Birla Nuvo Limited signed a share purchase agreement to acquire a 56% equity stake in Apollo Sindhoori Capital Investments.6 Following a mandatory open offer for an additional 20% that completed on February 24, 2009, ABNL secured a controlling 76% stake by early March 2009. On August 3, 2009, the company was renamed Aditya Birla Money Limited.6
Why the Birlas wanted it
The strategic rationale was logical: Aditya Birla Nuvo was building an integrated financial services platform—combining Sun Life insurance, asset management, and lending—and broking represented the missing retail-facing capital markets channel. A brokerage creates a high-frequency, ongoing relationship with affluent investors seeking capital deployment, functioning as a top-of-funnel customer acquisition engine for insurance and mutual fund products.
However, the transaction timing proved problematic. ABNL negotiated the acquisition using valuation metrics from 2007 and early 2008—a period when listed Indian brokerages traded at peak multiples reflecting assumptions of permanently elevated market turnover and high commission rates. Within eighteen months of signing, global equity markets collapsed, domestic retail trading activity contracted sharply, and the industry entered a multi-year period of fee compression. Buying a turnover-sensitive business at peak-cycle valuation multiples turned out to be a costly misstep in timing.
The integration decade
ABNL inherited a legacy regional business rather than a plug-and-play platform: roughly 185,000 customers served through a network of more than 800 physical touchpoints built for a high-volume market that evaporated shortly after closing. From 2009 onward, management engaged in continuous operational restructuring: rationalizing branches, renegotiating sub-broker agreements, rebuilding back-office systems, and integrating a Chennai-headquartered regional corporate culture into a Mumbai-centered conglomerate governance framework.
Two structural factors defined this period.
First, the sub-broker network shifted from a low-cost distribution asset into an operational burden. In a high-commission, high-turnover environment, sub-brokers provided customer acquisition in exchange for revenue splits, carrying minimal fixed expense for the parent broker. In a lower-volume environment, however, the network generated negative unit economics because the parent broker retained regulatory compliance liabilities across every node while reduced transaction volumes no longer covered oversight costs. Unwinding these relationships proved slow, complex, and commercially sensitive in key regional markets.
Second, the organizational focus required for integration coincided with a fundamental shift in industry technology. Zerodha was founded in 2010. While Aditya Birla Money was consumed with consolidating legacy branches and reconciling customer accounts, technology-first entrants developed automated software that rendered physical branch networks obsolete. Incumbent management focused attention on internal legacy integration rather than responding to digital substitution.
The open offer, and what the structure locked in
The acquisition mechanics established structural constraints that persisted over the subsequent eighteen years. Under Indian takeover regulations, ABNL’s agreement for a 56% stake required a mandatory open offer to public shareholders for an additional 20%. The offer completed in February 2009, executing the majority of the capital outlay when equity valuations were falling and financial market liquidity was constrained.
This resulted in a publicly listed subsidiary with promoter ownership in the mid-70% range and a public float of approximately one-quarter. This ownership distribution created ongoing structural limitations: the float remained too illiquid for institutional investors, while the remaining public shares prevented complete operational integration into the parent conglomerate. Created by regulatory requirements rather than strategic design, that ownership breakdown persists today at 73.53% promoter and about 26.45% public.14
The technology gap, explained simply
The contrast between traditional full-service broking and discount models highlights the structural cost disadvantage faced by incumbents.
In a full-service brokerage, trade execution required human intervention: clients placed orders via branch visits or phone calls, relationship managers entered details, dealers executed trades, and back-office staff reconciled ledgers overnight. Each step added direct labor costs and operational friction, meaning variable costs scaled alongside client growth.
Discount brokerages replaced human infrastructure with automated software. Client onboarding moved to digital identity verification, orders routed directly to exchange gateways without manual handling, risk parameters evaluated in real time, and ledgers reconciled automatically. Consequently, the marginal cost of servicing additional users dropped to near zero, covering primarily server capacity and basic support.
With this low-cost architecture, discount brokers operated profitably on flat per-trade fees or zero-commission delivery structures. Full-service incumbents could not match this pricing because their fixed physical branch network and relationship manager payroll created a high cost floor per client. Updating mobile apps could not resolve this disadvantage while physical branches and relationship managers remained in place.
Falsification: did conglomerate ownership deliver?
The initial acquisition premise—that conglomerate ownership would deliver substantial distribution synergies and operating scale—did not materialize as expected during the initial six years. Between 2009 and 2015, Aditya Birla Money generated modest capital returns, with return on equity declining toward the low teens and below. Cross-selling insurance and mutual fund products into the retail broking client base failed to generate sufficient revenue to offset industry-wide fee compression.
Conglomerate backing provided balance sheet stability and favorable funding access, but it could not overcome an uncompetitive cost structure in retail broking. While brand equity supported customer trust, it did not resolve the operational cost inefficiencies of physical distribution.
A more accurate assessment indicates that while conglomerate ownership did not build a scaled retail brokerage, it provided financial backing that allowed the firm to remain solvent and patient long enough to eventually pivot its business model.
Additionally, the corporate record shows no evidence of costly, failed attempts at launching zero-commission platforms or acquiring external fintech startups during this period. While this absence of speculative spending does not demonstrate early strategic foresight, it prevented major capital destruction, resulting in subdued multi-year returns rather than sharp write-downs.
That operational reality set the stage for subsequent structural changes to the firm's business model.
IV. Re-Architecting the Engine: Digital Amalgamation & Ecosystem Integration (2015–2022)
The most consequential events in Aditya Birla Money's modern history were not front-facing product launches, but internal corporate restructurings executed through scheme-of-arrangement filings and National Company Law Tribunal orders.
In 2017, Aditya Birla Nuvo was amalgamated into Grasim Industries, and the combined group's financial services businesses were demerged and listed as Aditya Birla Capital Limited.7 Under ABNL, the brokerage had been one asset inside a sprawling industrial conglomerate that also manufactured viscose filament yarn and fertilizer. Under Aditya Birla Capital, it became part of a dedicated financial services platform whose management was evaluated directly on financial outcomes—a critical distinction in how capital and strategic attention were allocated.
Between 2018 and 2019, Aditya Birla Commodities Broking Limited was amalgamated into Aditya Birla Money, consolidating equity, currency, and commodity broking onto a single balance sheet and regulatory perimeter. The integration unified net worth, risk management systems, compliance functions, and client onboarding pipes across asset classes, eliminating duplicated operational costs.
The pivot nobody covered
In 2018, amidst this corporate restructuring, the company established a wholesale debt market desk.
The launch received little public attention. Unlike retail broking, a wholesale debt desk requires no consumer app, advertising campaigns, or high-volume onboarding funnels. Instead, a specialized team intermediates directly between corporate treasuries, mutual funds, insurance companies, banks, and provident funds trading bonds, commercial paper, and certificates of deposit. Because India’s corporate bond market remains negotiated rather than screen-driven, transactions rely on voice brokers who track institutional holdings and buy-side mandates.
The unit economics inverted those of retail equity broking. Deal sizes run in tens of millions of rupees rather than thousands, customer acquisition rests on institutional relationships rather than digital marketing budgets, and headcount remains lean. Counterparties such as institutional treasurers prioritize execution reliability and inventory access over minimal fee discounts. In contrast to running a mass-market retail brokerage dependent on consumer traffic, a wholesale trading desk operates on specialized relationships and institutional credibility.
Eight years after its launch, that wholesale debt desk generated ₹110.39 crore in fiscal 2026 revenue, representing 23.6% of the company's total. It expanded 63% during a year when retail broking revenue fell 18.6%.82 The desk became the firm's most significant strategic pivot under Aditya Birla group ownership, despite attracting minimal public attention at its launch.
The digital build, and what it was actually for
Concurrently, the company upgraded its retail digital technology, introducing the Elevate mobile app and web platform, as well as Express Trade for active traders, later integrating them into the broader Aditya Birla Capital digital umbrella. When COVID-19 forced physical branch closures, the firm transitioned its traditional human-led service model online overnight. Digital execution share rose sharply through fiscal 2021, supported by WhatsApp-based account servicing and automated administrative features.
This digital build digitized the servicing of an existing client base rather than driving mass client acquisition. Conflating digital service migration with customer acquisition success distorts the competitive analysis.
Why voice broking survives in bonds but not in equities
The divergence between equities and fixed income illustrates a fundamental market dynamic. While Indian equity broking automated almost completely, corporate bond trading under the same regulator remained largely voice-brokered.
Equities are fully fungible: every common share of a given company matches seamlessly on an electronic order book. A corporate bond, conversely, carries specific issuer risk, coupon rates, maturity dates, issue sizes, and credit ratings. With only a small pool of institutional holders for a specific bond series—most of whom are not actively quoting offers—matching buyers and sellers becomes an information problem solved by relationship brokers tracking holdings and mandates, rather than an electronic price-matching process.
This structural fragmentation preserves margins and protects wholesale debt broking from instant digital commoditization. However, it also introduces concentration risk, as the core operational asset resides in the institutional knowledge and relationships of key desk personnel.
For investors, the underlying principle is clear: automation compresses intermediary margins where products are standardized and liquidity is centralized, while preserving margins where products are fragmented and liquidity is dispersed. Aditya Birla Money ceded market share in the former to build a position in the latter.
Falsification: did Aditya Birla Money become a digital-first broker?
The proposition that Aditya Birla Money transformed into a competitive digital retail broker during India's retail investing expansion is readily testable against monthly exchange data.
Between 2020 and 2024, tens of millions of new retail investors entered the Indian market. Active NSE clients grew 21% in fiscal 2025 alone, with market leader Groww expanding its active client base by 36% that year.9 Aditya Birla Money captured virtually none of this growth. Its active NSE client count stood at approximately 68,300 in 2026–27 data, down from roughly 85,000 in earlier periods, indicating that its active retail client base contracted during the largest retail trading expansion in Indian history.4
This empirical evidence disproves the digital-transformation thesis for retail acquisition. The underlying cause was structural counter-positioning. A legacy brokerage supporting 41 branches, 807 franchisee offices, and a relationship-manager sales force could not adopt flat fee pricing of ₹20 per order without undermining the economics of its existing distribution network.4 Management's rational decision not to engage in price discounting preserved short-term operating margins at the expense of retail market share.
What the digital initiative ultimately accomplished was operational efficiency: it lowered servicing costs for retained clients and rendered an affluent customer base defensible without requiring physical branch interactions. Consequently, the platform's value lies in servicing efficiency and revenue per retained client rather than mass retail acquisition.
V. The Modern Business & Segment Economics (FY24–FY26)
An examination of Aditya Birla Money's FY26 segment disclosure reveals a two-engine intermediary in which the smaller engine generates all the growth.
For the fiscal year ended March 31, 2026, total segment revenue of ₹468.59 crore split into broking at ₹355.32 crore—representing 75.8% of the total—wholesale debt market at ₹110.39 crore, or 23.6%, and other activities at a residual ₹2.88 crore.8 Broking's share ranged between roughly 72% and 78% across the four quarters, reflecting a stable quarterly mix that is nevertheless shifting across financial years.8
The revenue structure is organized as follows:
[Aditya Birla Money — FY26 Revenue Architecture]
       │
       ├── 1. Securities Broking & MTF  (₹355.32 Cr — 75.8%)
       │      ├── Equity, F&O, currency & commodity commission  (falling)
       │      └── Margin Trading Facility net interest income   (rising)
       │
       ├── 2. Wholesale Debt Market  (₹110.39 Cr — 23.6%)
       │      └── Institutional bond, CP & CD intermediation  (+63% YoY)
       │
       └── 3. Other / Distribution  (₹2.88 Cr — 0.6%)
              └── Third-party product commissions booked in segment "others"
The broking line is not what its name says
The most frequently misread aspect of the company is its broking segment, which combines two businesses with opposite economic characteristics.
The first component is trading commission: pure transaction revenue that depends entirely on market turnover, faces structural price deflation, and fell 18.6% in fiscal 2026.2 The second component is the Margin Trading Facility (MTF)—a lending business where the client provides partial collateral for securities purchases and the broker funds the remainder, earning a spread between its funding cost and the interest rate charged to the client. This operates as a net interest margin business within a broking category. It scales with the size of the loan book rather than transaction count. The FY26 annual report's attribution of revenue growth to "higher interest income" partially offsetting lower fees and commissions reflects this shift.2
This structural distinction directly affects risk assessment. MTF interest income exhibits greater persistence than trading commissions, but that stability is conditional. The loan book expands primarily when clients seek leverage during rising markets. When equity prices decline, the loan book contracts alongside commission income, while the underlying collateral value shrinks. Consequently, MTF diversifies the revenue line item without fully decoupling the firm from underlying market risk: both engines remain dependent on investor participation in Indian equities.
The debt desk is the real diversifier
The wholesale debt market (WDM) desk provides genuine revenue non-correlation, with fiscal 2026 results offering the first quantitative evidence of that buffer. In a year when the dominant broking revenue line contracted by nearly a fifth, the debt desk expanded 63%, pulling total consolidated revenue into positive territory.2 Segment disclosures substantiate this structural shift.
The underlying driver is regulatory and macroeconomic. India's corporate bond market has expanded as regulations encourage large corporate borrowers toward bond markets, while insurance and pension funds increase fixed-income allocations and bond issuance broadens beyond top-rated issuers. Voice-brokered intermediation scales alongside primary issuances and secondary turnover, neither of which relies directly on retail trading sentiment.
However, structural risks remain. A trading desk growing 63% from a base of roughly ₹68 crore represents an emerging business line whose revenue remains concentrated in key institutional relationships. Furthermore, bid-ask spreads face long-term compression as electronic execution platforms and exchange-based bond trading gain traction. If key personnel depart, client relationships and associated revenues may follow. Key-person concentration on a voice-broking desk represents an unquantified risk, as the company does not disclose desk headcount, client concentration, or revenue per relationship.
Distribution: the gap between the story and the segment
Company narratives and management presentations frequently highlight a strategic pivot toward wealth management and financial product distribution, including mutual funds, insurance, non-convertible debentures, portfolio management services, and structured products. In theory, this asset-light, high-margin model offers recurring fee streams aligned with the financialization of Indian household savings.
However, the FY26 segment disclosure attributes just ₹2.88 crore—six-tenths of one percent of revenue—to "others."8 While certain distribution fees may be embedded within the broader broking line or housed under separate entities within the parent conglomerate, an investor cannot independently verify a transformation that does not appear in reported segment breakdowns. On published data, the distribution franchise remains minor or undisclosed at the listed entity level. Establishing its true scale would require consistent quarterly disclosure of distribution assets under management and commission yields.
Reading the FY26 quarterly shape
The quarterly progression of fiscal 2026 illustrates how the business responds to external market variables in real time.
The fiscal year opened under regulatory headwinds affecting derivatives trading, including larger contract sizes, reduced weekly expiries, and lower retail option volumes. Broking revenue declined across the year, falling 18.6% in aggregate.2 Total top-line revenue remained flat only because net interest income and debt-desk growth offset the shortfall.2 Without a corresponding reduction in fixed operating costs, full-year net profit fell 21.2%.1
Performance shifted in the fourth quarter as equity volumes and derivative activity recovered. Operating against a fixed cost base, a 30.5% increase in quarterly revenue translated into a 100.75% increase in net profit.1 Consequently, roughly one-third of full-year net profit was generated in the final three months of the fiscal year.
These dynamics point to two main analytical conclusions. First, company earnings remain highly sensitive to broader market turnover, making market volume a key variable for financial modeling. Second, operating leverage operates symmetrically, driving sharp profit recovery when trading activity rebounds. Fourth-quarter results primarily reflect a cyclical volume recovery rather than a structural business model transformation, as securities broking remained the primary driver of revenue variance.
What the balance sheet is now for
The firm's capital allocation model has undergone a subtle structural evolution. An agency broker takes minimal principal risk, holds limited balance-sheet assets against clients, and requires capital primarily for regulatory net worth and clearing requirements. Conversely, a broker operating a substantial margin-lending book functions similarly to a specialized non-bank lender under a broking license, funding client positions, earning interest spreads, and managing collateral margin risks.
Total equity stood at approximately ₹236 crore as of December 2025.5 Capital is increasingly deployed into margin lending rather than held purely as regulatory reserves. This deployment explains why no dividend was declared for FY26, while clarifying the retreat in return on equity from around 30% to 21.8% over three years: the decline reflects both lower net profit and an expanding equity base.51
This shift highlights a notable disclosure gap. Evaluating a margin-lending portfolio requires visibility into book size, average net interest spreads, collateral coverage ratios, client concentration metrics, and historical margin call records during volatile trading periods. None of these metrics are currently published, creating an analytical blind spot regarding the credit and liquidity risks of the margin trading portfolio.
Falsification: is this business insulated from market cycles?
Management commentary often asserts that diversification has enhanced earnings resilience across market cycles.
Empirical evidence across consecutive quarters provides a test of this claim. In the fourth quarter of fiscal 2025, standalone net profit fell 43.3% year-on-year to ₹9.33 crore as secondary market turnover slowed and broking fees contracted.10 Twelve months later, full-year FY26 net profit declined 21.2%.1 Subsequently, in the fourth quarter of FY26, net profit doubled to ₹18.73 crore alongside a 30.5% revenue rise as derivative activity recovered.1
This sequence demonstrates that earnings remain tied to market cycles. Profitability contracted when market volumes slowed and expanded when trading activity returned, driven by high operating leverage across a fixed cost structure of branches, franchisee support, and relationship management staff.
While wholesale debt broking has reduced top-line revenue volatility and margin lending has shifted a portion of income to balance-sheet interest, neither initiative has fully decoupled net earnings from market turnover. A structural test of earnings resilience would require a fiscal period in which broking revenue declines while overall net profit after tax continues to grow. In fiscal 2026, that benchmark was not met, as total revenue rose slightly while net profit fell 21%.
VI. Strategic Analysis: Competitive Moats, Helmer's 7 Powers & Industry Dynamics
To evaluate Aditya Birla Money's competitive positioning, a single month's industry data illustrates the scale disparity. In August 2026, the Indian broking industry added approximately 5.12 lakh net active clients. Groww captured 2.23 lakh of those new accounts—representing 44% of total net additions—bringing its active client base to roughly 1.33 crore and its market share to 29.04%. Angel One added 84,636 clients; Zerodha gained 34,501; and ICICI Securities added 23,385. Together, the top five brokers accounted for more than 67% of all active clients nationwide.3
During that single month, Groww added more than three times Aditya Birla Money's entire active client count, while Angel One expanded by more than Aditya Birla Money's total client base. Rather than competing directly in the same arena, the discount leaders and traditional incumbent brokers effectively operate in distinct market segments under a common regulatory framework.
This industry structure defines the strategic choices available to market participants. Indian retail broking has consolidated into a scale oligopoly at the top—where near-zero marginal costs per trade, substantial fixed technology investments, and organic customer acquisition compound over time—and a fragmented tail of brokers holding market shares below 1%. Mid-sized operations have largely disappeared. Broking firms in the tail cannot compete on price, while competing on full-service advisory requires clients willing to pay premium commissions—a shrinking pool in an increasingly self-directed market.
Helmer's 7 Powers, applied honestly
Scale Economies — very weak in retail broking, arguably present in WDM. In retail broking, the fixed expense of maintaining a competitive trading platform, risk management engine, and compliance system is spread across roughly 68,000 active clients rather than 1.3 crore. Consequently, per-client technology overhead is approximately two orders of magnitude higher than that of industry leaders. In wholesale debt, scale is informational—built on market visibility and counterparty coverage—where the company has established a credible presence from a modest initial base.
Network Effects — absent. A retail brokerage's clients derive no direct utility from the presence of other clients. Groww's advantage stems from operational scale and brand visibility rather than network dynamics. The absence of network effects means discount leaders are theoretically more vulnerable to disruption than true platform networks, though not from traditional incumbents hampered by branch overhead.
Counter-Positioning — absent, and inverted. Counter-positioning operates primarily against Aditya Birla Money. The low-cost model of discount brokers cannot be replicated by a traditional full-service firm without dismantling the fee structure that funds its physical distribution network. The company continued expanding physical branches through FY25 across tier-two and tier-three wealth clusters—a rational approach if clients pay for advisory services, but a margin-depressing strategy if investors transition to self-directed trading.
Switching Costs — low in retail, moderate in specialized segments. Self-directed retail equity traders face minimal friction when changing brokers. Conversely, high-net-worth clients maintaining Margin Trading Facility positions, portfolio management mandates, and structured debt holdings encounter real friction; unwinding leverage and transfering wealth mandates involves operational disruption. In wholesale debt, switching costs are relational rather than contractual. Consequently, the firm's switching costs are concentrated in the specialized segments generating its incremental revenue.
Cornered Resource — moderate, and unproven. The firm's cited advantage is the Aditya Birla brand combined with potential access to Aditya Birla Capital's customer base through the group's ABCD digital ecosystem. Access to internal referrals at low acquisition costs would represent a significant competitive benefit. However, reported client counts present a counter-argument: if cross-selling were operating at scale, active retail client numbers would be expanding rather than contracting.4 Without explicit disclosure of ecosystem-driven account openings, this channel remains an unverified strategic asset.
Process Power and Branding — not credibly present at the listed-entity level. Disclosed operations show no evidence of proprietary process advantages, and while brand trust remains intact, it has not translated into retail market share expansion.
Evaluating the business across Hamilton Helmer's framework indicates that the company lacks strong competitive moats across six of the seven powers in its primary retail segment. The firm's defensible footprint is confined to relationship-based wholesale debt intermediation and margin lending for affluent clients who prioritize service over execution pricing. While this represents a viable niche, it does not constitute a broad enterprise moat.
Porter's Five Forces
Rivalry: extreme. Zero-commission delivery pricing from scaled competitors has established zero as the baseline retail fee, creating a price floor that full-service brokers cannot undercut.
Buyer power: extreme in retail, moderate elsewhere. Retail clients experience low switching costs and high price transparency. Institutional bond counterparties negotiate transaction spreads carefully, though they prioritize execution reliability over incremental fee discounts.
Supplier power: structurally high and rising. Market infrastructure institutions—exchanges and depositories—control core distribution. SEBI's true-to-label regulatory framework, which requires brokers to pass through exact exchange fees without markup, removed float and rebate income that historically supported brokerage unit economics.11
Threat of substitution: high and broadening. Direct mutual fund platforms, index products, small-savings schemes, and alternative investment funds compete directly for investor capital without generating trading commissions.
Threat of new entrants: low for scale players, irrelevant for the tail. The barrier to entry is not regulatory licensing, but the capital required to acquire clients against dominant incumbents holding 29% market share and strong organic brand pull.
Regulatory pressure: the dominant near-term force. SEBI's index derivatives regulations, phased in from November 2024, restricted exchanges to weekly expiries on a single benchmark index and increased contract sizes, with additional tightening applied through 2025.11 Designed to curb retail derivative speculation, the framework contracted the industry's most profitable revenue stream. Firms heavily reliant on retail derivative turnover absorbed significant revenue declines, placing Aditya Birla Money's 18.6% drop in FY26 broking revenue in clear regulatory context.2
Regulatory tightening on retail derivatives affects discount brokers more severely than institutional bond desks. If restrictions on equity derivatives persist, the relative contribution of wholesale debt and margin financing within the firm's revenue mix increases. However, the fourth-quarter FY26 recovery in equity derivative volumes suggests market adaptation, dampening that relative rebalancing.1
The war-game: what would it take to win retail back?
Evaluating a retail expansion strategy highlights why management has focused capital elsewhere.
Competing directly for mass-market retail share would require building a trading application on par with market leaders, representing continuous technology expenditure rather than a single software project. It would require adopting flat-fee pricing, eliminating traditional commission revenue from the retail book. Additionally, the firm would need a marketing budget capable of acquiring customers against established discount brands—where acquisition costs per active account historically required multiple years of client revenue to break even. Finally, this transition would need to occur while supporting 41 branches and 807 franchisee offices reliant on traditional commission structures.4
Executing such a turnaround carries a negative net present value for a firm with a market capitalization of approximately ₹720 crore.5 Deciding not to pursue mass-market retail scale represents a pragmatic allocation of capital. However, refraining from competing leaves the retail broking franchise in structural decline, constraining the firm's overall retail growth prospects.
The peer comparison that actually matters
Comparing Aditya Birla Money directly to discount platforms like Groww or Zerodha offers limited analytical value given their divergent operating models. A more relevant comparison set comprises bank- and conglomerate-backed full-service brokerages that faced identical industry shifts.
Bank-backed incumbents preserved substantially larger client bases: as of August 2026, ICICI Securities held roughly 21.56 lakh active clients (a 4.69% market share), Kotak Securities maintained about 13.92 lakh, and HDFC Securities held 13.51 lakh—with all three continuing to register net client additions.3 These client bases range between twenty and thirty times the scale of Aditya Birla Money.4
This performance gap stems from distribution funnels. Bank-affiliated brokers operate within captive banking ecosystems where tens of millions of customers engage daily with deposit and payment applications, allowing brokerage services to be cross-sold within an existing digital workflow. By contrast, a financial services conglomerate without a core banking app interacts less frequently with insurance or lending customers, converting cross-selling from an embedded feature into a traditional marketing campaign.
This structural difference tests the firm's distribution asset claim. Even bank-backed full-service brokers with direct account funnels have capped their retail market shares in the single digits, demonstrating that conglomerate distribution alone could not offset the broader industry shift toward discount broking.
Strategy questions eventually become questions about the people making the choices.
VII. Management, Capital Allocation & Skeptical Investor Stress Test
A chief executive officer taking charge of a sub-scale broker inside a financial services conglomerate faces a distinct strategic trade-off: the most rational choices for the parent group may render the subsidiary less compelling as an independent listed enterprise.
Ashok Suvarna became Chief Executive Officer of Aditya Birla Money on September 1, 2024, bringing three decades of sales and operational experience. Crucially, he had served within Aditya Birla Capital since 2008—the year the group acquired Apollo Sindhoori.1213 His background provides essential context for the firm's strategic orientation. Rather than an external turnaround executive hired to overhaul the business model, Suvarna is a group insider who observed the asset's evolution under Birla ownership from the parent company's perspective. The resulting strategy reflects that trajectory: deepening integration with the parent group, leaning into segments where institutional relationships outweigh retail fee competition, and declining to fund an expensive client-acquisition contest in mass-market broking.
At the parent level, Vishakha Mulye serves as Managing Director and Chief Executive Officer of Aditya Birla Capital, bringing a commercial banking background that emphasizes group-wide cross-selling and digital distribution.7 Consequently, Aditya Birla Money does not set its strategic agenda entirely independently; its technology roadmap, customer acquisition funnels, and shared infrastructure are determined within the parent organization.
The equity ownership structure reinforces this dynamic. Aditya Birla Capital holds a 73.53% stake, institutional ownership is negligible at 0.03% foreign and zero domestic institutional holding, and public shareholders hold the remaining 26.45%.14 This capital structure creates two opposing operational realities. Because a 73.53% promoter holding sits near SEBI's 75% public listing ceiling, the parent company cannot increase its stake through open-market purchases without triggering mandatory delisting proceedings. At the same time, the absence of institutional shareholders eliminates a primary source of public earnings scrutiny. A listed company without institutional float operates with limited external market accountability, regardless of its internal compliance standards.
Capital allocation: what the record shows
Three major capital allocation decisions define the company's recent record and warrant evaluation based on empirical outcomes.
Physical branch expansion. The company continued expanding its branch network through fiscal 2025 to target tier-two and tier-three wealth clusters, reaching a footprint of over 41 branches supported by 807 franchisee offices in fiscal 2026.4 Reallocating capital toward physical advisory centers rather than digital customer acquisition is defensible, given the high costs of competing directly with discount brokers for mobile app downloads. However, this strategy must be evaluated against financial outcomes: in fiscal 2026, net profit fell 21% alongside a contracting active client base.14 Physical expansion has not yet yielded measurable top-line retail growth, and the company does not disclose branch-level productivity metrics, average revenue per location, or vintage curves for newer branches. Without these operational disclosures, investors cannot determine whether physical expansion represents a patient long-term investment or unrecovered overhead.
MTF book growth. Deploying the balance sheet to fund client margin trading facilities rather than proprietary trading is a defensible choice and represents the clearest driver of recent stability, as evidenced by fiscal 2026 revenue disclosures attributing growth to higher interest income.2 However, this strategy shifts the company's underlying risk profile from transaction intermediation to credit underwriting, exposing earnings to credit cycle risks during market downturns. The firm does not publish key credit portfolio metrics, including total margin loan book size, average interest spreads, loan-to-value distributions, or historical margin call frequencies. During periods of severe equity volatility, these metrics are essential for assessing collateral quality and balance sheet liquidity.
The WDM desk. Establishing the wholesale debt market desk represents the company's highest-return capital deployment under Aditya Birla group ownership, expanding to generate nearly a quarter of total revenue with minimal capital expenditure and no acquisitions.8 Built gradually over eight years, the desk succeeded by establishing institutional trading coverage in a market segment with minimal consumer visibility.
Overall return metrics indicate capital compression rather than structural distress. Return on equity compressed from approximately 30% three years prior to 21.8% in recent disclosures, tracking the fiscal 2026 earnings decline.5 With market capitalization hovering between ₹720 crore and ₹754 crore in September 2026, management declared no dividend for fiscal 2026.15 Retaining full earnings in a business generating a low-twenties return on equity is a coherent capital allocation strategy if retained earnings directly fund margin lending spreads. Conversely, if retained capital accumulates as uninvested cash reserves, return on equity will suffer further compression. Investors should monitor how retained earnings are deployed across reporting periods.
From a governance perspective, the company maintains a clean historical audit record without qualified audit opinions. For a subsidiary of Aditya Birla Capital, a clean audit represents standard baseline compliance rather than a distinct competitive advantage. The primary governance factor involves operational dependencies: because the company relies on parent-provided information technology and shared corporate infrastructure, related-party cost allocations represent an integral component of the operating model. Determining how corporate overhead and shared technology expenses are split between the parent and subsidiary requires managerial discretion, directly influencing standalone profitability.
The activist stress test
An activist or institutional investor evaluating management's strategic position would focus on three unresolved operational questions.
First, the scale paradox. The rationale for maintaining Aditya Birla Money as a separately listed corporate entity remains unclear. Operating with approximately 68,000 active NSE clients, negligible institutional ownership, a market capitalization of roughly ₹720 crore, and parent ownership of 73.53%, standalone listing provides little access to fresh capital, acquisition equity, or institutional analyst coverage.4145 Meanwhile, standalone listing incurs ongoing board, compliance, audit, and regulatory reporting costs. The firm's performing segments—wholesale bond intermediation and affluent margin lending—could operate with similar efficiency within a consolidated Aditya Birla Capital wealth management division. While standalone listing provides public financial disclosures for minority investors, the current corporate structure appears to be a legacy of the 2008 Apollo Sindhoori acquisition rather than an optimized capital arrangement.
Second, the cross-sell reality. Management's strategic framework relies on customer sourcing from Aditya Birla Capital's broader financial ecosystem, yet active retail client counts challenge this claim.4 Evaluating the effectiveness of internal cross-selling requires specific operational metrics: how many active trading clients were acquired through parent ecosystem channels in fiscal 2026, at what customer acquisition cost, and with what retention rate? Without these disclosures, group synergy remains an unverified hypothesis rather than a functional competitive moat.
Third, regulatory yield compression. SEBI's index derivatives framework and true-to-label fee rules compressed transaction revenue across the industry, with the company's fiscal 2026 broking revenue decline illustrating the impact.211 A critical follow-up question is whether the net profit recovery in the fourth quarter of fiscal 2026 reflects a permanent structural adjustment or a cyclical volume rebound within a constrained regulatory framework.1 Management has not disclosed a normalized revenue-per-trade benchmark under the revised regulatory framework. Investors should track narrative consistency across future reporting periods: whether management continues emphasizing long-term wealth management diversification during market recoveries, or reverts to highlighting market turnover and transaction volume. Management priorities are demonstrated most clearly during cyclical upturns.
VIII. Bull vs. Bear Case & Key Forward KPIs
Evaluating Aditya Birla Money requires weighing two competing investment arguments that share identical empirical facts but disagree on which factors determine the firm's long-term trajectory.
The bull case
The bullish thesis does not depend on winning mass-market retail broking; rather, it assumes that the strategic pivot into specialized segments succeeds.
The debt desk compounds. Wholesale debt market revenue grew 63% in fiscal 2026 to reach 23.6% of total revenue, expanding during the company's most challenging operational year.28 India's corporate bond market remains structurally under-penetrated relative to bank credit, while regulatory policies continue encouraging large corporate borrowers toward market-based funding. A relationship-driven voice desk participates in this expansion with minimal incremental capital. If wholesale debt revenue reaches 35% to 40% of total top-line income while absolute broking revenue stabilizes, the firm's overall earnings quality shifts fundamentally.
Margin trading monetization. Margin lending converts a contracting retail client base into a higher-yielding net interest margin asset. Affluent clients utilizing leverage face substantial switching costs, creating higher revenue per account and greater earnings persistence. This strategy represents an intentional transition into a defensible niche.
Household financialization tailwinds. Indian household savings continue shifting from physical assets such as gold and real estate into financial markets. Operating within a conglomerate featuring asset management, life insurance, and health insurance entities provides product access aligned with this demographic trend.
Parent balance sheet stability. Group backing provides balance sheet solvency, favorable capital access, and the ability to navigate full market cycles without funding distress. While sub-scale independent brokerages succumbed to fee compression, Aditya Birla Money retained operational viability.
Fourth-quarter operational leverage. Net profit doubled on a 30.5% revenue increase in the fourth quarter of fiscal 2026, demonstrating that returning trading volumes convert into bottom-line earnings with high operational leverage.1
The bear case
Retail client contraction. The core bear argument rests on client trajectory: the active retail client base is actively contracting rather than merely stagnating. While the broader industry added over five hundred thousand active accounts monthly, Aditya Birla Money's active NSE client count declined from approximately 85,000 to 68,323.43 Contracting customer bases create persistent valuation headwinds that static franchises do not face.
Unresolved earnings cyclicality. Fiscal 2026 demonstrated ongoing earnings volatility, as consolidated revenue rose slightly while net profit fell 21.2%.1 An operational cost base comprising physical branches, franchisee support networks, and relationship managers does not contract automatically during volume downturns, causing revenue declines to impact bottom-line margins disproportionately. Strategic diversification has not yet generated net profit growth during a period of contracting broking commissions.
Ongoing regulatory tightening. The Securities and Exchange Board of India has consistently tightened retail derivatives regulations, with each intervention compressing the addressable pool of high-frequency trading revenue.11 Policy tightening represents a multi-year structural trend rather than a completed regulatory event.
Disclosure gaps mask segment unit economics. Key operational metrics—including margin loan book size and interest spreads, distribution assets under management and yields, wholesale debt client concentration, branch productivity, and ecosystem-derived account additions—are omitted from corporate disclosures. With foreign institutional ownership at 0.03% and domestic institutional holding at zero, external market pressure for expanded disclosure remains limited.14
Permanent scale disadvantage in retail. The two-order-of-magnitude client gap relative to discount leaders cannot be resolved through internal execution adjustments. This structural gap reflects a permanent counter-positioning outcome.
Weighing it
The bull and bear cases present an asymmetric risk profile.
The proposition that Aditya Birla Money will regain retail market share is unsupported by empirical evidence. Similarly, the claim of full earnings insulation across market cycles is refuted by fiscal 2026 performance, surviving only in a narrow top-line capacity. Furthermore, group cross-selling claims remain unverified given contracting active client numbers.
Conversely, the wholesale debt desk thesis is supported by empirical results: a 63% revenue growth rate achieved during a downturn in retail broking provides concrete evidence of counter-cyclical revenue diversification. Nevertheless, wholesale debt broking represents a single business unit generating less than a quarter of total revenue, with unquantified client concentration risks and an eight-year operational history.
Consequently, Aditya Birla Money is best characterized as a specialized institutional and margin-lending business operating inside a structurally disadvantaged retail brokerage. The central investment question depends entirely on whether wholesale debt and margin financing can expand faster than legacy retail broking contracts.
The risk radar, restricted to what is material
Four material risk factors define the company's outlook.
Regulatory policy risk remains the dominant exposure. Regulatory interventions represent both the primary historical drag on broking income and a potential relative stabilizer if retail derivatives face further restrictions. As a policy-taker, the company possesses no direct hedging mechanism against regulatory changes.
Cyclical demand risk operates across both primary revenue engines. Equity market turnover directly drives broking commission fees, while market appreciation expands margin lending demand. Consequently, the firm functions as a leveraged exposure to Indian equity market activity, partially offset by a wholesale bond desk generating roughly one-quarter of total revenue.
Credit and collateral risk in margin financing represents an unquantified exposure. Margin lending operates safely during market rallies but exposes balance-sheet capital to collateral devaluation and liquidity constraints during sharp market declines.
Key-person concentration risk in wholesale debt affects the firm's main growth desk. Because wholesale bond intermediation relies on institutional relationships managed by a specialized team, the departure of key personnel could directly impact a ₹110.39 crore revenue line.8
By contrast, technology disruption in retail broking represents a past event rather than a forward risk; the company's residual model relies primarily on high-touch institutional and margin-lending relationships that resist complete automation.
The KPIs that matter
Three primary operational metrics determine the long-term outlook.
1. Wholesale debt market revenue share, quarterly. This metric tracks the structural pivot directly. Wholesale debt represented 23.6% of total revenue in fiscal 2026.8 Continued share expansion alongside stable broking income indicates a shifting business mix, whereas a plateauing revenue share leaves the firm reliant on retail market cycles.
2. Active NSE client count, monthly. Published monthly by the exchange, active client counts provide an objective tracking metric. The key factor is whether the client base stabilizes or continues contracting from historical levels around 85,000 down to 68,323.4 Continued account contraction would eventually shrink the client pool supporting margin lending and wealth distribution.
3. Net profit growth during periods of broking revenue contraction. This benchmark evaluates earnings resilience across cycles. In fiscal 2026, broking revenue fell while net profit dropped 21.2%, failing to demonstrate decoupled earnings resilience.1 Future reporting periods during market downturns will provide the test of business model diversification.
IX. Playbook: Business & Investing Lessons
1. Conglomerate backing solves the wrong problem. The Aditya Birla group brought brand trust, funding access, and staying power to a brokerage facing a structural cost-structure challenge. Brand equity is a demand-side asset, whereas the competitive threat arrived on the supply side, where tech-native competitors brought marginal costs per trade near zero. When the core threat is unit economics, a strong parent buys time without securing a structural solution—and spending time without a cost-structure answer is how a 2008 acquisition yields a 0.15% market share by 2026.4 The broader strategic lesson: evaluate whether an incumbent's structural disadvantage lies on the demand side or the supply side before assuming brand equity provides a defensive moat.
2. When scale is lost, the winning move is to stop competing for it. Management's most effective strategic decision was declining to spend heavily on mass retail client acquisition, focusing instead on building a wholesale debt desk that expanded 63% during the company's most difficult operational year.2 Commoditized trade execution becomes unviable once pricing drops to zero. By contrast, relationship-driven wholesale markets, balance-sheet lending for clients seeking leverage, and specialized wealth advisory remain defensible on distinct economic terms. The broader trade-off is that this pivot yields a smaller, niche-focused enterprise that public equity markets often struggle to value.
3. Cycle timing in financial services M&A is fundamental to investment returns. Signing an agreement to acquire a turnover-dependent brokerage in August 2008 at peak 2007 valuation multiples resulted in a decade of subdued capital returns that subsequent operational restructuring could not fully offset.6 When a target company's earnings function as a leveraged bet on market variables beyond an acquirer's control, purchase multiples should be evaluated against mid-cycle earnings rather than peak trailing performance. While this valuation principle is widely recognized in theory, corporate boards frequently overlook it during market peaks when transaction confidence runs highest.
4. Fixed cost bases convert cyclical revenue into volatile earnings. Fiscal 2026 illustrated this dynamic: full-year revenue rose 3.4% while net profit declined 21.2%, followed by net profit doubling in the fourth quarter as trading activity recovered.1 Overhead tied to physical branches, franchisee support networks, and relationship management personnel does not automatically adjust downward when market turnover contracts. Before accepting a financial firm's revenue diversification narrative, investors should analyze whether the underlying cost base has diversified alongside top-line income. In this case, the fixed cost structure remained largely unchanged, causing earnings to fluctuate significantly even as top-line revenue held steady.
5. A standalone public listing does not guarantee effective governance or market scrutiny. With negligible institutional ownership, limited analyst coverage, and promoter holding at 73.53%, a standalone listing imposes regulatory reporting burdens without attracting the institutional scrutiny that makes public disclosure effective.14 Minority shareholders in majority-owned subsidiaries should consider what value a public float provides—particularly when key operational metrics needed to evaluate segment strategy remain undisclosed.
X. Epilogue & Future Outlook
There is a plausible path for the company's next five years: Aditya Birla Money gradually pivots away from mainstream retail broking without ever formally announcing the departure.
In that scenario, the wholesale debt desk continues expanding alongside India's corporate bond market until its revenue approaches parity with broking. The margin trading book becomes the principal balance-sheet asset—funded by retained earnings and parent credit lines—earning net interest spreads from affluent clients who prioritize leverage and execution over minimal commission rates. The branch network transitions from a mass acquisition funnel into a regional wealth-advisory footprint in tier-two cities, where physical advisory still commands value. Meanwhile, deeper integration with the parent group's digital ecosystem—supported by automated distribution tools—lowers servicing costs for a client base that expands in assets per customer rather than account headcounts. The listed entity becomes a specialized wealth-and-debt intermediation vehicle inside a major financial group: profitable, niche, and detached from retail market-share tables.
The evidence supporting that trajectory is tangible: a 63% expansion in wholesale debt revenue during a difficult operating year, interest income cushioning fee declines, and a strategic direction pursued consistently since 2018 rather than launched as a recent rebranding.28
The counter-evidence is equally visible in corporate filings. The active retail client base is contracting rather than stabilizing.4 Consolidated net profit fell 21.2% in fiscal 2026 despite the ongoing segment pivot.1 Crucially, key metrics required to verify unit economics—such as loan book yields and distribution assets—remain undisclosed. Furthermore, recent regulatory tightening demonstrated that the firm remains a policy-taker in its core segment, unable to insulate revenue from exchange-level changes.11
The broader insight centers on what eighteen years of conglomerate ownership have demonstrated. When Aditya Birla Nuvo acquired control of a Chennai-based brokerage in 2008, the thesis was that parent backing could expand a regional franchise into a national scale player. That thesis was tested over time and disproved—not by execution failure alone, but by digital operating models that rendered physical branch networks obsolete. What conglomerate backing provided instead was the balance-sheet stability to absorb strategic missteps and pivot toward a secondary model. Whether that secondary model yields a durable niche business or a temporary shelter inside a shrinking domain will be determined by execution rather than strategy documents. The outcome will depend on the three operational metrics tracked across future quarterly reports.
The company will publish those numbers. Yet with foreign institutional ownership at 0.03% and domestic institutional holding at zero, much of the public market may barely be watching.14
References
-
Aditya Birla Money Q4 FY26 Results: PAT Doubles to ₹18.73 Crore, Revenue +30.5%, FY26 Annual PAT ₹58.48 Crore — Univest, 2026 ↩↩↩↩↩↩↩↩↩↩↩↩↩↩↩↩
-
Aditya Birla Money Limited — Annual Report FY2025-26 (filed with NSE, 2026-07-07) ↩↩↩↩↩↩↩↩↩↩↩↩↩↩
-
Groww adds 2.23 lakh active clients in August; Sahi clocks 11% growth — Entrackr, 2026-09 ↩↩↩↩↩↩
-
Aditya Birla Money Review 2026 — Brokerage Charges, Active Clients, Branch Network — Chittorgarh ↩↩↩↩↩↩↩↩↩↩↩↩↩↩↩
-
Aditya Birla Money Ltd — Share Price, ROE and Market Capitalisation — Value Research Online ↩↩↩↩↩↩↩
-
Aditya Birla Money Ltd — Company Profile and Corporate History — The Economic Times ↩↩↩↩
-
Aditya Birla Capital Limited — Investor Relations and Financial Reports ↩↩
-
Aditya Birla Money: Net Profit Soars 101% YoY; Which Segment Contributed the Most Revenue? — Trade Brains, 2026 ↩↩↩↩↩↩↩↩↩
-
NSE active clients see 21% rise in FY25; Groww cements lead with 36% growth — Business Standard, 2025-04-11 ↩
-
Aditya Birla Money Ltd Q4 FY25 net profit slides to Rs. 9.32 crores — EquityBulls, 2025-05 ↩
-
SEBI's new rules for index derivatives: Here's what's changing — Z-Connect by Zerodha ↩↩↩↩↩
-
Aditya Birla Money Limited Appoints Ashok Suvarna as Chief Executive Officer, Effective September 01, 2024 — MarketScreener India ↩
-
Ashok Suvarna appointed CEO of Aditya Birla Money Limited — Exchange4media, 2024 ↩
-
Aditya Birla Money — Latest Shareholding Pattern: Promoter, FII, DII, Mutual Fund — Trendlyne ↩↩↩↩↩↩
 LinkedIn
 WhatsApp
 Reddit
 Hacker News
 Email
Email Kindle
 RSS Feed
 Spotify
 Apple Podcasts
 Amazon Music
 Audible
 YouTube