Aster DM Healthcare: The Story of the Company That Sold Its Gulf Empire and Merged With Its Private-Equity Twin
I. Introduction & Episode Roadmap (≈5 min)
Picture a shareholder in Kochi on a Tuesday evening in late September 2026, opening a fact sheet on the hospital company they have owned for years. The first number stops them cold. For the quarter ended March 2024, revenue is shown as minus $795 million. It is not a smaller figure or a loss. The revenue itself is negative, as though patients had come in and the hospitals had paid them to leave.
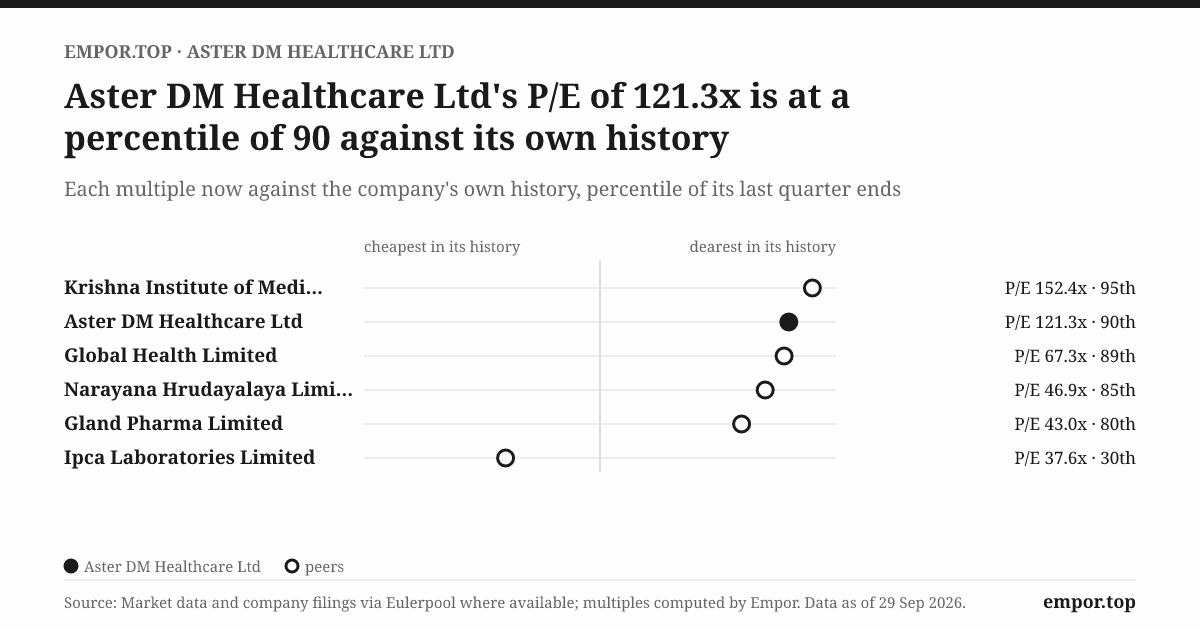
Scroll down and it gets stranger. Revenue has apparently fallen about 11% a year over five years. The stock trades at 121 times trailing earnings, against a five-year median of about 29.5 times1. Yet the company behind these numbers has never been busier. It now runs 39 hospitals with roughly 10,900 beds across 28 cities, and on 29 September 2026 the market valued it at about ₹38,636 crore21.
So which is it: a shrinking business priced for perfection, or a growing one hidden behind broken arithmetic?
The answer is that the reported history of Aster DM Healthcare, now branded Aster DM Quality Care, is not one company's history. It is at least three companies stitched together with accounting seams, and almost every alarming number on the screen sits on one of those seams.
The first seam is the Gulf. For most of its life Aster was a Gulf hospital, clinic and pharmacy group with an Indian arm attached. In 2024 it sold the Gulf half for an enterprise value of about US$1.65 billion, roughly ₹13,540 crore, and restated its accounts to show India alone3. That restatement is why revenue appears to fall 71% in FY2023 and why one quarter shows a negative figure: the Gulf revenue was being pulled back out of the books.
The second seam is the gain on that sale. In FY2025 the company booked net profit of about $636 million, almost all of it the one-time profit on selling the Gulf business, and paid out more than it earned as a special dividend14. Any growth rate that starts or ends in FY2025 is measuring that windfall, not hospitals.
The third seam is the newest. On 1 July 2026 Aster merged with Quality Care India Limited (QCIL), a hospital chain controlled by Blackstone25. The share count jumped overnight. But the trailing twelve months of earnings still belong mostly to the smaller, pre-merger Aster. Divide today's larger company's market value by yesterday's smaller company's profits, and you get 121 times.
The verdict for this opening is simple. The reported history is a set of seams. The story is what sits underneath them: a mid-sized Indian hospital operator that has grown steadily and widened its margins, and which has just doubled itself in a single transaction.
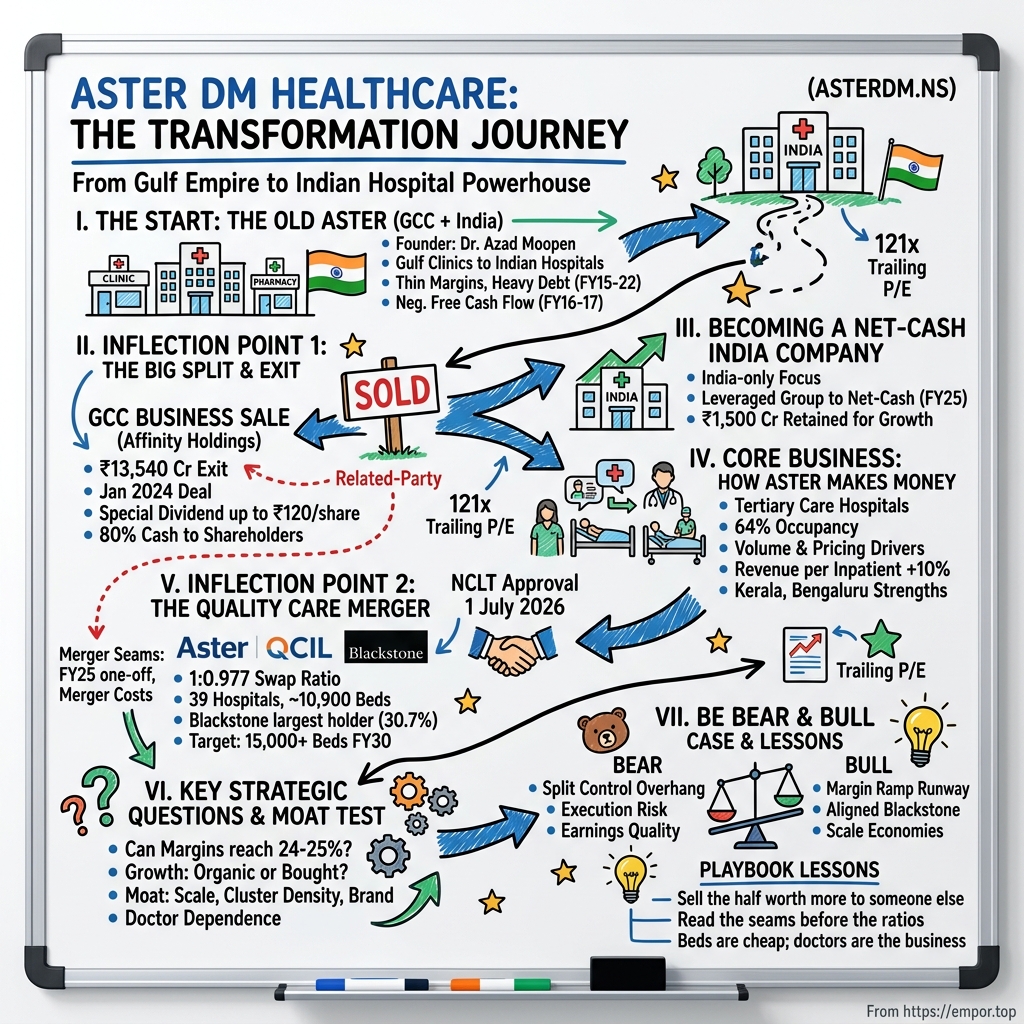
This episode works through four questions. First, is the growth created by the business, or bought through the merger? Second, can margins climb to the 24–25% management now talks about? Third, does the quality of earnings justify what the market is paying? And fourth, who actually controls this company now that a founder's family and a private-equity giant sit across the boardroom table from each other as near equals?
To answer any of them, the story has to begin where Aster did: not in India at all, but in a small clinic in Dubai.
 Subscribe on LinkedIn
II. From Gulf Clinics to Indian Hospitals: The Company Before the Split (≈10 min)
In 1987, a young doctor from Kerala named Azad Moopen opened a single-doctor clinic in Dubai6. It was an unglamorous start in a place thousands of Keralites were moving to for work. The Gulf's migrant population needed affordable doctors who spoke their language and understood their lives. Moopen had trained as a physician and taught medicine in Kerala before leaving. He saw that the clinic, not the grand hospital, was the front door of healthcare for these families.
Over the next three decades that front door multiplied. Clinics fed pharmacies. Pharmacies fed diagnostic centres. Eventually the network fed hospitals in the UAE, Oman, Saudi Arabia and elsewhere in the Gulf. The Aster, Medcare and Access brands became familiar names across the region.
India was the second act. Moopen took the model back to Kerala and then to Karnataka, building large tertiary-care hospitals, the kind that handle cardiac surgery, cancer treatment and transplants rather than colds and fractures. Aster Medcity in Kochi became the flagship. In India, though, the approach ran the other way round: hospitals first, the feeder network later.
In February 2018 the group listed on the NSE and BSE as Aster DM Healthcare7. Investors were buying a Gulf healthcare business that happened to be listed in Mumbai. India was the smaller, faster-growing and more capital-hungry sibling.
What the numbers of that era really say
Consolidated revenue climbed from about $632 million in FY2015 to about $1.4 billion in FY2022, including the Gulf1. That is real growth. What happened to margins is less flattering. Operating margin, meaning profit from running the business before interest and tax, sat between roughly 4% and 10% for the whole period. For a healthcare operator with a pharmacy arm that is thin.
The growth was also bought with borrowed money. Borrowings rose from about $114 million in FY2015 to a peak of about $793 million in FY2020, when debt reached 1.72 times shareholders' equity1. Part of that jump reflects new lease accounting under IndAS 116, adopted in FY2020, which brought hospital leases onto the balance sheet as debt. But the direction was clear before that change. The company was building ahead of demand and paying for it with debt.
Free cash flow was negative at about $85 million in both FY2016 and FY20171. That was the cost of pouring concrete for beds that would not fill for years. Returns on capital employed stayed between roughly 5% and 9% through the decade. That is a return a well-run bank deposit in India could rival.
There is noise in the record too. In FY2016 the tax rate hit 78% of pre-tax profit and the company reported a small net loss1. Profits across different countries, tax jurisdictions and loss-making start-up units rarely add up neatly. The Gulf has little or no corporate tax on most of this business, while Indian profits are taxed, so the group rate swung with the mix.
Working capital tells the same story as the pharmacy-heavy Gulf model. In FY2015 the group took about 92 days to collect from customers, held about 134 days of inventory, and took about 186 days to pay its suppliers1. Long supplier credit funded long receivables, which is typical of a Gulf model where insurers pay slowly and distributors lend patiently.
Why the long-run growth rates are broken
The fact sheet reports revenue falling about 11.4% a year over five years and about 1.2% a year over ten1. Both numbers compare an India-only endpoint with a Gulf-inclusive start. They are the equivalent of measuring a person's height after cutting them in half. Nobody should read them as a trend.
The honest summary is this. The old Aster was a leveraged, thin-margin Gulf healthcare group with an Indian option attached. It grew, but it did not earn much on the capital it used. That combination, heavy debt and returns barely above the cost of money, is exactly what makes a sale attractive, and by 2023 the founder had found a buyer.
III. The ₹13,540 Crore Exit: Selling the Crown Jewel (≈15 min)
In January 2024, Aster DM Healthcare announced it would sell its Gulf business, held through a company called Affinity Holdings, to Alpha GCC Holdings3. The price was an enterprise value of US$1,651.2 million, about ₹13,540 crore. The company told shareholders it would pay out a special dividend of up to ₹120 a share from the proceeds3.
The buyer was the interesting part. Alpha GCC was a consortium led by Fajr Capital, a Gulf private-equity investor, which held 65%. The other 35% belonged to the Moopen family, the same promoters who controlled the seller3. The founder was selling the business he had built to a company in which he would keep a third.
This is the moment to slow down, because it is the most important capital-allocation decision in Aster's history and it has an obvious conflict built into it.
Was the price good?
Start with what the buyer paid for. Before the sale, the group's consolidated EBITDA (earnings before interest, tax, depreciation and amortisation, a rough measure of cash operating profit) was about $205 million in FY20221. India alone produced about $59 million in FY2023 once the accounts were restated. The Gulf business was therefore generating something like $140–150 million of EBITDA a year. That figure includes lease costs moved out of EBITDA by IndAS 116, so on a pre-lease basis it would be lower.
Divide the $1.65 billion enterprise value by that and the implied multiple is roughly 11 times EBITDA. That is a rough calculation from the group's own reported figures, not a number the company published, and it could move a turn or two either way depending on how leases are treated.
Is 11 times full? For a Gulf healthcare business with a large low-margin pharmacy arm, it looks reasonable to healthy. Listed Gulf hospital operators have historically traded in a wide range, and the comparable deal base in the region is thin. Indian hospital chains, by contrast, trade at 25 to 40 times EBITDA. So the Gulf business was sold at a Gulf multiple while the Indian business was left to be valued at an Indian one. That gap is the real logic of the deal.
Who benefited?
The sale was priced with fairness opinions, and the shareholders approved it3. But the promoters sat on both sides of the table. As sellers, they wanted a high price. As 35% owners of the buyer, they wanted a low one. A minority shareholder had only the first interest.
Did minority holders get the same terms as the promoters? In the narrow sense, yes. Every shareholder received the same ₹118 per share special dividend, paid by late April 20244. In the wider sense, no. Only the promoters got to keep a slice of the Gulf business's future through their stake in Alpha GCC. If the Gulf business grows in value from here, the Moopen family captures 35% of that upside and public shareholders capture none. That is not proof of an unfair price. It is a reason why the price deserved extra scrutiny, and the company gave shareholders no independent mechanism beyond the fairness opinion and the vote.
Where the money went
The ₹118 dividend absorbed about 80% of the net consideration of US$907.6 million that reached the listed company4. About ₹1,500 crore stayed on the balance sheet4. In FY2025, cash from investing activities was a positive $711 million as the sale proceeds came in, and cash from financing was a negative $752 million as the dividend went out1. Borrowings fell from about $710 million to about $167 million1.
In one year, a leveraged Gulf-and-India group turned into a net-cash Indian hospital company. That is the single cleanest thing the sale achieved.
This also explains an eye-catching line on the fact sheet: over twelve years, dividends paid add up to 323% of free cash flow1. Taken literally, that would describe a company borrowing to pay shareholders. In reality, it describes one special dividend funded by an asset sale. Payout was about 115% of net profit in FY2025 and about 13% in FY20261. The special dividend was a one-off, not a policy.
Myth vs reality: capital discipline
Management and many investors framed the sale as capital discipline, returning cash rather than hoarding it. That is half true. Handing back 80% of the proceeds was disciplined. But the sale was also the fix for a problem the company created. From FY2017 to FY2023, debt ran above 1.2 times equity in most years, and borrowings stayed between about $645 million and $793 million from FY2020 to FY20221. The leveraged expansion of 2015–20 produced single-digit returns on capital. The sale narrowed the claim of discipline to a smaller one: management was willing to recognise that the Gulf business was worth more to someone else, and to act on it. That is a real virtue. It is not evidence of a long record of careful capital allocation.
With the Gulf gone and the debt paid down, what was left was a pure Indian hospital company. The question then became whether that company could earn its keep.
IV. The Core Business: How an Indian Hospital Chain Makes Money (≈15 min)
Walk into a tertiary-care hospital in Kochi or Bengaluru. About two in every three beds are occupied, a figure the combined group put at 64% in the June 2026 quarter8. Each occupied bed earns a certain amount a day. Each surgeon who joins brings patients, and each patient brings procedures, drugs, scans and nursing days.
This is the hospital business in its simplest form: a building full of beds, filled by doctors, paid for by patients, insurers and the government.
The pricing unit
Indian hospital investors watch two numbers above all. The first is ARPOB, average revenue per occupied bed per day, which measures how much each filled bed earns. It rises when a hospital does more complex work (a heart bypass, not a hernia repair) and when prices rise. The second is occupancy, the share of beds that are filled.
For the merged group, revenue per inpatient reached ₹1,36,802 in Q1 FY27, up about 10% on a year earlier8. That growth comes from a mix of price increases and a shift toward complex procedures. Management has told investors to expect 7–8% annual growth in revenue per patient and 5–6% growth in patient volumes8. Add those together and the organic target is a low-teens revenue growth rate.
Who pays matters as much as how much. Cash-paying patients and private insurers pay full tariffs. Government schemes such as the central health-insurance programme pay much lower, fixed rates. At QCIL, cash and insurance made up about 80% of business in the June 2025 quarter9. Aster does not publish the equivalent split for its own hospitals in its investor materials, which is a gap given how much the payor mix drives margins.
What the listed company actually did
Strip out the Gulf and the Blackstone merger and look only at the Indian business from FY2023 to FY2026. Revenue grew from about $368 million to about $526 million, about 16% a year in rupees1. Operating margin rose from about 9% to almost 14%. Operating profit grew about 34% a year1.
That is the clearest evidence in the whole record. Revenue rose steadily and profit rose more than twice as fast, which is what operating leverage looks like in a hospital: once the building, staff and equipment are paid for, each extra patient adds mostly profit.
The FY2024 growth of 23% was flattered by comparisons; FY2025 and FY2026 came in at 12% and 14%1. For FY2026 alone, Aster's standalone Indian business reported revenue of about ₹4,640 crore, up 12%, and an EBITDA margin of about 20.4%, up from 19.5%10. So the organic base rate is about 12–14% a year, with margins widening by roughly a point a year.
The merged number is a different animal
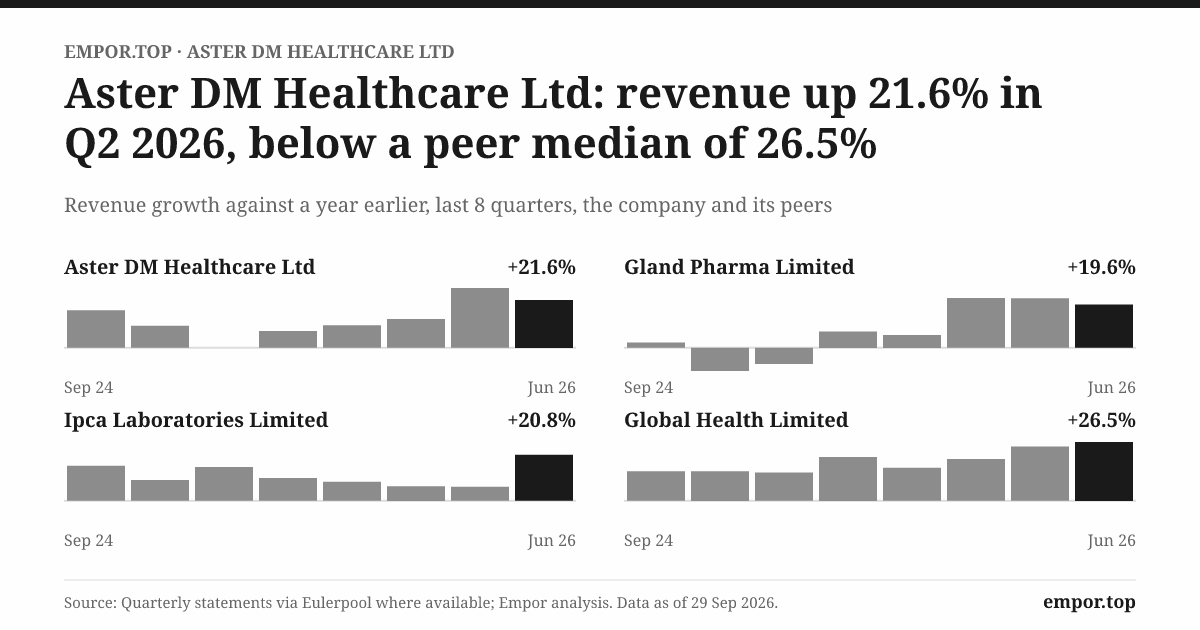
In the June 2026 quarter, the combined company reported revenue of ₹2,597 crore, up 20%, and operating EBITDA of ₹576 crore, up 30%811. Those figures compare the combined group with a pro forma combined group a year earlier. They are not the same as the listed company's organic rate.
A 20% figure is well above the 12–14% base rate. Some of the gap may be the QCIL hospitals growing faster, some may be new beds in both chains, and some may be definitional. Until the company publishes like-for-like numbers for the merged perimeter, the honest statement is that the 20% cannot be called organic.
Segments: hospitals carry the value
Aster's Indian business is overwhelmingly hospitals, with clinics, laboratories and pharmacies as a supporting layer. ICRA describes the revenue as diversified across all four12. The company does not publish a detailed segment split of revenue and margin in its headline results, but the economics are clear enough from the industry. Hospitals carry the value. Labs and pharmacies feed patients to the hospitals and add small margins of their own.
Where Aster stands among peers
India's listed hospital sector has a clear hierarchy. Apollo Hospitals is the largest and most diversified, with a pharmacy and digital business attached. Max Healthcare is the most profitable per bed, concentrated in north India. Fortis has national reach and a diagnostics arm. Narayana Health built its brand on low-cost cardiac surgery. KIMS and Rainbow are regional specialists, the first in Andhra Pradesh and Telangana, the second in children's and maternity care.
Aster was a mid-sized player before the merger, strong in Kerala and Karnataka and a challenger elsewhere. The QCIL merger lifted it to a claimed position among the top three chains in India by beds2. Its strength is the South, where its Kerala hospitals have a deep brand among the same families that once used its Dubai clinics. In the North it has little presence.
Why the P&L wobbles
Anyone tracking Aster by net profit will get motion sickness. Quarterly tax rates have ranged from about 5% to about 63%1. The FY2025 gain dwarfs every other year. And the latest quarter carries ₹114.4 crore of one-time merger costs11. Operating profit and EBITDA are the trend lines that matter. Net profit will not be a useful guide until FY2028, when both the sale and the merger have washed out of comparisons.
Beds are cheap; doctors are the business
The real operating asset is not the building but the doctor. In India, a senior cardiac or cancer surgeon brings a following of patients, and patients follow the surgeon when he or she moves. At QCIL, new doctor hires added about ₹10 crore a month of run-rate revenue in one quarter9. That is the upside. The downside is that the same surgeon can walk across the road to a rival and take the practice.
Neither Aster nor QCIL publishes doctor attrition or the revenue share of top clinicians. That matters, because the doctor is both the moat and the risk. Without that disclosure, the claim that Aster's clinicians give it a durable edge remains plausible but untested.
The listed company, then, grew organically in the low teens with steadily improving margins. That record gave Aster the credibility and the currency to do the biggest deal in its history.
V. Buying the Twin: The Quality Care Merger (≈15 min)
On 1 July 2026, a single order from the National Company Law Tribunal in Hyderabad turned two hospital chains into one513. The scheme set a swap ratio of 977 Aster shares for every 1,000 QCIL shares2. The record date for the share issuance was 9 July14. When the new shares landed, Blackstone, through its funds, held about 30.7% of the combined company. The Moopen family's stake fell to about 24%. Public shareholders held the remaining 45.3%2.
The company that had spent three decades as a founder-controlled enterprise now had a private-equity firm as its largest shareholder.
Who was Quality Care India?
QCIL was Blackstone's hospital platform in India. It brought together several regional chains, including CARE Hospitals in Hyderabad and the south, KIMSHEALTH in Kerala, and Evercare in Bangladesh9. Varun Khanna joined as group managing director in 2024 to run it2. By FY2025 it had about 12,400 employees against Aster's 13,8009.
In many ways it was Aster's twin: similar in size, focused on the South and East, and built on tertiary-care hospitals. The combined group now has 39 hospitals, about 10,900 beds and more than 37,700 staff, including over 7,400 doctors28.
Why the combination makes strategic sense
The fit is real. Aster was strong in Kerala and Karnataka; QCIL in Telangana, Andhra Pradesh and parts of central and eastern India. Overlap in Kerala, where both had flagship hospitals, creates cluster density: more referrals within the network, and shared procurement, staff and equipment. Management has guided to procurement synergies of 10–15%8, and QCIL alone booked about ₹20 crore of procurement savings in a single quarter before the merger closed9.
The combined group also plans to reach more than 15,000 beds by FY203010.
Did Aster overpay?
This is the hardest question and the evidence is incomplete. Before the merger, Aster bought a 5% stake in QCIL, issuing about 18.6 million of its own shares at ₹456.33 each in exchange for QCIL shares valued at ₹445.8 each9. That transaction set a reference price close to the eventual swap ratio. The fairness opinions supported the 977:1000 ratio.
To judge whether the ratio was fair, an investor needs to compare what each side brought. QCIL entered with net debt of about ₹308 crore at June 2025, plus about ₹600 crore of deferred consideration owed on past acquisitions and about ₹251 crore of lease liabilities9. Aster entered with net cash from the Gulf sale. Brokers valued both businesses at similar forward EBITDA multiples in the high twenties910. On that basis, the swap does not look obviously lopsided. But QCIL brought more debt and more obligations, and some of its hospitals ran at margins below 15%9.
Relative to other Indian hospital deals, the price sits within the range of recent transactions, where acquirers have paid high-twenties to thirties EBITDA multiples for quality hospital assets. Aster did not visibly overpay. Neither did it buy cheaply.
Why Blackstone wanted this
For Blackstone, the merger solved an exit problem. Private-equity funds must eventually return cash to their investors. Selling a hospital chain outright, or taking it public alone, is slow and uncertain. Swapping into a listed company gives Blackstone a liquid stake it can sell down over time through block trades. That is an efficient exit route, and it creates what investors call an overhang: the market knows Blackstone will sell eventually, and the knowledge alone can weigh on the price.
Side notes: Evercare Bangladesh and deferred payments
Evercare Dhaka, QCIL's Bangladesh hospital, earned an EBITDA margin of about 35% in the June 2025 quarter9. It is small in the group, but it brings taka currency exposure and Bangladesh political risk into a company that had just exited foreign exposure.
The ₹600 crore of deferred consideration is a reminder that QCIL grew by acquisition, and those acquisitions still carry unpaid bills.
Falsification: the integration record
Management's claim is that the merged group can reach 24–25% EBITDA margins within two to three years8. The strongest disconfirming evidence is the base rate of Indian hospital integrations, which often take longer and deliver less than promised. Clinicians leave, IT systems do not talk to each other, and underperforming units take years to fix. Blackstone's own platform was assembled from several acquisitions, some with deferred payments still due. The merger is too new for its own record to say anything yet.
So the claim is narrowed to this: the strategic logic is sound, the price is within the normal range, and the synergy target is plausible but unproven. Growth after the merger must be judged on like-for-like numbers.
And the biggest single number in that judgement is the margin.
VI. Can Margins Reach 24–25%? (≈10 min)
It is August 2026 and the merged company is holding its first results call as a single entity. The prepared remarks carry confident numbers: combined operating EBITDA of ₹576 crore, a margin of 22.2%, up 170 basis points on a year earlier, and occupancy up 510 basis points to 64%8. Then management lays out the road ahead. Volumes will grow 5–6% a year. Revenue per patient will grow 7–8%. And EBITDA margins will reach 24–25% within two to three years8.
That last claim is the crux. Another two or three points of margin on a combined revenue base approaching ₹10,000 crore a year would add a few hundred crore of annual profit. It is the difference between a hospital chain worth its current multiple and one that is not.
What is solid
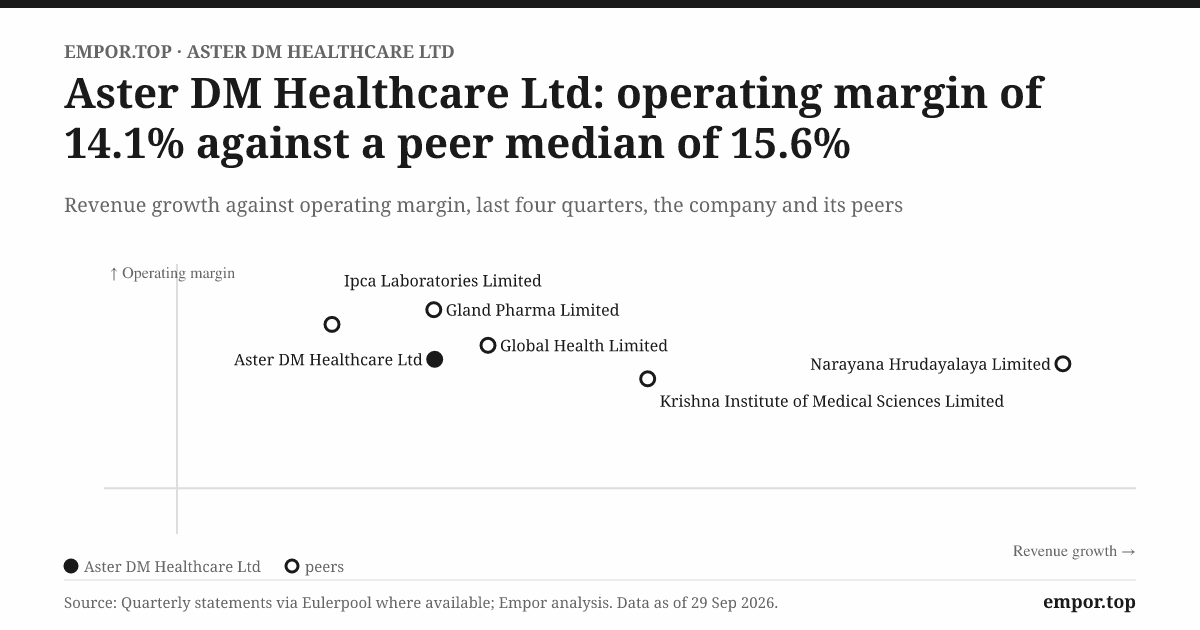
Margin expansion is real and has been consistent. The listed company's operating margin rose from 9% in FY2023 to almost 14% in FY20261, and its standalone EBITDA margin rose from 19.5% to 20.4% in FY202610. QCIL was improving too. Occupancy rose sharply in the latest quarter. In a hospital, higher occupancy spreads fixed costs (nurses, equipment, rent) over more paying patients, so margin follows occupancy almost mechanically.
What analysts pushed on
Where management was specific, it was on the headline mechanics: volume and price growth, procurement savings, and the bed pipeline. Where it was less specific was on the timeline and unit-level margins of the weaker hospitals. Several QCIL units sat below 15% EBITDA margin before the merger9. Lifting those hospitals toward the group average is the single largest lever for reaching 24–25%. It also takes the longest, because it usually requires recruiting senior doctors to build specialties from scratch.
Guidance discipline
A year earlier, in September 2025, broker models built on management guidance for both companies assumed steady margin expansion and a merged EBITDA margin in the low twenties by FY20279. The 22.2% reported in Q1 FY27 is in line with that. So far the targets have been met. But one quarter of merged results is too short a record to call guidance reliable.
What could break the claim
Four mechanisms stand out. Wage inflation for nurses and doctors, which has run ahead of general inflation in Indian healthcare. Tariff pressure from insurers and government schemes, which set a growing share of prices. Doctor poaching by rivals with deep pockets, including private-equity-backed newcomers. And integration delays that slow the merging of procurement and IT.
The verdict: margin expansion has been real and consistent for three years. The step from 22% to 24–25% is plausible, but it depends on fixing weak units and holding wage costs, and that has not yet been shown. The next four quarters are the test.
Margins are one half of earnings quality. The other half is whether profit turns into cash.
VII. Where the Cash Goes: Capex, Cash Conversion and Earnings Quality (≈15 min)
Open the FY2026 cash-flow statement of the pre-merger company. It shows EBITDA of about $108 million, but cash from operations of only about $76 million1. After capital spending of roughly $53 million, free cash flow comes to about $23 million1. At today's market value, that is a free-cash-flow yield of 0.2%.
For a company priced at 121 times trailing earnings, that is the question worth asking: how much of the reported profit arrives as cash, and how much of the cash is going straight back into concrete?
Cash conversion
Cash from operations was about 70% of EBITDA in FY2026, up from about 51% in FY20251. A healthy hospital operator typically converts 80–100%. The gap is not alarming, but it is not reassuring either.
The biggest reason is working capital. The company paid its suppliers much faster in FY2026: payable days fell from about 166 to about 551. Paying suppliers faster uses cash. Some of that is a one-time adjustment after the Gulf sale, when the pharmacy-heavy Gulf payables left the books. Some may reflect a deliberate decision to use surplus cash to win supplier discounts. The company's disclosures do not split the two.
Receivables
Debtor days were 24 in FY2026, against 23 and 27 in the two prior years1. That is a short and stable collection cycle for an Indian hospital, where cash patients pay at discharge and insurers pay within weeks. The alarming 295 days in FY2023 on the fact sheet is restatement noise, the Gulf receivables sitting against India-only revenue. It is not evidence of overdue balances. The company's annual report carries the full ageing and provisions for government-scheme dues, which are typically the slowest payers.
Capex: investing, not harvesting
The company is spending about 10% of its revenue on new capacity1. That is not a harvest phase. QCIL alone had plans to add about 1,200 beds for about ₹1,500 crore over two to three years9. In July 2026, the merged company announced a ₹1,315 crore investment to expand in Karnataka15. The 15,000-bed target for FY2030 implies thousands more beds10.
That raises a hard question. Return on capital employed was about 8.9% in FY20261. If new beds earn similar returns in their early years, the company is investing heavily at returns only modestly above its cost of capital. New hospitals typically lose money for two to three years before maturing. The bet is that mature beds earn much more, and the combined group's reported ROCE of 22.9% on its own measure suggests mature hospitals do8. The gap between 8.9% on the fact sheet and 22.9% in the company's presentation reflects different definitions: the company excludes cash, capital work in progress and new hospitals, while the fact sheet does not. Both are valid; they answer different questions.
The cash pile
At March 2026, the listed company held about $150 million of cash and short-term investments and about $148 million of other investments, together roughly ₹2,860 crore, against borrowings of about $252 million1. It was net cash before the merger. Some of the reported borrowings are IndAS 116 lease liabilities rather than bank debt, which makes the real net cash position stronger than the headline suggests. Interest income on that cash also flows into profit before tax, flattering pre-tax profit relative to operating profit.
Falsification: balance-sheet strength
The strongest disconfirming evidence to the claim of financial strength is the company's own record. Debt stayed above 1.2 times equity from FY2017 to FY20231. Today's net cash is not the product of a decade of disciplined operations. It is the product of one asset sale. The balance sheet is intact, but it has never been tested by a downturn in its current shape, and the merger added QCIL's debt and deferred obligations. The combined balance sheet will first appear in full with the Q2 FY27 results.
The latest quarter decoded
In the June 2026 quarter, net profit fell about 81% on a year earlier, while operating profit rose about 35%1. Those two numbers look contradictory. They are not. The tax rate jumped to about 63%, and merger-related costs of about ₹114 crore landed in the same quarter11. Neither is a sign of trouble in the hospitals themselves. Both are the accounting cost of changing the company's shape.
So what is the 121 times multiple actually measuring? Mostly a mismatch: the post-merger share count divided by pre-merger earnings, depressed further by one-off costs and a high tax quarter. Brokers value the combined business at about 27 times forward EBITDA109, against 40.6 times on the fact sheet's trailing basis1. The honest test of earnings quality is FY2027 earnings per share on the enlarged share count, with cash conversion above 80%.
Whether the market's price is justified depends on something more basic: whether the business has a durable edge.
VIII. The Moat Test: Porter's Forces and the Seven Powers (≈10 min)
Two hospitals stand a kilometre apart in the same city. Both are at about 64% occupancy. One has a renowned cardiac surgeon who has operated there for fifteen years. The other does not. When a middle-class family faces a heart operation, they choose the surgeon, not the building. That single fact explains much of the economics of Indian hospitals, and much of the difficulty of building a moat.
Porter's five forces
Buyer power. Individual patients have little bargaining power. Insurers and government schemes have a lot. They set package rates for common procedures, and a growing share of Indian healthcare is paid for by them. At QCIL, cash and insurance made up about 80% of revenue9. That is a favourable mix, but insurers are consolidating and pushing harder on tariffs.
Supplier power. Doctors are the most powerful suppliers. Senior specialists are scarce, command high fees, and can move. Equipment vendors and drug distributors have less leverage over a chain of Aster's size, which is where the procurement synergies come from.
Threat of new entrants. Building a tertiary hospital takes years and hundreds of crores. But private-equity money has flowed into Indian healthcare, and new chains are being assembled through acquisitions. The barrier is time and doctors, not capital.
Substitutes. For complex tertiary care, there are few substitutes. For routine care, day-surgery centres, clinics and telemedicine compete at the edges.
Rivalry. Competition happens city by city, not nationally. In a city where Aster runs the dominant hospital, rivalry is limited. In cities where Apollo, Manipal or others have large facilities, it is fierce.
Hamilton Helmer's seven powers
Scale economies. The merger gives Aster purchasing scale in drugs, consumables and equipment. The ₹20 crore quarterly procurement saving at QCIL is evidence this power is real9. But scale economies in hospitals are local, not national: a bigger chain buys more cheaply, but the hospital still has to win patients in each city.
Cluster density. This is the strongest power. A network of hospitals and clinics in one region, such as Kerala, can route referrals internally, share specialists and build a brand. Aster's Kerala cluster, combined with QCIL's KIMSHEALTH operations, now covers much of the state.
Brand. Aster's brand is strong in Kerala and among the Malayali diaspora. It is weaker elsewhere, where CARE Hospitals or other brands carry the name recognition.
Switching costs. Low for patients, who choose hospitals episode by episode. Low for doctors, who can move practices.
Network effects, counter-positioning, cornered resource, process power. None clearly applies. A star surgeon is the closest thing to a cornered resource, but the resource can leave.
Credit agencies' view
ICRA upgraded its short-term rating on Aster to [ICRA]A1+, citing the company's scale, improved credit profile after the Gulf sale, the promoters' experience and diversified revenues across hospitals, clinics, labs and pharmacies12. That is a sign of operational strength and financial stability. It says nothing about pricing power.
Peer benchmark
The best Indian hospital operators, Max Healthcare above all, have reported EBITDA margins in the mid-to-high twenties and ARPOB well above Aster's. Aster's combined 22.2% is respectable but not top of the class8. On valuation, Aster's trailing EV/EBITDA of about 40.6 times is distorted by the merger timing1. On forward estimates of about 27 times10, it trades somewhat below the richest peers, which suggests the market is pricing Aster as a good, but not the best, operator.
The verdict on the moat
Scale, cluster density and regional brand are the credible powers. Switching costs are low, and doctors can walk. The moat is real but narrow, and it is not yet proven by returns: an ROCE of about 9% on the fact sheet does not look like a business with a wide moat, even allowing for new hospitals still ramping up1. The merger could widen it through density and procurement. It has not done so yet.
A moat is only as good as the people running the castle, and at Aster, who runs the castle has just changed.
IX. Who Runs This Company Now? Control, Pay and Trust (≈10 min)
Imagine the first board meeting of the merged company. On one side sit three directors nominated by the Moopen family. On the other sit three nominated by Blackstone9. Dr Azad Moopen, who started with a single clinic in Dubai, is Executive Chairman. Running the company day to day is Varun Khanna, a professional manager who came in through Blackstone's QCIL, now Managing Director and Group CEO2.
Nobody at the table owns the company outright. The founder's family holds about 24%. Blackstone holds about 30.7%. Public shareholders hold 45.3%2.
The new management
Khanna's mandate is integration, margin expansion and executing the bed pipeline. He joined QCIL in 2024 and led it through the merger2. The company has not published the details of his incentive structure, ESOPs or shareholding in the merged entity in its headline announcements. Those details will appear in the next annual report and will matter, because a CEO rewarded on revenue growth behaves differently from one rewarded on return on capital.
Moopen's role has changed too. The promoter holding fell from about 42% before the merger to 24% after92. He did not sell. His stake was diluted by the new shares issued to Blackstone and other QCIL holders.
Capital-allocation credibility
The Gulf sale was well received by the market, and the special dividend delivered real cash to every shareholder. But the promoters sat on both sides of that deal. The QCIL merger added a second layer of related-party complexity: Aster bought its first 5% of QCIL from Blackstone before the merger9, and Blackstone and the promoters now share control. Neither deal was improper on the evidence. Both deserved closer scrutiny than a typical arm's-length transaction.
Pledges and audit trail
Before the merger, about 40.67% of the promoters' shares were pledged, according to BSE data at March and June 20259. A pledge means the shares have been used as collateral for a loan. If the share price falls sharply, lenders can sell pledged shares, pushing the price further down. The company's post-merger shareholding filings will show whether the pledge has changed.
The auditors noted in the FY2025 report that the audit-trail feature of the accounting software did not operate from 1 April to 30 September 2024, because the older software lacked that capability16. An audit trail records every change made to accounting entries. The gap was technical, not a finding of wrongdoing, and it was fixed. It is small and dated, but it is the kind of observation that careful investors note.
Falsification: management trust
To test the claim that management can be trusted with minority capital, the key evidence is voting results on the Gulf sale and the merger, executive pay against profit, and CFO turnover. Aster's shareholders approved both deals. The detail on dissent by institutional investors is in the company's voting results filings. Executive pay relative to profit is in the remuneration note of the annual report. On the available record, there is no evidence of a governance failure. There is also no long record of the new structure being tested.
Stress test: the skeptical investor
Would an outside investor accept this structure? A founder's family with 24%, a large portion pledged, sitting in board parity with a private-equity fund that will sell its stake over the next few years. Blackstone's incentive is to maximise the share price before it sells. The promoters' incentive is to preserve control and their legacy. When those incentives align, the structure works. When they diverge, for example over a large acquisition or a dividend, the board may deadlock.
This is a balanced but unusual structure: two blocks with equal seats and no clear owner. Trust will be earned on the record, not guaranteed by the structure.
X. Playbook: Business & Investing Lessons (≈5 min)
Go back to that negative $795 million quarter. It looks like a disaster. It is actually the fingerprint of the most important decision the company ever made. Five lessons come out of this story, and each one belongs to Aster.
Sell the half that is worth more to someone else. The Gulf business was Aster's origin and its biggest earner. It was also a leveraged, thin-margin business that the Indian market would never value as highly as a Gulf buyer would. Moopen sold it at a Gulf multiple, kept a slice through a private vehicle, and left public shareholders with an Indian hospital company valued at Indian multiples. The lesson for founders: your first business is not always your best one to keep. The lesson for investors: when a founder sells to himself, even partly, read the fairness opinion before the press release.
Read the seams before the ratios. A 121 times P/E, a negative revenue quarter and a five-year revenue decline all look like red flags. Each one is a seam in the accounts, not a fact about the hospitals. Investors who screen on trailing multiples will either run away from Aster or buy it for the wrong reason. Every restated company needs its history rebuilt before any ratio means anything.
A merged growth rate is not an organic growth rate. Aster grew about 12–14% a year on its own. The combined company reported 20% in its first quarter. The gap may be real growth at QCIL, or it may be the arithmetic of combining two perimeters. Until like-for-like numbers arrive, 20% is a claim, not a trend.
Beds are cheap; doctors are the business. A hospital building costs hundreds of crores, but it earns nothing without the surgeon whose patients follow them through the door. The ₹10 crore a month from new doctors at QCIL is the growth engine. The same surgeon walking across the road is the biggest risk.
Two big holders and no owner is a governance choice, not a neutral fact. A founder at 24% and Blackstone at 31%, with equal board seats, is a structure designed to balance power. It will work while their interests align and could deadlock when they do not.
XI. Analysis & Bear vs. Bull Case (≈10 min)
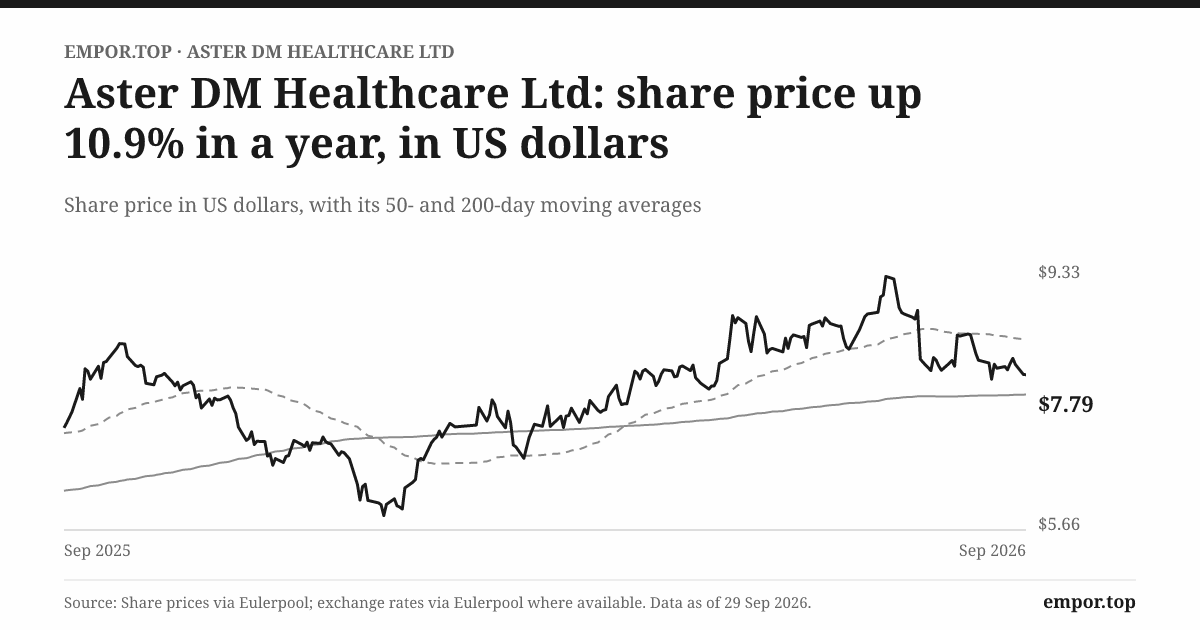
On 29 September 2026, Aster DM Quality Care closed at ₹747.40, about 14% below its 52-week high of ₹869.701. On trailing numbers it trades at 121 times earnings. On broker forward estimates, it trades at about 27 times EBITDA10. Those two numbers describe the same company from different angles, and the gap between them is the whole debate.
The bull case
The organic business has grown at 12–14% a year with steady margin expansion. Occupancy is at 64% with room to climb toward the 70–75% that the best Indian hospitals reach. The merger creates one of India's three largest hospital chains by beds, with cluster density in the South. The balance sheet was net cash before the merger. ICRA upgraded its credit view12. The 15,000-bed pipeline gives visible growth to FY203010. And Blackstone, as the largest shareholder, has every reason to push for a higher share price.
The bear case
The merger has diluted existing shareholders. One-off costs and tax noise will cloud earnings for at least a year. Cash conversion of 70% is below what a mature hospital should deliver. Doctor dependence and insurer tariff pressure are structural risks. The weaker QCIL hospitals may take longer to fix than guided. Blackstone will eventually sell, creating an overhang. And the split control structure could make big decisions harder.
What the market is paying for
At 27 times forward EBITDA, the market assumes margins will keep expanding and the bed pipeline will ramp without major delays. If margins reach 24–25% and cash conversion rises above 80%, that multiple looks defensible. If margins stall near 22% and integration drags, the stock is priced for a success it has not yet earned.
The reported ROCE of 22.9% from the company and 8.9% from the fact sheet also need reconciling. The first measures mature hospitals; the second measures the whole balance sheet, including cash and new builds. The truth for long-term investors lies in how quickly new beds move from the second number to the first.
Material risks
Integration execution is the biggest near-term risk. Wage inflation for nurses and doctors is the biggest structural cost risk. Tariff regulation, especially any government move to cap prices for common procedures, could compress margins. And a Blackstone sell-down could weigh on the share price regardless of operating performance.
The KPIs that matter
Three numbers will tell investors whether the story is working. First, like-for-like combined EBITDA margin, now 22.2%, up 170 basis points8. Second, occupancy and revenue per inpatient, now 64% and ₹1,36,802, both rising8. Third, cash from operations as a share of EBITDA, about 70% in FY2026 and rising from 51%1.
The case is balanced. Scale and margin runway on one side. An unproven merger, weak cash conversion and split control on the other. The next few quarters will decide which side is right.
XII. Epilogue (≈3 min)
Tonight, Aster DM Quality Care is a company in its first full quarter as a merged entity. Its hospitals are fuller than ever. Its margins are the highest they have been. Its balance sheet is carrying the cost of a merger that is still being digested. And its share price, about 14% below its peak, reflects a market still deciding what this new company is worth.
The next results, for the September 2026 quarter, will be the first with a genuine like-for-like combined comparison. If margins hold above 22% and occupancy keeps rising, the synergy story starts to look real. If the merged revenue growth drops back toward the low teens, the 20% first-quarter number will look like arithmetic.
The next shareholding filings will show whether the promoter pledge has changed after the merger and whether Blackstone has begun to sell. A block sale would test market depth and the overhang thesis in a single trading session.
The first credit rating for the merged entity will show whether ICRA or another agency sees the combined balance sheet as stronger or weaker than Aster's alone.
And by the end of FY2027, the company will report earnings per share on its enlarged share count, free of the Gulf gain and most of the merger costs. That number will finally let investors test the multiple.
If margins reach 24% with cash conversion above 80%, the price the market is paying today can be defended. If not, the merger will have delivered scale without economics, and Aster will be one more Indian hospital chain that grew bigger without growing better.
XIII. Outro (≈2 min)
Go back to the shareholder in Kochi, staring at a quarter where revenue was negative $795 million. It looked like a collapse. It was the opposite: the moment the company cut away the business that had made it rich, paid its shareholders, and began to turn itself into something new.
Aster sold the business that made it rich, then merged to become the one it had always wanted to be.
References
-
Aster DM Healthcare — Investor relations (annual reports and results filings) — Aster DM Healthcare ↩↩↩↩↩↩↩↩↩↩↩↩↩↩↩↩↩↩↩↩↩↩↩↩↩↩↩↩↩↩↩↩↩↩↩
-
Aster and Blackstone-backed Quality Care merge to establish one of top 3 hospital chains in India — Aster DM Healthcare ↩↩↩↩↩↩↩↩↩↩↩
-
Aster DM to pay up to Rs 120 a share dividend after Gulf business sale — Business Standard, 2024-01 ↩↩↩↩↩
-
Aster DM Healthcare declares Rs 118 special dividend — Onmanorama, 2024-04-15 ↩↩↩↩
-
Aster DM Healthcare's merger with Quality Care India gets NCLT approval — Whalesbook ↩↩
-
Aster DM Quality Care Q1 FY27 slides: merger drives 30% EBITDA growth — Investing.com, 2026-08 ↩↩↩↩↩↩↩↩↩↩↩↩↩
-
Aster DM company update — HDFC Securities, 2025-09-08 ↩↩↩↩↩↩↩↩↩↩↩↩↩↩↩↩↩↩↩↩
-
Aster DM Quality Care reports strong Q1 FY27, revenue up 20% to Rs 2,597 cr — ANI, 2026-08-06 ↩↩↩
-
ICRA rating rationale, Aster DM Healthcare Limited — ICRA ↩↩↩
-
ASTERDM commences operations on completion of merger with Quality Care India — Business Standard, 2026-07-02 ↩
-
Aster DM and Quality Care India complete merger, begin operations — BW Healthcareworld ↩
-
Aster DM Quality Care announces ₹1,315 crore investment to expand Karnataka healthcare network — Elets eHealth, 2026-07 ↩
 LinkedIn
 WhatsApp
 Reddit
 Hacker News
 Email
Email Kindle
 RSS Feed
 Spotify
 Apple Podcasts
 Amazon Music
 Audible
 YouTube