iShares MSCI World ex-USA UCITS ETF USD (Acc): The Bet on Everything but America
I. The World Fund That Leaves Out the World’s Biggest Market
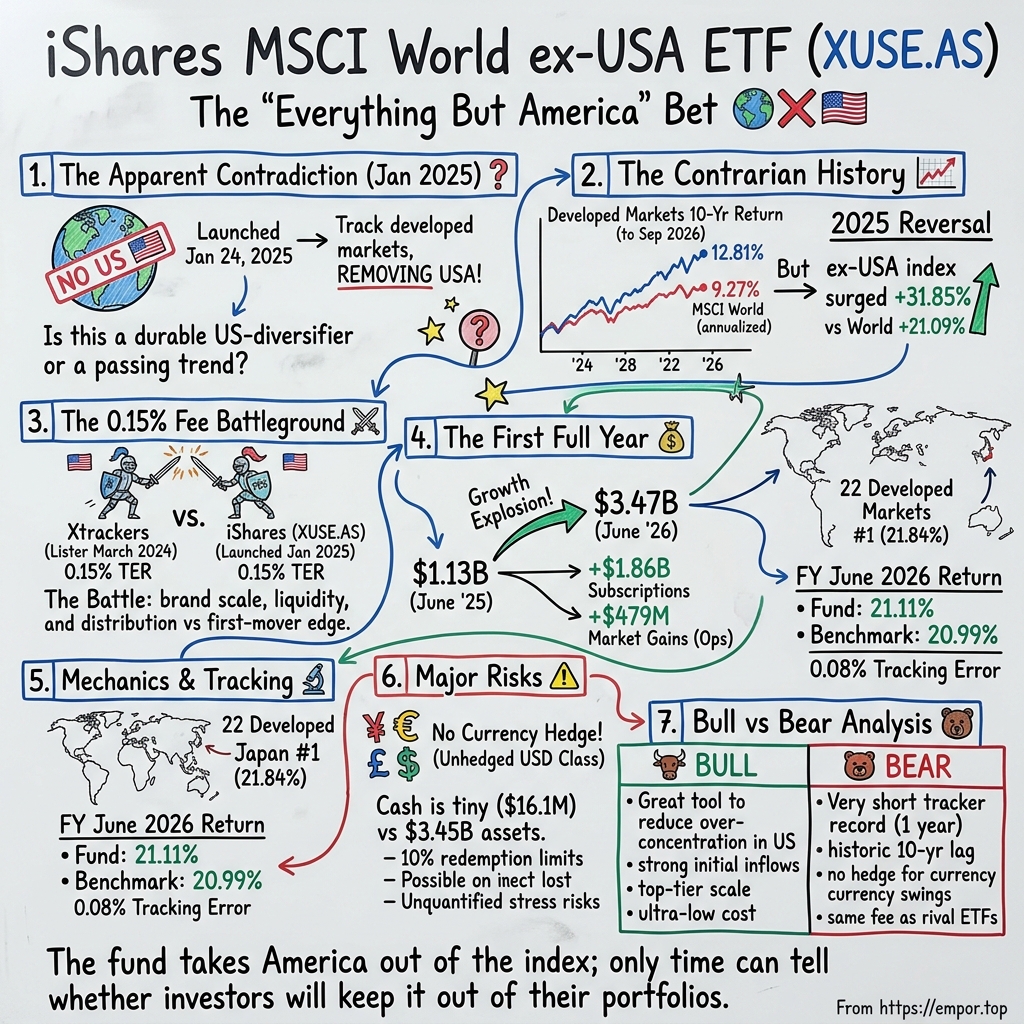
On 24 January 2025, a new fund opened inside iShares III plc, an Irish umbrella company. It had a long, careful name: iShares MSCI World ex-USA UCITS ETF.1 Six days later, on 30 January, its US-dollar accumulating shares began trading on Euronext Amsterdam under the ticker XUSE.12 Plenty of exchange-traded funds launch every month in Europe, and most of them disappear into the long tail of products nobody remembers. This one had a premise that was almost a provocation. It promised investors the developed world, and then it took out the United States.
That is a strange thing to sell. For most of the previous decade, owning "the world" in a global equity portfolio had largely meant owning America. Investors who bought a broad developed-markets index fund ended up with Apple, Microsoft, Nvidia, Amazon and the rest of the American technology complex sitting at the top of their holdings, because a market-capitalisation index gives the biggest companies the biggest weights, and the biggest companies were American. A "world" fund that removes the U.S. is therefore not a smaller version of the same thing. It is a different portfolio, with a different country mix, different sectors and different currencies.
Then the market made the provocation look prescient. In calendar 2025, the MSCI World ex USA Index returned 31.85% in US-dollar terms, after reinvested dividends net of withholding tax, while the full MSCI World Index returned 21.09%.3 For the first time in years, investors who had owned Tokyo, London, Paris, Zurich, Toronto and Sydney rather than New York were the ones with the better story to tell at dinner. Money followed. By 30 June 2026, the fund held net assets of USD 3.474 billion, about 17 months after it opened.4
That is a fast start by almost any standard for a new European ETF. It is also exactly the kind of start that should make a long-term investor slow down. A fund that launches into a rally and grows quickly has demonstrated two things: that a lot of people wanted the exposure at that moment, and that the market went up. It has not yet demonstrated whether those people will still want it when the trade stops working.
So this story turns on three questions. The first is whether investors are making a lasting allocation change, deliberately reducing their dependence on one country's stock market, or whether they are chasing a year of outperformance. The second is whether XUSE can keep its assets when U.S. stocks lead again, as they did for most of the decade before its launch. The third is narrower and more practical: when the same index is available from other providers, does iShares' scale make this particular vehicle meaningfully better than its substitutes?
Before going further, it helps to be precise about what XUSE is, because the label invites a category error. This is not BlackRock, Inc., the world's largest asset manager, and it does not share in BlackRock's revenue, headcount or profits. XUSE is a share class of an Irish sub-fund, an open-ended pool of equities governed by European UCITS rules and offered through a prospectus rather than through anything resembling a corporate IPO.5 The fund owns shares in hundreds of companies outside the United States. BlackRock entities manage it, State Street entities administer it and keep custody of its assets, and investors own redeemable shares in the pool.4
That boundary shapes everything that follows. A fund like this has no factory to build, no sales force of its own, no product roadmap. Its "business" consists of three promises: deliver the index, charge a low and visible fee for doing so, and let investors in and out cleanly. The interesting story is about the exposure itself, how faithfully the fund implements it, and who keeps buying it.
The fund's sudden success also arrived with an irony worth holding onto. A product built to diversify away from America became popular precisely because a single year made non-U.S. stocks look like the momentum trade. Diversification, by definition, is supposed to be the thing investors hold through periods when it looks wrong. If XUSE's investors behave like momentum traders, the fund's assets will rise and fall with relative performance. If they behave like allocators, the assets will be stickier than the returns.
To judge which kind of investor the fund is attracting, the right place to begin is not 2025 at all. It is the long, humbling decade that came before it.
 Subscribe on LinkedIn
II. The Decade That Made “Ex-USA” a Contrarian Call
Picture two charts laid side by side. The first shows the MSCI World Index, the benchmark most institutions use to describe developed-market equities. The second shows the MSCI World ex USA Index, which is the same universe of large and mid-sized companies in the same developed countries, except that every American company has been removed.3 Each line starts at the same point. Then, for most of a decade, the first line pulls steadily away from the second.
The numbers behind that picture are stark. Over the ten years to the end of October 2026, MSCI World ex USA returned 9.46% a year in US dollars, with dividends reinvested net of withholding tax. Over the same span, MSCI World returned 12.95% a year.3 A gap of three and a half percentage points sounds modest on a single line. Compounded for a decade, it is not. Using those annual rates, USD 100 invested in the ex-USA index would have grown to roughly USD 247, while the same USD 100 in the full world index would have reached roughly USD 338. The investor who removed America ended the decade with about a quarter less money than the investor who kept it.
That arithmetic is the backdrop against which XUSE launched. For a decade, recommending an ex-USA allocation was not an obvious idea. It was a contrarian call that had cost its believers money, and every year it lagged, the case for simply owning the global index grew stronger in the minds of investors who looked at trailing returns.
Then came 2025. The ex-USA index's 31.85% against the full index's 21.09% was a gap of more than ten percentage points in a single year, roughly three years' worth of the decade's average annual shortfall closed in twelve months.3 It is the kind of reversal that changes conversations among financial advisers, model-portfolio committees and private-bank investment teams. Suddenly, the question was not whether ex-USA would ever outperform. It was whether the world had entered a new regime.
It is worth being careful about what the comparison does and does not show. Both indices measure developed markets. Neither includes emerging markets, so the ex-USA index is not "the rest of the world"; China, India, Taiwan, Brazil and the other emerging economies sit in a separate MSCI family entirely.36 The ex-USA index is a carve-out of the developed world, a portfolio dominated by Japan, the United Kingdom, Canada, France, Switzerland, Germany and Australia. At the end of October 2026 it covered 734 companies across 22 of the 23 developed-market countries MSCI recognises, from Australia and Austria through Israel, Hong Kong and Singapore to Switzerland and the UK.3 Japan alone accounted for about 21% of it, followed by the United Kingdom and Canada at roughly 13% each, then Switzerland and France at a little over 8% apiece.3
That composition explains why the ex-USA portfolio behaves differently. Take the U.S. out of a developed-markets index and the heaviest concentration in American technology megacaps goes with it. What remains is, first and foremost, a portfolio of banks and insurers: financials made up about 27% of the index in October 2026, industrials another 17%, and information technology only about 10%.3 The single largest holding was ASML, the Dutch maker of chipmaking machines, at roughly 2.5% of the index, followed by Roche, Shell, Novartis and HSBC; all ten of the largest names together came to about 13%.3 In a U.S.-heavy global index, a handful of American technology giants can carry the whole result. Here, no company is large enough to do that, which is the concentration argument for the fund in a single statistic. It also brings a basket of currencies, the yen, the euro, sterling, the Swiss franc, the Canadian and Australian dollars, whose movements against the US dollar flow directly into the returns a dollar-based investor sees. The 2025 reversal was a mix of those forces, and nothing in the index data alone separates how much came from local share prices and how much came from currencies.
The index also has a long life that the ETF does not. MSCI launched the World ex USA Index on 31 March 1986, and figures before that date are back-tested rather than live.36 Since launch, the historical test of the strategy can draw on four decades of real data, through the Japanese bubble and bust, the dot-com crash, the 2008 crisis and the long American bull market that followed. That record contains the index's worst peak-to-trough fall, a 60.37% decline between October 2007 and March 2009, slightly deeper than the 57.82% suffered by MSCI World over the same months.3 Whatever else ex-USA developed equities are, they are not a defensive asset.
The ETF, by contrast, has one full audited financial year to its name, the year to 30 June 2026, plus a launch period of a little over five months before it.4 Any claim about how this fund behaves through a full cycle is, for now, a claim about the index. The two should not be confused. The index's live record tells investors what the exposure has done; the fund's short record tells them only how faithfully one implementation has delivered it so far.
So what does the long record actually support? It does not support the idea that ex-USA developed equities reliably beat the full world index. Over the most recent decade, they clearly did not. Nor does it support the idea that a strong 2025 has reset the game. One year of outperformance is not evidence of persistence, and leadership among countries has historically rotated in ways that looked obvious only in hindsight.
What the record does support is narrower and arguably more useful. An investor who believes that a market-cap-weighted global portfolio has become dependent on one country, one currency and one cluster of mega-cap technology companies now has a cheap, transparent way to own the rest of the developed world separately. That is an allocation choice, not a forecast. Investors who make it accept a portfolio with a different sector tilt, a different currency profile and a different pattern of returns, and they accept that the choice could lag for long stretches.
That leaves the investor with an unresolved tension. Diversifying away from the U.S. is reasonable precisely because no one knows which region will lead next. But the moment that made the idea fashionable was a single year in which the diversifier happened to win. The fund's investors will reveal which motive dominates only when the leadership turns again. Before getting to that test, there is a more immediate puzzle. By the time iShares launched XUSE, someone else had already got there first.
III. The Fund Arrives After the First Mover
In March 2024, DWS, the asset manager majority-owned by Deutsche Bank, listed an Xtrackers ETF tracking the MSCI World ex USA Index and described it as Europe's first ETF on that benchmark.[^7] Its 1C share class, the accumulating version, charges a total expense ratio of 0.15%.7 Amundi, Europe's largest asset manager, also added an MSCI World ex USA ETF to its range in 2024.89 By the time iShares opened its own fund in January 2025, the idea was not new in Europe. It was ten months old, and two competitors were already selling it.
So iShares arrived as a fast follower, not a pioneer. Its accumulating USD share class also charges 0.15% a year.14 On the two numbers that a casual investor compares first, the index and the fee, the iShares product and the Xtrackers product are the same.
That raises the question at the centre of this section. Why would an investor choose this fund when another ETF already tracks the same index at the same price?
Start with what investors use it for. The most common use of an ex-USA fund is as a building block. An investor who wants full control over country weights can pair a U.S. equity fund with an ex-USA fund and set the proportions directly, perhaps 50/50 or 60/40, rather than accepting whatever the market-cap weighting of a global index dictates. A second use is corrective. Many European investors already hold a global market-cap fund, which in the decade before XUSE's launch had become increasingly American. Adding an ex-USA sleeve lets them dilute that U.S. weight without selling the core holding, which may matter for tax or for simplicity.
Neither use is a newly invented investment strategy. Institutional investors have used ex-U.S. benchmarks for decades, and the MSCI index behind XUSE has a live history dating to 1986.6 What changed in 2024 and 2025 was the wrapper. A European investor who wanted this exposure in a low-cost, exchange-traded UCITS fund, rather than through U.S.-domiciled funds that carry tax and regulatory complications for European buyers, had few choices before DWS moved. Once DWS showed there was demand, the large providers followed.
Comparing the products properly requires more than reading the fee. The index has to match, and here it does: all three track MSCI World ex USA.179 Replication method matters too, because a physically replicating fund owns the actual shares, while a synthetic fund holds a basket and receives the index return through a swap with a bank. XUSE is physically replicating.1 Currency of the share class, whether income is paid out or reinvested, the countries where the fund is registered for sale and the exchanges where it trades all shape whether two products are truly interchangeable for a given investor. A Dutch retail investor buying on Euronext Amsterdam and a German platform investor buying through a savings plan may face very different practical choices even when the factsheets look identical.
What does iShares bring beyond the index? Three things, at least in principle. The first is a recognisable brand, which matters to advisers who must explain their choices to clients. The second is distribution: iShares funds sit on broker platforms, in model portfolios and on wealth-management buy lists across Europe, and a new iShares fund can plug into those channels faster than a smaller provider's product. The third is ETF infrastructure, the network of authorised participants and market makers that create and redeem shares and quote prices on exchange.
These are real advantages for BlackRock as a manager. Whether they translate into a better product for the person buying XUSE is a separate question, and it should be tested against things investors can observe: the fund's size, its trading spreads, how closely it tracks the index and whether it keeps attracting money. Brand is not a return stream, and distribution reach is not a guarantee of lower costs for any individual fund.
The early evidence on one of those tests is favourable. A fund that reached USD 3.474 billion of net assets by June 2026 had, by any reasonable measure, achieved scale quickly.4 Scale matters in ETFs because it tends to support tighter trading, deeper liquidity in the secondary market and lower risk that the provider closes the fund for lack of interest. On that dimension, iShares' late arrival did not prevent it from catching up.
Yet scale achieved during a rally is a different thing from scale earned through a product advantage. Because the fee is identical and the index is identical, what iShares is selling is not the exposure itself, which is available elsewhere, but the confidence that its version will be easy to buy, easy to trade and close to the benchmark. That is a perfectly legitimate thing to sell. It is also something competitors can try to match.
So here is the question to carry forward. If investors can buy the same index from several providers at the same headline price, what exactly is the product? The answer lies in what happens between the moment an investor clicks "buy" and the moment the fund's return shows up in their account. That journey is where the 0.15% fee either earns its keep or quietly leaks away.
IV. What the 0.15% Fee Buys
Follow a single creation order. A large bank or broker acting as an authorised participant decides that demand for XUSE on the exchange has pushed the ETF's price slightly above the value of the shares it holds. Rather than sell XUSE shares it does not have, the participant goes to the fund directly, in what the prospectus calls the primary market.5 It delivers either a basket of the underlying international shares or cash, and the fund issues new ETF shares in return. Those new shares then go out onto Euronext Amsterdam, where a Dutch saver, a German wealth manager or a pension adviser buys them through an ordinary brokerage account.25
That loop, repeated thousands of times, is the machinery behind every ETF. It keeps the exchange price close to the value of the underlying portfolio, because any persistent gap becomes an arbitrage opportunity for participants with the scale to create or redeem. It also explains how the fund grows: it does not sell anything in the conventional sense. It simply issues new shares when investors want more of the exposure and cancels them when investors want less.
At the other end of the chain sits the portfolio itself. At 30 June 2026, the fund held USD 3.453 billion of financial assets at fair value, almost all of it equities in developed-market companies outside the United States.4 The product page reported 732 holdings in November 2026, close to the 734 constituents of the index at the end of October.13 That near-match is what "physical replication" means in practice: rather than sampling a few hundred stocks or buying a swap, the fund tries to own essentially the whole index in its proper weights.1
Here it helps to understand the fund's economics without forcing them into the mould of an operating company. A company sells goods or services, pays costs and keeps a margin. XUSE does none of that. Its income comes from the dividends paid by the companies it owns and from the gains or losses on those holdings as share prices and exchange rates move. Its size changes for two reasons only: investors put money in or take it out, and the portfolio's value rises or falls. There is no "revenue growth" to forecast and no margin to expand.
What the fund does have is a cost. Its total expense ratio, the all-in annual fee charged to the share class, is 0.15%.14 In the year to 30 June 2026, that meant total operating expenses of USD 3.939 million.4 Divide that bill by the 0.15% rate and it implies average net assets of roughly USD 2.6 billion over the year, which fits a fund that started the year at about USD 1.1 billion and ended it near USD 3.5 billion. On a USD 10,000 holding, the fee amounts to USD 15 a year.
Put another way, the fund collected USD 81.152 million of operating income in the year, mostly dividends from its holdings, and the fee absorbed less than a twentieth of it.4 For an accumulating share class, the rest of that income is not paid out; it stays inside the fund and is reinvested, which is why XUSE carries the "Acc" suffix.110
The 0.15% TER, however, is only the cost investors can see on the factsheet. The realised experience of holding the fund also depends on costs that never appear in the expense ratio. When a Japanese or French company pays a dividend to an Irish fund, a portion is withheld as tax at the source, and how much depends on tax treaties and the fund's ability to reclaim. When the index changes, adding or removing stocks, the fund must trade and pays commissions, spreads and sometimes stamp duties. Cash that sits uninvested, even briefly, drags on returns in a rising market. And securities lending, in which the fund lends shares to borrowers for a fee, can add a modest amount of income back.54 All of these flow into the difference between the fund's return and the index's.
The investor buying on the exchange faces another layer: the bid-offer spread on XUSE itself and any broker commission. These are not fund costs at all, but they are real money, and they tend to be smaller for large, actively traded ETFs. That is one place where a manager's scale can show up in an investor's results, if it shows up at all.
It is tempting to assume that a fund managed by BlackRock automatically enjoys BlackRock's economies of scale. The annual report suggests caution. The fund pays for delegated management and administration. Its named service providers include BlackRock Asset Management Ireland Limited as manager, BlackRock Advisors (UK) Limited as investment manager and securities-lending agent, and State Street entities as administrator and depositary.4 The report identifies those BlackRock affiliates as related parties, but it does not itemise how much of the fund's USD 3.939 million of expenses went to each, nor how securities-lending revenue was split between the fund and the lending agent.4 Investors can see the total bill. They cannot see how it is divided within the BlackRock family.
That is not unusual for an umbrella ETF structure in which a single all-in fee covers most costs, and it does not by itself suggest anything improper. It does mean that the advantage of BlackRock's group scale, if there is one, must be inferred from outcomes, not from the fee schedule. The fee is the same as Xtrackers'. Any edge has to come from somewhere else.
This is the cleanest way to understand what the 0.15% buys. It buys a promise: physical ownership of a large- and mid-cap developed-market portfolio outside the U.S., delivered through a regulated UCITS wrapper, traded on exchange, maintained by a large operations team. Whether that promise is good value depends on the result, and the result is measured by how close the fund stays to its benchmark after every cost investors actually bear, not just the one printed on the factsheet. Before getting to that test, though, there is the matter of how the fund got so big so fast.
V. The First Full Year: Flows, Markets and a USD 3.5 Billion Fund
At 30 June 2026, iShares III plc closed its books for the financial year, and the annual report that followed included a statement that ordinary companies do not produce: the statement of changes in net assets attributable to redeemable shareholders.4 For this fund, it is the most revealing page in the document, because it separates the two forces that make an ETF bigger.
Read it in the order the money moved. The fund began the year with net assets of USD 1.133 billion.4 Over the following twelve months, investors and authorised participants caused it to issue USD 3.740 billion of new shares and redeem USD 1.879 billion, for net subscriptions of USD 1.861 billion.4 On top of that, the increase in net assets from operations, essentially the investment return after costs and tax, added USD 479.097 million.4 The year ended with USD 3.474 billion.4
That decomposition answers the first question about the fund's growth directly. Of the roughly USD 2.3 billion added during the year, about four-fifths came from net investor flows and about one-fifth came from the market. The fund did not simply ride a rally. People sent it money, a lot of it.
The redemption figure is worth pausing on, too. Nearly USD 1.9 billion left the fund during the year, about half the amount that came in. In an ETF, gross redemptions are partly an artefact of market-making, as authorised participants create and redeem shares to keep the exchange price aligned, so they cannot be read as investors abandoning the fund. But they show how much two-way traffic the fund handles. The asset base is not a static pool; it is a busy intersection.
Now look at the other engine. The fund's total investment income for the year was USD 490.968 million, of which USD 409.816 million were net gains on financial instruments and USD 81.152 million operating income, mostly dividends.4 Against that, it paid USD 3.939 million in operating expenses and USD 7.930 million in tax.4 What remained was the USD 479.097 million increase from operations, which the accounts present as profit after tax.4
It would be a mistake to treat that figure like a corporate profit. More than four-fifths of it consisted of gains on the portfolio, the rise in value of the shares the fund held, including the effect of currency movements. Those gains belong to the shareholders as the market delivered them, and they can reverse in the next year just as easily. There is no recurring operating margin here, no pricing power and no customer base generating predictable cash. The fund's "profit" is the index's return, minus costs, multiplied by the assets that happened to be invested at the time.
The launch period makes the point in miniature. From January to 30 June 2025, the fund recorded a profit after tax of USD 20.772 million and operating expenses of just USD 104,000.4 Neither number says much about the fund's quality. They say that the fund was small and new, and that markets moved modestly in its favour during those first five months.
A conventional analyst might next ask how much of the profit turned into cash. That test does not fit. The annual report does not include a cash-flow statement, because it takes the exemption available under Irish and UK accounting standards to qualifying open-ended investment funds.4 Even if it did, the result would be meaningless in the corporate sense, because cash moves in and out of the fund with subscriptions and redemptions, and the fund's purpose is to keep almost all of its assets invested rather than to accumulate cash. A rising net-asset figure is not cash generated by operations. It is investors' money plus the market's verdict on it.
The structure of the year also suggests something about the fund's investor base. In April 2026, the fund launched a distributing USD share class alongside XUSE, a class that pays out dividends rather than reinvesting them.4 Providers usually add share classes when they see demand from a different type of client, often income-seeking investors or those in jurisdictions where distributing funds are more tax-efficient. It is a sign that iShares was broadening the product's reach, not just waiting for the existing class to grow. It also means that future reports of the sub-fund's total size will include assets that do not sit in XUSE itself, so investors following this particular share class need to look at class-level data.
So what did the first full year prove? It proved that demand existed in size. A fund does not receive almost USD 1.9 billion of net subscriptions in a year by accident, and the speed with which iShares caught up with an earlier competitor suggests that distribution did real work. It also proved that the fund could absorb rapid growth without obvious operational stress, a point the next section tests directly.
It did not prove that the assets are sticky. Every dollar of those subscriptions arrived during a period when the ex-USA index was outperforming, a period in which investors could look at a trailing-return screen and see their decision confirmed. The test of durable demand is what happens when the screen turns against them: a year, or three, in which a broad U.S. index again leads by a wide margin. The fund has never lived through that. Nobody yet knows whether its shareholders are allocators who will rebalance into weakness or momentum buyers who will redeem.
That uncertainty points back to the one thing the fund can control. It cannot choose its investors' motives, and it cannot choose the relative performance of Japan versus America. It can choose how closely it delivers the index those investors bought, and on that question the first full year left a clean and, for a fund charging a fee, mildly surprising result.
VI. The Tracking Test Is Only One Year Old
Put two numbers side by side. In the twelve months to 30 June 2026, the fund returned 21.11%. Its benchmark, the MSCI World ex USA Index, returned 20.99%.4 The fund, which charges 0.15% a year, came out ahead of the index it is designed to copy by 0.12 percentage points. Its realised tracking error for the year was 0.08%.4
At first glance, that looks like a fund beating its own benchmark after fees, which ought to be impossible for a pure index tracker. It is not impossible, but explaining it requires two definitions that the ETF industry uses precisely and investors often blur.
Tracking difference is the gap between the fund's return and the index's return over a period. Here, it was a positive 0.12 points for the year. Tracking error is something else: it measures how much that gap wobbled over the period, the volatility of the daily or monthly differences. A fund can have a large tracking difference and tiny tracking error, if it lags the index by the same amount every day, or a small tracking difference and large tracking error, if it zigzags around the index and happens to end level. XUSE's 0.08% tracking error says the fund followed the index closely through the year, without large day-to-day deviations.4 Its positive tracking difference says the net result of all its frictions and offsets, including the fee, was slightly favourable.
Why might a fund that charges a fee beat its index? The usual explanations lie in the plumbing. The MSCI "net" index, which serves as the benchmark, assumes that dividends are reinvested after deducting withholding tax at rates MSCI applies to a standardised non-resident investor.3 An Irish fund that benefits from treaty rates more favourable than the index assumes, or that successfully reclaims some withheld tax, keeps more of each dividend than the index credits, and that difference shows up as outperformance. Securities-lending income, which the fund earns by lending shares to borrowers, is another potential offset.54 Small differences in the timing of trades around index changes, or the treatment of corporate actions, can push the result either way.
The fund's annual report does not decompose its tracking difference into those components for the year, so the precise contribution of each is not published. What can be said is that the fee was more than covered by these offsets in this particular year, and that the outcome is consistent with careful implementation of a large, liquid index.
It is also important to keep the result in proportion. A twelve-basis-point gain over one year is a single observation. Withholding-tax advantages vary with dividend seasons and with the country mix of the index. Securities-lending income fluctuates with demand to borrow particular shares, which can collapse in calm markets. And the year in question was a strong, broadly rising one for ex-USA equities, an environment in which cash drag hurts but most other implementation challenges are muted. A volatile year with heavy redemptions, sharp currency swings or large index rebalances would be a harder test.
Nor does one good year say anything about relative quality. The relevant comparison is not only the fund against its index but also the fund against Xtrackers' and Amundi's versions, measured over the same periods. Two funds with the same TER and the same benchmark can deliver persistently different net results because of differences in withholding-tax treatment, lending programmes and trading practices. If XUSE's annual tracking difference stays consistently better than its peers', that would be real evidence that iShares' operations add value. If it merely matches them, the product is a commodity, competently made.
That makes multi-year tracking difference, measured against both the benchmark and the closest peer funds, one of the central measures for anyone following this fund. The first-year result provides a clean baseline: close tracking, small positive difference, low tracking error. It does not provide proof of persistent skill, and the fund has not claimed otherwise in its published results.
There is a broader point here about what investors are buying when they buy an index fund. They are not paying for an opinion about which stocks to own; MSCI provides that, under licence, to anyone willing to pay for it. They are paying for the absence of surprises: a fund that delivers what the index delivers, every year, with as little leakage as possible. A fund that tracks well in benign conditions has passed the easy exam. The harder one comes when markets are rough and investors want out.
So the first full year delivered what the fund promised in conditions that were broadly friendly. The next question is what its structure must withstand when they are not, and two forces stand out: currencies that move against a dollar investor, and redemptions that arrive faster than the portfolio can comfortably sell.
VII. The Portfolio Has No Currency Hedge—and Investors Can Leave
Look at the fund's balance sheet at 30 June 2026 and one proportion jumps out. The fund held USD 14.098 million of cash and USD 2.061 million of cash equivalents. Against that sat USD 3.453 billion of investments at fair value.4 For every dollar of cash, there were more than two hundred dollars of shares in Japanese carmakers, British banks, Swiss drugmakers, Canadian railways and hundreds of other companies.
That is not a sign of weakness. It is the design. An index fund that sits on large cash balances fails at its main job, because cash does not track the index. The whole point is to be almost fully invested, all the time. But it does mean that the fund's ability to meet withdrawals depends almost entirely on its ability to sell shares, or to hand them over, rather than on a cash buffer. And it means the risks investors bear are overwhelmingly the risks of the portfolio itself.
Start with currency, because the fund's name invites confusion. XUSE is a US-dollar share class, and the fund's base currency is the dollar.14 That means its price is quoted in dollars and its accounts are kept in dollars. It does not mean investors are protected from currency movements. The fund owns companies whose shares trade in yen, sterling, euros, Swiss francs, Canadian and Australian dollars and other currencies, and the USD class is not currency-hedged.110 When the yen strengthens against the dollar, the dollar value of the fund's Japanese holdings rises even if their share prices in Tokyo do not move. When the yen weakens, the reverse happens.
An analogy helps. Imagine an American who owns a rental flat in Tokyo and records its value in dollars. The rent and the flat's price are set in yen. If the yen falls 10%, the flat is worth 10% less in dollars, even though nothing about the building has changed. XUSE is that flat, multiplied across 22 countries and hundreds of companies. A euro-based investor buying XUSE on Euronext Amsterdam faces the same thing from a different angle: the dollar price is a translation layer, and the underlying exposure remains to the basket of non-U.S. currencies.
The fund does not try to manage this. Its prospectus permits derivatives, but at 30 June 2026 its only derivative position was USD 42,000 of exchange-traded futures, typically used to keep small cash balances invested, and it held no foreign-exchange forwards.54 The annual report folds currency effects into its overall gains and losses on financial instruments rather than quantifying them separately for the year, so investors cannot read directly how much of the FY2026 return came from currency.4 For a fund whose largest country exposure is Japan, that is a material piece of the return story that the accounts leave aggregated.
For most investors, this is a feature rather than a flaw. Part of the reason to own non-U.S. equities is to diversify away from the dollar as well as from American companies. But it should be understood clearly: owning XUSE is a bet on foreign equities and foreign currencies together, and the two can amplify or offset each other in any given year. The underlying equity markets remain the main driver of the fund's value; currencies are the second engine, and they can run in either direction.
The balance sheet offers a smaller puzzle that is worth solving rather than leaving open. At 30 June 2025, the fund reported receivables of USD 503.175 million and payables of USD 503.186 million. A year later, those had fallen to USD 18.883 million and USD 14.845 million.4 Large, almost perfectly matched balances like those at the first year-end are the signature of unsettled trades: the fund had bought or sold shares, or issued and redeemed its own, and the cash had not yet changed hands on the reporting date. They shrank as the fund's activity at year-end normalised. The report gives no ageing schedule for these balances, but nothing in them suggests anyone owed the fund money they were failing to pay. These are the routine settlement flows of a busy fund, not credit exposures.4
The more serious question is what happens if investors want out in large numbers. Most investors never redeem with the fund at all; they sell XUSE shares on the exchange to another buyer. Only authorised participants deal with the fund directly, and when they redeem, they typically receive either cash or a basket of the underlying shares.5 In normal conditions, that system works smoothly. In stressed conditions, if many sellers arrive at once, market makers must either absorb the shares or redeem them, and the fund must then sell its holdings or hand them over, potentially in markets that are themselves under pressure.
The prospectus provides a safety valve. If redemption requests on any dealing day exceed 10% of the fund's net asset value, the board may defer the excess to subsequent dealing days.5 This is a standard tool in UCITS funds, designed to protect remaining investors from bearing the cost of a fire sale. It is also a reminder that the promise of daily liquidity has limits written into the documents.
The fund's other operational safeguards are worth acknowledging, without mistaking them for something they are not. Its counterparties, the report says, are regulated entities or carry high international ratings, and State Street Corporation, the parent of its depositary, held an S&P long-term rating of A at 30 June 2026.4 The fund had no bank overdraft and no borrowing.4 Securities lending, which puts the fund's shares in the hands of borrowers, is collateralised and overseen by the lending agent.54 None of this constitutes a credit rating for the fund. It describes the plumbing that makes ownership of the underlying shares secure.
What the published data do not show is how concentrated the fund's investor base is or what a very large redemption would cost. The annual report does not name the fund's largest shareholders or describe how much of the share class is held by a handful of platforms, model portfolios or institutions.4 Nor does it publish a stress scenario estimating the market impact of, say, a quarter of the fund's assets being redeemed during a volatile week. Given that the underlying holdings are large- and mid-cap companies in developed markets, generally among the most liquid shares in the world, the risk is probably manageable. But "probably" is the right word, because the evidence that would turn it into "certainly" is not public.
So the fund's core risks are the ones it was built to carry: equity markets and currencies outside the U.S. Its operational safeguards appear sound, and its balance sheet is uncomplicated. The open question, how it would behave under a large and sudden exodus, is left unanswered by the company's disclosures. That matters more if the fund's investors turn out to be the momentum-driven kind. And whether they stay or leave depends heavily on whether they believe XUSE offers anything they cannot get elsewhere.
VIII. The Product’s Moat Is Distribution, Not the Index
Put two funds side by side on an investor's screen. Both track the MSCI World ex USA Index. Both are physically replicating UCITS ETFs domiciled in Ireland. Both accumulate dividends. Both charge 0.15% a year.17 One says iShares; the other says Xtrackers. What would the investor give up by switching from one to the other?
For a new buyer, almost nothing. That is the central fact of competition in index ETFs, and it frames any discussion of whether XUSE has a moat. The product is defined by its index, and the index is not exclusive. MSCI licenses it to whoever is willing to pay, and in this case DWS and Amundi took licences before or alongside BlackRock.[^7]89
Michael Porter's five forces help clarify what kind of market this is. Buyer power is high, because investors can compare products instantly on fee, size and tracking, and a buyer who has not yet invested faces no switching cost at all. Existing holders face a modest switching cost: selling XUSE and buying a competitor means paying spreads and, in many jurisdictions, realising capital gains for tax purposes. That friction gives incumbents some protection from defection once assets are in, but it does little to win new money. Rivalry among existing competitors is intense and centres on fees, spreads, tracking and distribution. The threat of new entrants is moderate: any large European ETF provider with an MSCI licence and an Irish fund platform could launch a competing product, though building scale from zero is hard. Substitutes are abundant: an investor can approximate ex-USA exposure through regional funds for Europe, Japan and the Pacific, or simply hold a global fund and accept the U.S. weight. And supplier power sits largely with MSCI, which owns the benchmark that defines the product and sets its licence fees.
Seen through that lens, XUSE competes in a market where the product is close to a commodity. The question is whether iShares has any of the durable advantages that Hamilton Helmer's seven powers framework describes: scale economies, network economies, counter-positioning, switching costs, branding, cornered resources or process power.
Scale economies are the most plausible candidate. Larger ETFs tend to have tighter spreads, more active market makers and lower per-dollar operational costs. XUSE's USD 3.474 billion of net assets by June 2026 gave it real scale.4 But scale in ETFs is an outcome of flows, and flows can reverse. More importantly, the fee is the same as a smaller competitor's, so any scale economies are not being passed on as a lower price. If they exist, they would show up in tighter trading or better tracking, which brings the argument back to measurable outcomes.
Branding is the second candidate. iShares is the most recognisable ETF brand in Europe, and advisers who must justify product choices to clients may prefer it. But branding in index funds is a weaker power than in consumer goods, because the product's quality is fully measurable. A brand that delivers worse tracking than a cheaper rival will not keep assets forever.
Network economies, cornered resources and counter-positioning do not apply in any meaningful sense. The index is not cornered; it is licensed to three providers. No network effect makes the fund more valuable as more investors join, beyond the liquidity benefits already counted under scale. And BlackRock is not counter-positioning against incumbents; it is the incumbent, arriving late.
Process power is possible but unproven. If iShares' operations systematically deliver better withholding-tax recovery, better securities-lending income or tighter trading around index changes, that would be process power. The first-year tracking result is consistent with good process. One year is not enough to prove it is superior to peers.
What about the fund's customer base? Because the annual report does not name its top investors, it is impossible to say whether the fund depends heavily on a few large holders, such as a model portfolio or a platform's default allocation.4 The absence of that disclosure should not be read as evidence of diversification. It is simply an unknown. If a large share of assets came through a small number of distribution partners, the fund's moat would be those relationships, and their loss would be its biggest risk.
The more honest conclusion is that XUSE's advantage, to the extent it has one, sits with BlackRock as a manager rather than with this fund as a product. iShares' brand, distribution and ETF infrastructure helped a late entrant catch up quickly, and that matters. But these are manager-level assets whose benefit to this specific fund must show up in measurable results: continued asset growth, tight trading spreads and accurate tracking. A competitor that matches all three at the same fee has, for practical purposes, an identical product.
That gives a practical moat test. Does the fund keep attracting assets and trading efficiently, while maintaining close tracking, at a fee that peers can match at will? If yes, iShares' distribution is doing real work. If not, the fund is a commodity with a famous label. The first year passed the test in good conditions. The harder evidence will come from years in which the underlying exposure is out of favour, and that is where the bull and bear cases for the fund truly diverge.
IX. Analysis & Bear vs. Bull Case
Return to those two charts: MSCI World and MSCI World ex USA, side by side. Across the ten years to October 2026, the ex-USA line trailed badly, 9.46% a year against 12.95%.3 At the very end, the line jumped, with 2025's outperformance appearing as a sharp kink. Every investment case for XUSE is ultimately an interpretation of that kink.
Begin with the bull case, stated as strongly as the evidence allows.
The fund is a precise tool for a specific job. Investors who want to reduce their dependence on one country's market, one currency and one sector cluster can use XUSE to do it cheaply and transparently. A global market-cap portfolio had, over the previous decade, become increasingly a bet on American technology companies. For investors who think that concentration is a risk, rather than a feature, an ex-USA sleeve is a clean way to rebalance.
The fund has shown real early demand. Net subscriptions of USD 1.861 billion in its first full year, out of a total increase in net assets of more than USD 2.3 billion, show that investors were not merely watching the fund rise with markets; they were actively buying it.4 That demand arrived through iShares' distribution even though a competitor had been on the market for ten months, which suggests the brand and platform reach are worth something.
The fund delivers a broad, diversified basket. Its holdings span 22 developed countries and more than 700 companies, with no single country dominant in the way the U.S. dominates the full world index; Japan, the largest, was about a fifth of the index at the end of October 2026.3 That breadth makes it a reasonable core holding for an investor's non-U.S. developed-market exposure.
And the first full year of implementation was clean. The fund tracked its benchmark closely, with tracking error of 0.08% and a small positive tracking difference after its 0.15% fee.4 For an investor, that is the only thing an index fund can promise, and it delivered.
If non-U.S. leadership continues, whether because of valuation gaps, currency movements, changes in global capital flows or the fading of American technology dominance, the fund is positioned to capture it at low cost. That is the bull case: diversification, the possibility of continued non-U.S. leadership and a low-cost, closely tracking fund to deliver both.
Now the bear case, also stated as strongly as the evidence allows.
The fund has a short record. One full audited year, plus a launch period, is not enough to establish how it behaves through a market cycle, how its investors respond to underperformance or whether its tracking stays tight in stressed markets.4 Everything investors know about the fund's behaviour was learned in a single, favourable environment.
The index's long-term record is not encouraging. Over the decade to October 2026, it trailed MSCI World by about three and a half percentage points a year.3 One strong year does not reverse that pattern. The calendar-year record shows how lopsided the stretch before XUSE's launch was: in 2024, the year before the fund opened, ex-USA returned 4.70% while MSCI World returned 18.67%, and in 2021 the figures were about 13% against 22%.3 If the forces behind those years return, the ex-USA index could lag again for years. There is already a hint of it. By the end of October 2026, MSCI World ex USA was up 9.96% for the year, slightly behind MSCI World's 10.89%.3 The 2025 lead has not, so far, repeated.
Diversification does not mean safety. Excluding the U.S. changes the exposure but does not reduce equity risk in any simple way, and the index's own history proves the point in both directions. In 2022, when rising interest rates hammered expensive technology shares, ex-USA fell 14.29% against an 18.14% fall for MSCI World, a real cushion.3 In 2018, it was the other way round: ex-USA fell 14.09% while MSCI World fell only 8.71%.3 Its volatility over ten years, about 15% a year, was essentially the same as the full world index's.3 An investor adding XUSE to reduce risk may find that they have exchanged one set of risks for another, with currency swings added on top. The diversification claim survives, but in a narrower form: the fund changes which risks an investor carries, not how much risk they carry.
The fund is also not "the rest of the world." It excludes emerging markets entirely. An investor who buys XUSE thinking they have diversified away from the U.S. has diversified into other rich-country markets, not into the faster-growing economies of Asia, Latin America and elsewhere.3 A complete non-U.S. allocation requires a second fund.
The product is replicable. The same exposure is available from Xtrackers at the same TER, and from Amundi.79 If a competitor decides to cut its fee to win market share, iShares must follow or accept outflows. Price competition in European ETFs has historically tended to push fees down over time; there is nothing about this product that insulates it from that pressure.
And the stress risks are undisclosed. The annual report does not reveal investor concentration or quantify the market impact of a large redemption.4 If a significant share of the fund's assets came through a few model portfolios or platforms that could switch providers or reduce ex-USA allocations together, the fund could face sudden outflows that its published data give no way to anticipate.
So how should these cases be weighed? The bull case is mostly about the exposure, and the exposure is a reasonable allocation choice for an investor who believes in diversification. The bear case is partly about the exposure, its long-term record and its risks, and partly about the product, its short history, its lack of exclusivity and its undisclosed concentrations. The fund cannot control the first. It can only control the second, and on that front it has done what it promised so far.
Valuation is where the bull case finds its firmest footing, and where it needs the most care. At the end of October 2026, MSCI World ex USA traded at about 17.6 times trailing earnings and 14.6 times forward earnings, against roughly 22.3 and 17.4 times for MSCI World.3 Its price-to-book ratio was about 2.4 against 4.1, and its dividend yield about 2.6% against 1.5%.3 Put plainly, an investor in the ex-USA index pays roughly a fifth less for each dollar of current earnings and collects almost twice the dividend income. That gap is what makes the allocation tempting. It is also not new. Cheaper non-U.S. valuations persisted through most of the decade in which the ex-USA index lagged, because the market was paying up for faster-growing American earnings, and a discount that does not close is a value trap by another name. The valuation data narrow the bull case rather than confirm it: the ex-USA basket starts from a lower price, which improves the odds over long periods, but it offers no timetable for when, or whether, that discount narrows.
Three measures will tell investors most about how the story develops. The first is net subscriptions separated from market returns, the most direct evidence of whether investors are allocating or chasing. In FY2026, the latest reading, net subscriptions were USD 1.861 billion, about four times the gain from operations.4 The second is multi-year tracking difference and tracking error, measured against both the benchmark and the closest competitor funds. In the latest year, tracking difference was a positive 0.12 points and tracking error 0.08%.4 The third is the fund's assets and trading liquidity through a sustained period of relative underperformance, a test it has not yet faced.
The investor case can be stated neutrally and simply. XUSE can implement an allocation decision. It cannot make that allocation decision right.
X. Playbook: Business & Investing Lessons
Go back to the first full year's accounts. Two numbers sit next to each other on the statement of changes in net assets: USD 1.861 billion of net subscriptions and USD 479.097 million from operations.4 One measures what investors did; the other measures what the market did. Both made the fund larger. They are not the same kind of evidence, and the lessons from XUSE come from keeping them apart.
The first lesson is that a good first year can validate execution without validating the allocation. XUSE's launch was, operationally, a success. A late entrant caught up with a first mover, absorbed rapid inflows, tracked its benchmark closely and avoided any visible stumble. All of that is evidence that iShares knows how to build and run an ETF. None of it is evidence that owning the developed world without America is a better idea than owning it with America. The market gave a strong verdict on that question in 2025, and a strong opposite verdict over the decade before. Founders and product managers launching into a favourable moment should remember that their early success is partly borrowed from the moment. Investors should remember that a well-run product can still be a vehicle for a poorly timed decision.
The second lesson is that when the index is the product, tracking is the product proof. XUSE does not own its index; MSCI does, and it licenses the same benchmark to competitors. The fee is identical to its closest rival's. In that world, the only thing that distinguishes one implementation from another is how faithfully it converts the index into investor returns, after the fee, the taxes, the trading and the lending. XUSE's first-year result, a hair ahead of its benchmark with very low tracking error, is exactly the kind of proof that matters. It is also proof that must be re-earned every year, against competitors doing the same work. In commodity products, excellence is not a moat; it is the price of admission.
The third lesson is that a fee you can compare is a promise; flows through a bad stretch are the test. The 0.15% TER is printed on every factsheet, easy to verify and easy to match. That transparency is good for investors and hard on providers, because it gives them no place to hide. What cannot be matched by a press release is investor loyalty, the willingness of shareholders to stay when the exposure is out of favour. That loyalty will be tested when U.S. stocks next lead for an extended period, as they did for most of the decade before XUSE existed. A fund whose assets survive that stretch has proved something about its distribution, its investors and its role in their portfolios. A fund whose assets drain away has proved that it was a momentum product wearing a diversifier's clothing.
There is a wider lesson here for anyone who turns a market thesis into a financial product. The thesis behind XUSE, that investors should not let one country define their global portfolio, is old and defensible. The product is new and well made. But the reason the product grew so quickly was not the thesis; it was the year. Building something durable means designing for the investor who will still hold it when the year turns, not the one who bought it because the year was good.
XI. Epilogue
Tonight, XUSE is a USD 3.5 billion fund with one full year of audited history, a clean tracking record and a set of investors whose loyalty has not yet been tested.4 Its annual report for the year to June 2026 was released to the market at the end of October 2026.11 The next interim report, covering the half-year to 31 December 2026, will follow the one iShares III plc published for the same half of 2025, and the annual report for the year to June 2027 will come after that.12
The market has already written the first lines of the next chapter. Over the twelve months to the end of October 2026, the ex-USA index still beat MSCI World, 14.44% to 12.11%, because the tail of the 2025 surge sits inside that window.3 But for calendar 2026 so far, the order has flipped back, narrowly: ex-USA was up 9.96% against 10.89% for the full world index.3 It is a small gap, nowhere near the kind of multi-year drought that tests loyalty. It is, however, the first time since XUSE launched that its investors have watched the trade they bought trail the alternative they left.
Those documents will start to answer the questions this story has left open. The most important is whether net subscriptions continue, and whether they continue in a period when ex-USA stocks underperform. If ex-USA leads again and money flows in, the fund will be confirmed as a popular product but not as a durable allocation. If ex-USA lags and money still flows in, or at least stays, that would be the strongest evidence yet that investors are using XUSE as a deliberate diversifier rather than a trade. If ex-USA lags and money flows out, the fund's growth will have been a story of a single year.
The second question is tracking. Each new annual report will add another observation of the fund's return against its benchmark. Investors should watch not only whether XUSE stays close, but whether it stays closer than Xtrackers' and Amundi's versions over the same periods.79 If iShares' operations are systematically better, the gap will show up over several years. If it does not, the product is a well-made commodity, and the choice among competitors comes down to trading costs and convenience.
The third question is disclosure. Will future reports say more about how the fund's fee is divided among BlackRock affiliates, how concentrated its investor base is and how it would handle a large redemption under stress? Or will those gaps remain? The answers will not change the fund's index, but they will change how confidently investors can judge its resilience.
The index itself will keep producing evidence every month, as MSCI updates its factsheets.3 The fund's investors will produce evidence more slowly, through their decisions to stay or leave.
The next decisive moment for XUSE will not be a launch, a fee change or a new share class. It will be a full market cycle, with all its reversals, and the fund has not yet lived through one.
XII. Outro
Return to the opening image: a fund that offers the world and then takes out America. On the day it launched, that looked like a contrarian idea with a decade of disappointment behind it. MSCI World ex USA had returned 9.46% a year to MSCI World's 12.95% over the ten years that ended in October 2026, a gap that left the ex-USA investor with about a quarter less wealth.3 Then 2025 arrived, and the ex-USA index returned 31.85% against 21.09%.3 A decade of humility, followed by one year of vindication.
XUSE is a clean instrument for a contested view of the world market. It does exactly what it says, at a fee anyone can read and a tracking record anyone can check. What it cannot do is settle the argument it was built to express. That argument will be decided by the gap between the view investors hold and the returns they actually receive, year after year, through the next turn in leadership.
The fund can take America out of the index; only time can tell whether investors will keep it out of their portfolios.
References
-
iShares MSCI World ex-USA UCITS ETF — iShares product page, BlackRock ↩↩↩↩↩↩↩↩↩↩↩↩
-
MSCI World ex USA Index (USD) factsheet, October 2026 — MSCI ↩↩↩↩↩↩↩↩↩↩↩↩↩↩↩↩↩↩↩↩↩↩↩↩↩↩↩↩↩
-
iShares III plc Annual Report and Audited Financial Statements, year ended 30 June 2026 — BlackRock, 2026-09-29 ↩↩↩↩↩↩↩↩↩↩↩↩↩↩↩↩↩↩↩↩↩↩↩↩↩↩↩↩↩↩↩↩↩↩↩↩↩↩↩↩↩↩↩↩↩↩↩
-
iShares III plc Prospectus — BlackRock, 2026-11-05 ↩↩↩↩↩↩↩↩↩
-
Amundi completes its equity ETF range with 2 new exposures — Amundi ETF, 2024 ↩↩
-
Key Information Document: iShares MSCI World ex-USA UCITS ETF USD (Acc) — BlackRock, 2026-04-09 ↩↩
-
iShares III plc — Annual Financial Report, year ended 30 June 2026 — London Stock Exchange, 2026-10-30 ↩
-
iShares III plc Interim Report, period ended 31 December 2025 — BlackRock ↩
 LinkedIn
 WhatsApp
 Reddit
 Hacker News
 Email
 Kindle
 RSS Feed
 Spotify
 Apple Podcasts
 Amazon Music
 Audible
 YouTube