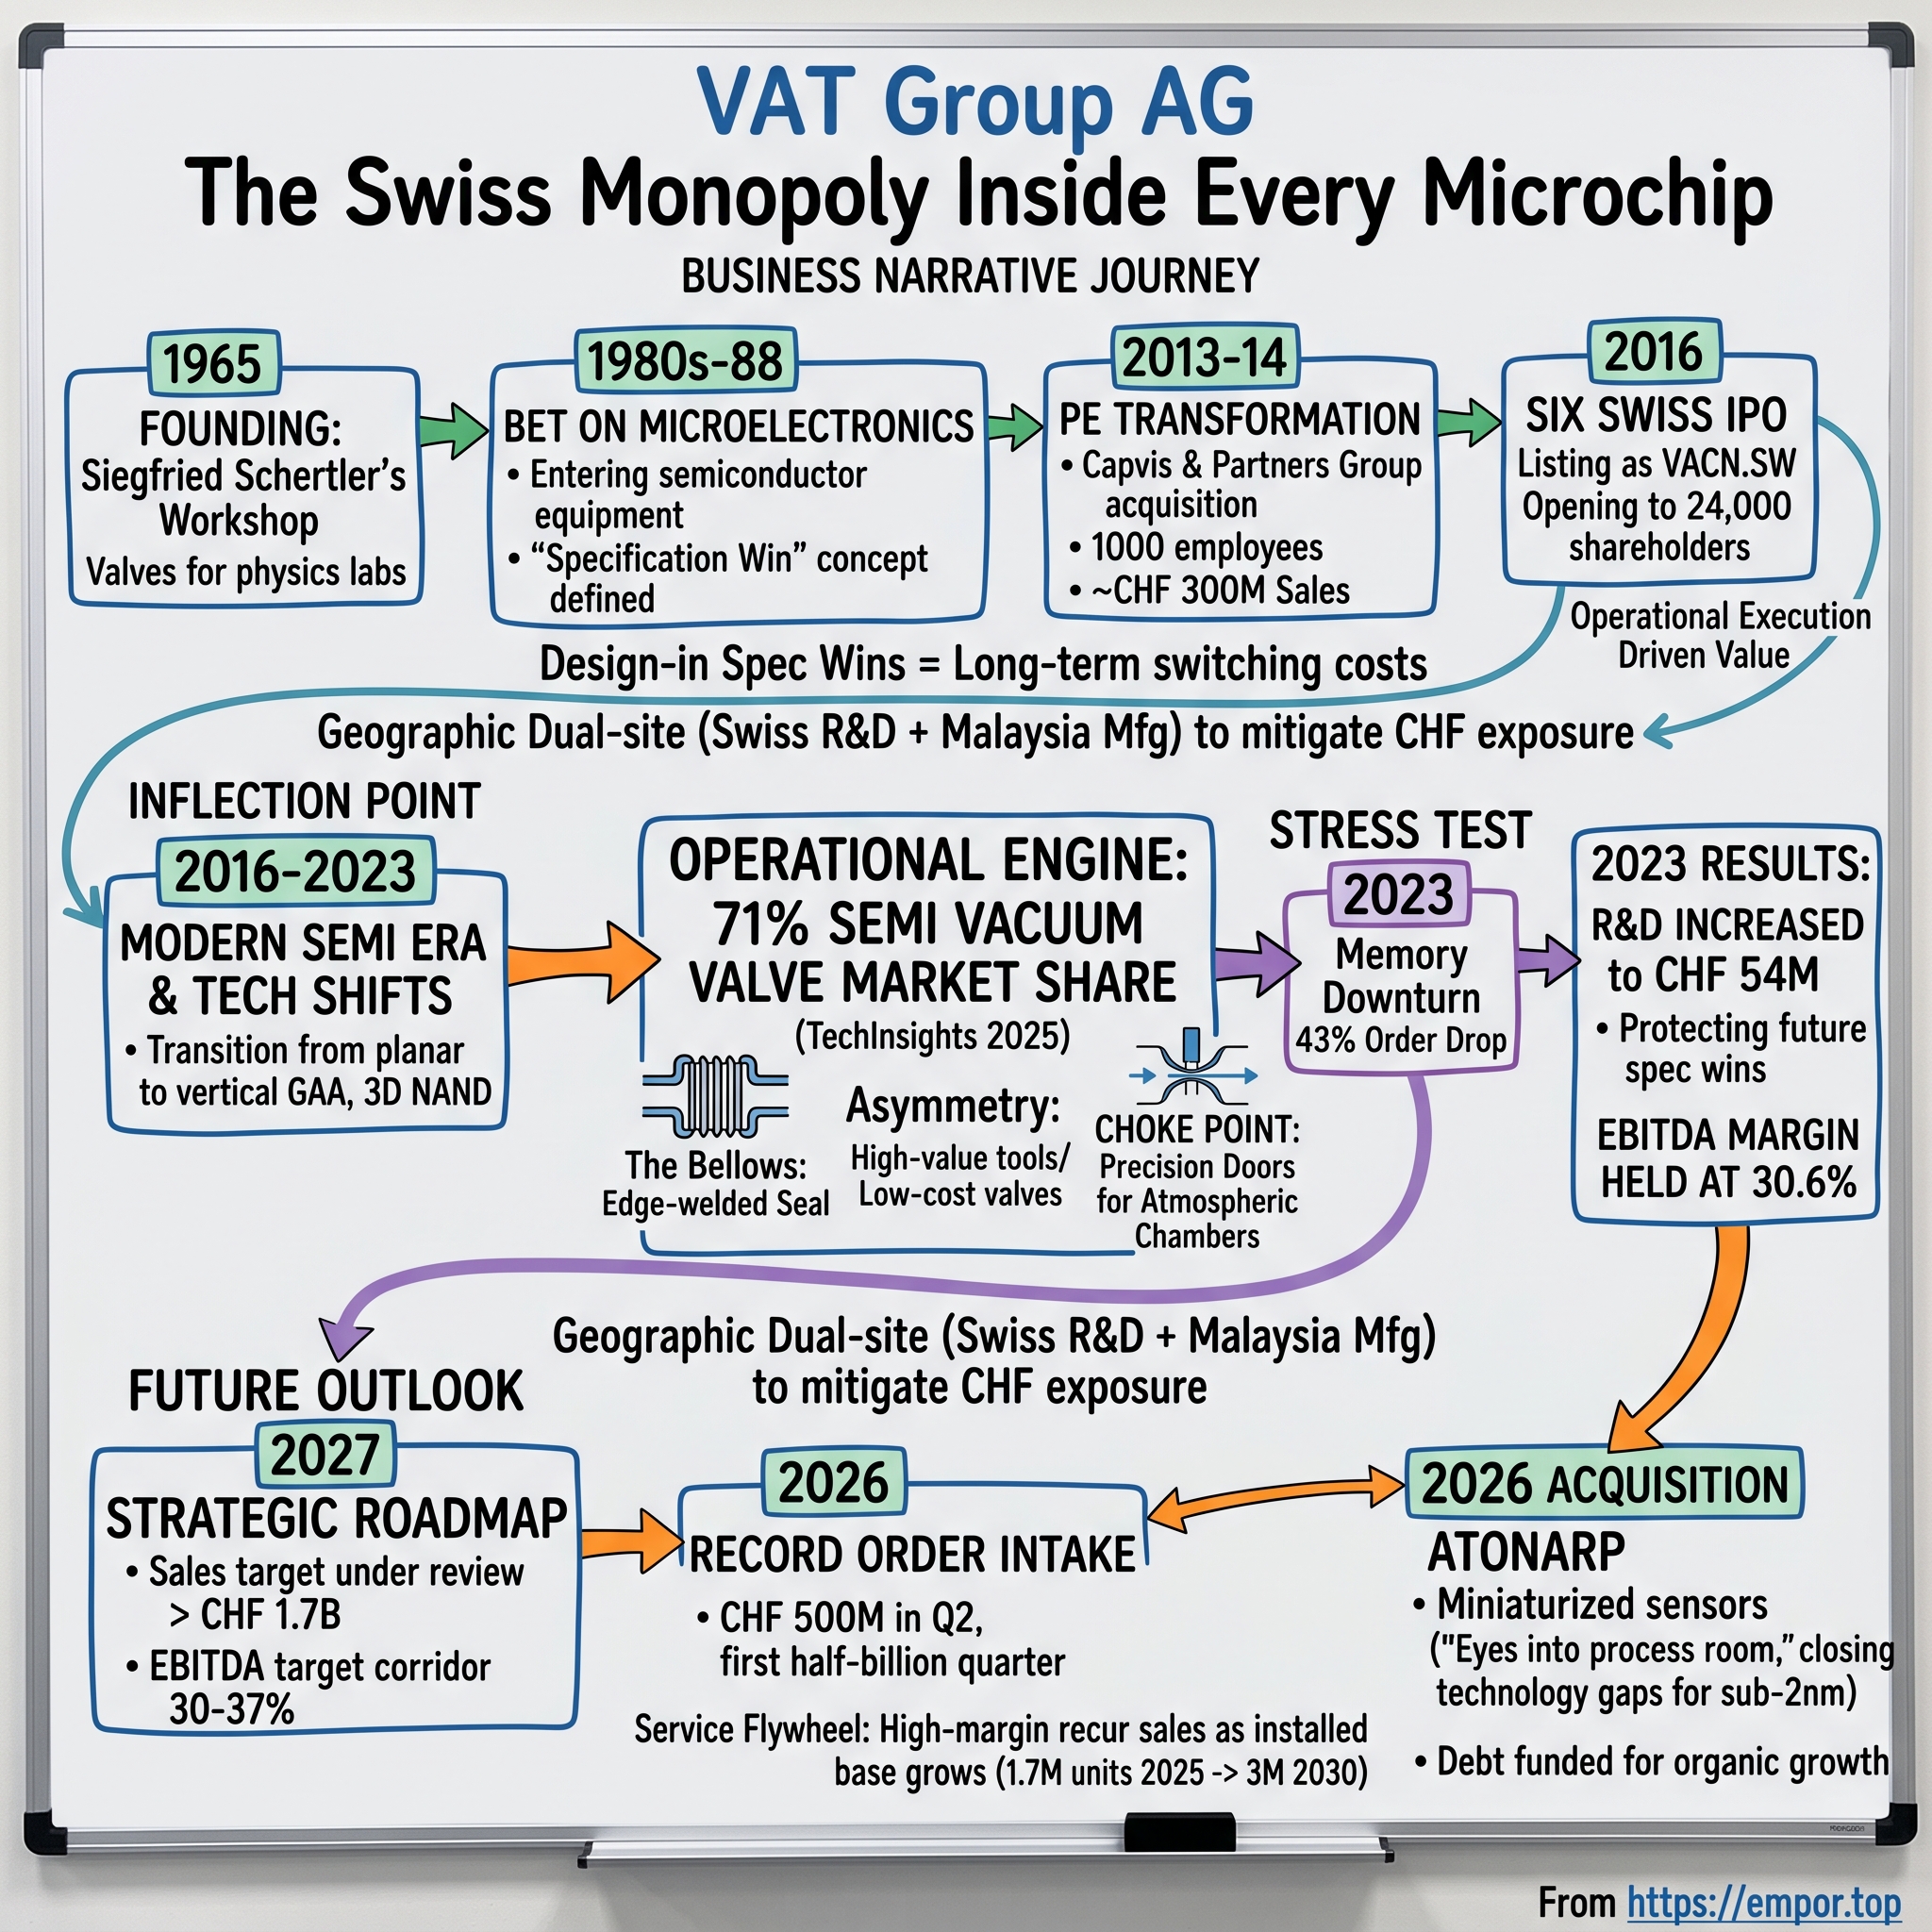
VAT Group AG: The Swiss Monopoly Inside Every Microchip
I. Introduction & Episode Roadmap (0:00 - 0:08)
On July 22, 2026, a Swiss engineering firm with roughly 3,900 employees reported the highest quarterly order volume in its 61-year history. Order intake for the three months through June reached CHF 500 million — the first half-billion-franc quarter in VAT Group's history, more than double the prior-year level and 40% above the previous quarter.3 The order book expanded to CHF 648 million, up 121% year on year. The book-to-bill ratio — orders divided by revenue, a key indicator of demand relative to shipping capacity — printed at 1.7 times, a level the company had not recorded even at the peak of the 2021 semiconductor boom.4
The stock fell more than 6%.18
That divergence between record operational demand and market reaction summarizes VAT Group's position in a single trading session. The company occupies a key choke point in the modern technology supply chain, yet its share price has frequently moved like a high-beta proxy for artificial intelligence capital expenditure. Over the twelve months through late July 2026, the stock traded between roughly CHF 258 and CHF 727 before settling near CHF 600, valuing the business at nearly CHF 18 billion.[^5] A nearly threefold valuation range within a single year for a company generating low double-digit revenue growth highlights a central contrast: operational performance remains relatively steady, while market sentiment fluctuates dramatically.
What the Company Actually Sells
VAT manufactures high-performance vacuum valves — the precision doors, gates, and throttles that control sealed atmospheric chambers during semiconductor fabrication. According to preliminary TechInsights data cited in VAT's full-year 2025 results presentation, VAT held a 71% share of the semiconductor-and-related vacuum valve market in 2025, unchanged from 2024. The next-largest competitors — MKS Instruments and V-TEX — each held roughly 6%; KITZ SCT and Presys held about 3% each; CKD Corporation, ULVAC, and HVA each accounted for about 2%; and SMC Corporation held around 1%.1 VAT's market presence exceeds the combined share of all its direct competitors and long-tail suppliers several times over.
Separating the Data From the Legend
Industry commentary frequently asserts that VAT controls over 80% of the market at the leading edge. That specific figure is not published by the company; its disclosed figures show the 71% semiconductor market share alongside a reported share of more than 60% in display-related vacuum valves.1 At its 2022 Capital Markets Day, management estimated its market share at roughly 60% across all industries and approximately 75% in semiconductors, projecting an increase of more than ten percentage points in semiconductors by 2027.8 Three years later, the disclosed semiconductor share remained flat rather than expanding. While VAT maintains a formidable competitive moat, the incremental market share gains promised by management have not yet materialized in its published data.
The Financial Signature
The company's financial profile reflects its position as a dominant component supplier within a highly cyclical capital equipment market. In 2025, VAT generated CHF 322 million in EBITDA on net sales of CHF 1,074 million — a 30.0% margin — and produced a record CHF 230 million in free cash flow, representing 72% of EBITDA.21 Return on invested capital reached 35.2%.1 Although these results demonstrate high profitability, they fell short of management's long-term targets across two of three core metrics, highlighting the impact of cyclical headwinds in 2025.
Industry reports sometimes describe VAT as debt-free, but as of mid-2026, the company carried CHF 282 million in net debt, equivalent to 0.9 times trailing EBITDA, prior to drawing an additional CHF 110 million bilateral loan to finance an acquisition.3 While this represents modest and manageable leverage, the company does not operate with zero net debt.
The Road Ahead
This analysis examines VAT Group's position across five key areas. First, the underlying manufacturing physics explain why semiconductors require high-vacuum environments and how a low-cost valve can jeopardize high-value silicon wafers. Second, the company's origins trace back to 1965, when mechanical engineer Siegfried Schertler established a workshop to build vacuum valves for research laboratories, positioning the business ahead of a major expansion in global electronics manufacturing. Third, institutional investment transformed the business following its 2014 private equity buyout by Capvis and Partners Group and its subsequent 2016 listing on the SIX Swiss Exchange. Fourth, technological transitions, the 2023 industry downturn, and current operating structures illustrate the company's operational resilience. Finally, competitive dynamics, corporate governance, capital allocation discipline, and key operational metrics define the future outlook for the business.
The operational foundation begins with the manufacturing physics.
 Subscribe on LinkedIn
II. The Physics & Economics of Vacuum in Semiconductor Fabrication (0:08 - 0:22)
In an ultra-high-vacuum semiconductor process chamber, gas pressure drops to roughly one-billionth of a millibar — an environment as sparse as the vacuum of space between Earth and the Moon. Within that void, a 300-millimeter silicon wafer suspends while plasma etches trenches just a few atoms wide.
Why Air Is the Enemy
At these microscopic dimensions, ambient air acts as a severe contaminant. Three physical challenges make an ultra-high vacuum non-negotiable.
First is particle collision. Depositing a thin film onto a wafer requires directing atoms onto a surface in precise arrangements. In atmospheric air, an atom travels only tens of nanometers before colliding with a nitrogen molecule and scattering. In a vacuum, the mean free path stretches to meters, allowing atoms to fly ballistically and land in targeted locations.
Second is chemical reactivity. Oxygen and water vapor react readily with ultra-thin semiconductor films. A single atomic layer of adsorbed moisture can ruin the electrical properties of a transistor gate stack. Because modern logic transistors are constructed from layers a handful of atoms thick, unintended oxidation damages the device.
Third is particle contamination. A single leading-edge wafer carries hundreds of individual chips, each containing tens of billions of transistors. A single microscopic dust particle landing on a circuit kills an entire die. Accumulated defects destroy manufacturing yield, which governs fab economics.
The Hardest Door in Manufacturing
Navigating those physical constraints requires specialized valve architecture. A process chamber is an active station on an automated assembly line: wafers enter and exit, process gases are introduced and evacuated in precisely metered pulses, and adjacent chambers must remain isolated so that corrosive fluorine plasma in one chamber cannot contaminate a deposition chamber next door.
A semiconductor gate valve must maintain an airtight seal, open and close hundreds of thousands of times over its operating life, withstand corrosive chlorine and fluorine gases, and tolerate elevated temperatures. Crucially, its elastomer seals cannot outgas, degrade under plasma bombardment, or shed microparticles into the chamber.
These technical demands prevent high-vacuum valves from becoming standard commodities. Machining a basic cover plate is straightforward; manufacturing a valve that cycles reliable seals millions of times in corrosive plasma without releasing a single particle — and delivering that performance consistently across thousands of units — requires high-precision engineering.
The Bellows: A Seal With No Sliding Parts
To address the mechanical sealing challenge, VAT relies on edge-welded bellows to transmit motion across the chamber wall. Conventional sliding seals generate friction and shed particles, causing chamber contamination. An edge-welded bellows uses a stack of thin metal diaphragms welded alternately along their inner and outer edges, creating a continuous, flexible metal boundary without sliding surfaces. Producing these bellows at scale with high cycle life requires specialized metallurgical techniques and precision welding.
The Asymmetry That Creates Monopolies
The strategic position of vacuum valves stems from an economic asymmetry between component cost and tool value. A wafer fabrication tool — whether an etcher, deposition system, or lithography scanner — is a multi-million-dollar machine. Constructing an advanced logic or memory fab requires roughly $10 billion to $20 billion in total equipment investment, according to management on VAT's first-half 2026 conference call.4 Within a multi-million-dollar tool, vacuum valves represent a low single-digit percentage of total cost.
If a valve fails in service, the entire processing tool shuts down, halting the production line. In a facility operating continuously at full capacity, unplanned downtime results in immediate financial losses from ruined wafers and lost production. Consequently, chipmakers prioritize operational reliability over component cost, creating a strong structural preference for established suppliers with proven track records.
Chief Executive Urs Gantner addressed this dynamic during the July 2026 call, noting that during industry supply constraints, VAT's primary directive was ensuring the supply chain "should not create any line downs" while keeping pricing value-based and aligned with long-term relationships rather than short-term scarcity.4 Protecting uptime and customer trust preserves market leadership far more effectively than short-term price escalation.
This dynamic raises a key historical question: how did a workshop in a Swiss mountain valley establish this central position in global chip manufacturing?
III. Founding Context & The Schertler Family Era (1965–2014) (0:22 - 0:38)
The Rhine Valley where Switzerland, Austria, and Liechtenstein intersect seemed an unlikely setting for an industrial technology leader. It was a narrow corridor of villages and alpine slopes, oriented toward precision craftsmanship rather than global electronics supply chains. In 1965, mechanical engineer Siegfried Schertler founded Vakuum-Apparate-Technik — abbreviated as VAT — to manufacture high-vacuum valves. The company established operations in Haag, a village in the municipality of Sennwald within the canton of St. Gallen, which remains its headquarters and main research facility six decades later.176
Building for Physicists
VAT's initial market was scientific research. Throughout the 1960s and 1970s, primary demand for extreme vacuum equipment came from physics laboratories, particle accelerator facilities, and research institutes. These customers required customized components in small batches and prioritized technical performance over unit cost. Although commercially modest, this initial focus required VAT to engineer high-specification, low-volume valves tailored to demanding experimental parameters. This technical orientation established the engineering foundation for the company's subsequent commercial expansion.
The Bet on Microelectronics
During the 1980s, the semiconductor industry began commercializing processes that had previously been confined to physics laboratories. As chip fabrication shifted into sealed vacuum chambers, semiconductor equipment manufacturers required valves capable of enduring continuous production duty cycles rather than periodic laboratory experiments. Building on two decades of research-focused engineering, VAT began manufacturing edge-welded bellows as flexible sealing elements in 1983, and formally entered the semiconductor market in 1988 with a proprietary gate valve design.17
This shift required a fundamental operational pivot. While serving scientific research remained profitable, entering semiconductor capital equipment required transitioning from custom, low-volume fabrication to standardized, high-volume, high-reliability production. In the late 1980s, the semiconductor equipment market was volatile and dominated by established American and Japanese vendors. Reorienting VAT toward industrial equipment required rebuilding manufacturing processes, quality management systems, and customer support mechanisms to meet the strict uptime standards of commercial fab operations.
The Specification Win
The strategic return on this transition depended on an industry mechanism: the design-in specification win. In semiconductor equipment manufacturing, critical components are selected years before a tool platform reaches commercial production. Once an equipment maker qualifies a specific valve within a tool design, that component is locked into the tool's bill of materials and the semiconductor maker's certified process recipe. Replacing an existing valve requires running test wafers to prove yield equivalence, introducing operational risk and switching costs that chipmakers rarely accept for modest component savings.
Throughout the 1990s and 2000s, VAT secured specification wins across major equipment platforms, including those of Applied Materials, Lam Research, and Tokyo Electron. Simultaneously, the company expanded its product line from isolation gate valves into control valves, transfer valves, and specialized modules. By the time of its acquisition in 2014, VAT offered over 1,000 standard valve types — a range described by its buyers as the largest globally.6
To serve a globalizing customer base, VAT expanded its operational footprint internationally. The company established manufacturing plants in Romania and Malaysia alongside its main facility in Haag, and opened sales offices across the United States, Japan, South Korea, Taiwan, China, Singapore, Germany, France, and the United Kingdom.6 The Schertler family funded this international expansion entirely through retained earnings over nearly five decades of ownership.17
The Limits of a Family Balance Sheet
By 2013, this growth brought family-owned capital constraints to the forefront. VAT had grown into an industry leader with annual sales exceeding CHF 300 million and approximately 1,000 employees, including roughly 700 based in Switzerland.6 However, its primary customers were consolidating into larger global enterprises and expanding at a pace that required suppliers to scale capital investment, broaden global service coverage, and recruit professional executive leadership.
Recognizing the need for broader financial and organizational backing, the shareholders of VAT Holding AG agreed in December 2013 to sell the business to investment funds advised by private equity firms Capvis and Partners Group.6 This transaction marked the end of five decades of family ownership and initiated a period of institutional restructuring and operational scaling.
IV. The PE Transformation & SIX IPO (2014–2016) (0:38 - 0:52)
Private equity acquisitions of family-owned industrial champions frequently raise concerns over aggressive debt loading and cost restructuring. The ownership transition at VAT between 2014 and 2016 followed an alternative trajectory, focusing on operational scaling and global footprint expansion rather than asset stripping.
A Buyout That Built Rather Than Stripped
Capvis and Partners Group announced their joint acquisition on December 6, 2013, and completed the transaction in February 2014 following antitrust clearance.6 The founding family retained a significant equity stake to preserve organizational continuity and institutional knowledge during the transition. Walter Keller, representing Partners Group, stated at the time that the sponsors were "committed to the strong Swiss roots of the company" and would support its technological leadership.6 Reto Loepfe assumed the chief executive role to guide the initial restructuring.
Subsequent operational choices aligned with those initial commitments. Rather than reducing local capabilities, VAT preserved Haag as its central research and development hub and its largest Swiss manufacturing facility.1 Instead of trimming domestic operations, the new sponsors directed capital toward expanding capacity closer to global semiconductor manufacturing centers.
Following the Customers to Asia
This strategy addressed a shifting customer footprint. Semiconductor fabrication capacity was concentrating in Taiwan, South Korea, Japan, and China. Equipment vendors required component suppliers to offer local inventory, faster response times, and regional engineering support. At the same time, producing exclusively in Switzerland exposed VAT to high domestic labor costs and structural headwinds from Swiss franc appreciation on foreign currency revenues.
To balance regional demand and cost efficiency, VAT implemented a dual-site strategy. The company converted its existing facility in Penang, Malaysia, into a major manufacturing hub near Asian fabs, while expanding its Arad site in Romania as a precision machining center for European supply chains. While both locations existed prior to the acquisition, the sponsors significantly increased their scale and operational responsibilities.6 This multi-region footprint continues to yield structural advantages: in the first half of 2026, approximately half of VAT's more than 700 new hires were allocated to Malaysia, expanding the local workforce by nearly 40%. Chief Financial Officer Fabian Chiozza noted that this geographic distribution serves to "reduce the exposure of the Swiss franc going forward."4 A strategic decision made in the mid-2010s continues to mitigate currency risk and support regional demand a decade later.
April 2016: Listing on SIX
Having established a global operational footprint, the private equity owners prepared for an exit via an initial public offering. On April 13, 2016, VAT priced its IPO at CHF 45 per share — the upper end of its CHF 39 to CHF 46 target range. The transaction placed 12 million base shares alongside an over-allotment option of up to 1.8 million shares, with the base placement raising CHF 540 million and establishing an initial market capitalization of CHF 1.35 billion. Trading commenced on the SIX Swiss Exchange on April 14, 2016, under the ticker VACN, establishing an initial free float of 40%, which rose to 46% following full exercise of the greenshoe option. Selling shareholders agreed to a six-month lock-up period, while executive management committed to a staggered 36-month lock-up.7 Heinz Kundert, who had succeeded Loepfe as chief executive, reported that investor demand exceeded the offered shares multiple times over.7
The transaction structure reflected the company's financial self-sufficiency. Because the IPO consisted entirely of secondary shares sold by existing owners, VAT received no direct proceeds. The listing provided a liquid equity currency for executive compensation, enhanced global visibility, and established a corporate governance framework suited for international competition. Furthermore, the 36-month lock-up for management — three times longer than the sponsors' initial lock-up — tied executive incentives to long-term operational performance.
Following the listing, Partners Group and Capvis systematically reduced their remaining holdings through orderly block sales before fully exiting their positions.6 By year-end 2024, Swiss investor Rudolf Maag represented the largest disclosed shareholder at 10.00%, followed by UBS Fund Management at 5.95% and BlackRock at 5.73%. With free float reaching approximately 90% across roughly 24,000 registered shareholders, VAT completed its transition from a sponsor-backed enterprise to a widely held Swiss public corporation.12
Where the Returns Actually Came From
Long-term shareholder returns following the listing reflect both operational growth and valuation multiple expansion. The share price rose from CHF 45 at the IPO to approximately CHF 600 by late July 2026, representing a more than thirteen-fold appreciation over ten years, excluding dividends.7[^5] Part of this appreciation stemmed from market re-rating, as investors increasingly valued VAT as a key supplier to artificial intelligence infrastructure — a perception that contributed to substantial valuation volatility, demonstrated by the stock's CHF 258 to CHF 727 trading range over the preceding twelve months.
However, operational execution provided the primary driver of value creation. Net sales expanded from just over CHF 300 million at the time of the buyout to CHF 1,074 million in 2025, accompanied by expanding operating profit margins.62 While market sentiment influenced short-term valuation multiples, sustained revenue and earnings growth underpinned the decade-long compounding trajectory.
This operational transformation positioned VAT for a period of rapid technological shifts and evolving capital expenditure cycles across the semiconductor industry.
V. The Modern Semiconductor Era & Technology Inflections (2016–2023) (0:52 - 1:10)
The evolution of the semiconductor industry after 2016 created a highly favorable growth environment for vacuum valve suppliers — driven less by overall volume expansion than by fundamental changes in manufacturing complexity.
When Transistors Went Vertical
For decades under Moore's Law, chipmakers advanced performance primarily by shrinking two-dimensional transistor layouts. Transistors remained flat, and shrinking them required printing finer features. While vacuum processing was essential, the number of vacuum steps required per wafer remained relatively stable. That dynamic changed when planar scaling hit physical limitations, forcing the industry to build vertically.
In logic chips, the FinFET design — which raised the transistor channel into a vertical fin — yielded to gate-all-around architectures, where horizontal nanosheet channels are wrapped entirely by the gate electrode. Company disclosures identify gate-all-around as the first fully three-dimensional transistor structure, placing the key inflection around 2026 as process nodes transition from the 3-nanometer class to 2-nanometer and angstrom architectures through the early 2030s and sub-angstrom nodes by the end of the decade.1 Future roadmaps project complementary FET structures that stack opposing transistors directly atop one another.
This structural shift directly expands valve demand. Building a conventional planar transistor resembles painting a single flat surface, whereas fabricating a gate-all-around transistor requires depositing and removing material inside intricate three-dimensional cavities. Process tools must execute atomic-layer deposition and etching in both vertical and horizontal directions simultaneously, moving beyond legacy line-of-sight deposition and isotropic etching.1 Because each atomic-precision layer requires dedicated processing cycles, wafer fabrication demands a higher concentration of isolated vacuum chambers.
Memory manufacturing underwent a parallel transition. To increase density without further lateral shrinking, 3D NAND flash memory transitioned to vertical cell stacking, where additional layer pairs require proportional increases in high-aspect-ratio etching and deposition steps. Dynamic RAM followed with complex three-dimensional capacitor designs and high-bandwidth memory packaging, which stacks multiple memory dies and increases overall processing intensity.
The Number That Defines the Thesis
The compounding effect of these architectural changes appears directly in the intensity of vacuum equipment spending. The vacuum-related share of total wafer fabrication equipment spending expanded from 56% in 2024 to 61% in 2025.1 While overall equipment spending grew 11% in 2025 — from $107 billion to $115 billion — spending on vacuum-related tools expanded by 21%. Demand across VAT's core technology areas outpaced broader equipment market growth: dry etch spending rose 24%, deposition grew 10%, and extreme ultraviolet lithography surged 36%.1 Capital expenditure was not merely expanding; it was becoming structurally more vacuum-intensive.
The EUV Chapter
Advanced lithography underscores this vacuum requirement. Extreme ultraviolet lithography systems operate entirely within vacuum environments because atmospheric gases absorb 13.5-nanometer EUV light. Every optical assembly, wafer handling stage, and light source module requires sealed vacuum isolation to prevent optic contamination. Company disclosures report that EUV lithography capital spending grew 36% in 2025, with management projecting the EUV share of total lithography spending to double by 2030.1 However, because VAT does not disclose sole-source positions on specific OEM platforms, assertions regarding exclusive EUV component content remain unverified external inferences rather than reported facts.
2023: The Stress Test
In 2023, a sharp cyclical downturn tested the company's operating resilience.
Following an intense post-pandemic inventory expansion, memory demand contracted sharply. Global wafer fabrication equipment spending declined 1% year on year to approximately $98 billion, though the pullback was significantly steeper in high-vacuum equipment niches.1 Order intake reflected the full severity of the pullback, falling 42.8% for the full year. Quarterly order intake bottomed at CHF 134 million in the first quarter of 2023 — down nearly 70% from a peak of CHF 434 million in the fourth quarter of 2021.54 Net sales, cushioned by an existing order backlog, declined 22.7% to CHF 885.3 million from CHF 1,145 million.5
What Held, and What It Cost
Despite a top-line decline of more than a fifth, VAT delivered a full-year EBITDA margin of 30.6%, and in the second half — the deeper part of the trough — the margin recovered to 32.1%.5 Net income fell 38% to CHF 190.3 million, free cash flow held at CHF 188.8 million, and the dividend was maintained at CHF 6.25.5
This margin resilience depended on flexible cost management. VAT reduced headcount by 10.9% to 2,666 full-time equivalents, achieving this primarily by releasing temporary workers while retaining what management termed its "highly qualified permanent employees."5 Although total personnel expenses decreased 7% in absolute terms, reduced revenue pushed labor costs from 20% to 24% of sales. In addition, research and development expenditure rose 7% to CHF 54 million during the worst year of the cycle.5
Maintaining R&D investment during cyclical troughs protects future commercial positioning, because in an industry where specification wins convert into revenue three to five years later, a year of underinvestment risks creating revenue deficits in subsequent years.1 The subsequent specification-win trajectory — rising from 99 in 2022 to 120 in 2023, 132 in 2024, and 150 in 2025 — aligns with that sustained development spending, though attributing these wins directly to downturn investment reflects management's interpretation rather than an independently verified link.1
This operational performance established the company's internal benchmark of sustaining a 30% EBITDA margin through a 30% revenue decline. While VAT passed that initial stress test in 2023, subsequent operational performance in 2025 provides broader context regarding the structural limits of this flexibility.
VI. Anatomy of the Business: Segments, Economics, & Financial Engine (1:10 - 1:28)
Behind VAT's top-line performance lies an operational structure divided into two primary reporting segments, each driven by distinct economic models.
Two Businesses, One Company
The core Valves segment generated CHF 952 million in 2025 — up 12.9% year on year — and accounted for 82% of net sales.2 Within Valves, semiconductor applications expanded 14.6% to CHF 725 million, while Advanced Industrials grew 5.2% to CHF 150 million.2 Analyzed by end market rather than reporting unit, direct semiconductor equipment represented 67% of group sales, Advanced Industrials accounted for 14%, and Global Service provided 19%; when semiconductor fab servicing is included, chip-related demand drove more than 80% of total revenue.1 Geographically, Asia-Pacific generated 73% of sales — with China alone contributing roughly 32% — followed by the Americas at 15% and EMEA at 12%.1
Advanced Industrials represents a smaller, non-semiconductor component of the portfolio. Of its CHF 150 million in 2025 revenue, scientific research — VAT's legacy market, including nuclear fusion projects expected to achieve commercial rollout only after 2030 — accounted for roughly a quarter, scientific instruments generated another quarter, targeted industrial applications represented 30%, coatings contributed 15%, and power generation provided 5%.1 Solar market sales remained at a fraction of their peak 2023 levels, with management projecting no recovery before 2027.1 Rather than expanding volume in lower-margin industrial subsectors, management operates the segment with disciplined capital allocation, prioritizing selective high-margin applications over top-line growth.
The Service Flywheel
The Global Service segment generates higher profitability than the equipment business, delivering CHF 199 million in 2025 revenue — an 18.7% increase — at a segment EBITDA margin of 45.6%, roughly 15 percentage points above group profitability.2 This division supplies spare parts, consumables, maintenance, retrofits, and technical upgrades for VAT valves installed across operating semiconductor fabrication plants.
This recurring service model expands directly with the installed valve base. Company presentations trace installed units from approximately 800,000 at the 2016 IPO to 1.7 million in 2025, with management projecting an increase to 3.0 million units by 2030.1 Because valves require ongoing maintenance and replacement parts over an operating life exceeding a decade, equipment shipments establish a recurring revenue pipeline. Chief Financial Officer Fabian Chiozza outlined this lag during the July 2026 conference call, noting that surging original equipment shipments "will really only start converting into service sales 12-24 months from now."4 Consequently, order book expansion in original equipment serves as a leading indicator of future service revenue.
Capturing high-margin service revenue requires customers to buy original equipment parts rather than third-party alternatives. To protect this position, VAT relies on geographical proximity, placing service hubs and technical personnel near major semiconductor hubs to minimize customer downtime.1 While industry commentary sometimes asserts that company technicians are permanently embedded inside customer facilities, official corporate disclosures document regional service centers and field staff stationed near major manufacturing clusters rather than resident staff within specific customer fabs.
Margin Architecture and Its Fine Print
Evaluating VAT's cost structure requires examining its reported gross profit margin, defined as net sales minus material costs adjusted for inventory changes. Under this metric, gross margin reached 63.5% in 2025, down from 66.4% in 2024, as the prior year's working capital accumulation reversed and foreign exchange movements created headwinds.1 In the first half of 2026, gross margin rebounded to 66.6%, compared with 65.5% in the prior-year period.34 Sustaining gross margins between 63% and 67% through sharp cyclical swings reflects pricing power and low raw material cost intensity, as product pricing primarily reflects precision engineering, qualification rigor, and operational reliability.
Research and development expenditure reached a record CHF 75 million in 2025 — representing 7% of net sales, a 22% increase year on year — exceeding the company's target range of 4% to 6% while supporting over 100 simultaneous customer projects.1 By the first half of 2026, active development projects expanded to more than 130.4 Management frequently emphasizes that VAT's R&D budget exceeds the combined spending of its competitors. While published competitor disclosures do not provide separate R&D line items for verification, VAT's absolute investment far exceeds that of individual valve peers, whose market shares remain at roughly 6% or less.1
Capital intensity remains moderate despite recent expansion. Net capital expenditure reached CHF 68 million in 2025, or 6% of sales — above the target guidance band of 4% to 5% — as the company completed three major infrastructure projects: Plant 1B in Malaysia, the Innovation Center in Haag, and expanded production facilities in Romania.1 Management completed these facilities ahead of an anticipated cyclical recovery, creating operational capacity to increase quarterly output by 30%.1 While investing capital ahead of demand carried execution risk during a market downturn, it established the manufacturing capacity required to handle the sharp order surge in 2026.
Return on invested capital reached 35.2% in 2025, compared with 35.6% in 2024.1 Although these figures demonstrate high capital efficiency, they remain below the management target of more than 45% reaffirmed at successive Capital Markets Days, a gap attributed in company presentations to a 22% increase in R&D spending and a 23% increase in capital expenditure.1
Cash, Currency and the Payout
Cash generation provided a key operational highlight in 2025, with free cash flow reaching a record CHF 230 million as management reduced net working capital from 33% to 25% of sales.1 Cash conversion reached 72% of EBITDA, exceeding the historical average of 70%.1 Further down the income statement, net income grew 1% to CHF 214.3 million despite a 10% gain in EBITDA, as foreign currency revaluations of bank balances and intercompany financing moved the net finance result from a CHF 2.4 million gain to a CHF 15.5 million loss — demonstrating how currency volatility on unhedged balances can offset operational gains for a Swiss exporter.1 The effective corporate tax rate was 16.7%.1
Shareholders approved a 12% dividend increase to CHF 7.00 per share at the 2026 annual general meeting.1 Based on approximately 30 million shares outstanding and CHF 230 million in free cash flow, the total payout represented roughly 90% of free cash flow, aligning with management's policy set at the 2025 Capital Markets Day to distribute up to 100% of free cash flow.9 By returning substantially all generated cash flow to shareholders, VAT relies on operating cash flow and existing capacity to fund ongoing growth, maintaining a lean balance sheet while offering limited cash buffers during severe cyclical downturns.
Understanding this operational and financial model leads to a key strategic question: how securely can VAT defend its positions against emerging competitors and alternative technologies?
VII. Competitive Dynamics & M&A Benchmark: VAT vs. Peers (1:28 - 1:44)
An evaluation of competitive dynamics in the vacuum valve market illustrates the structural barriers protecting VAT's dominant position.
War-Gaming an Attack on VAT
A direct competitive assault against VAT faces steep financial and operational hurdles. VAT's 71% share in semiconductor-and-related vacuum valves has remained essentially flat since 2022 after climbing steadily from the low forties in 2015.1 Displacing even a fraction of a percentage point annually is difficult when VAT reinvests CHF 75 million each year in research and development — an amount that rivals or exceeds the entire revenue of smaller competitors. Matching VAT's engineering capacity would require a competitor to spend a multiple of its own profits indefinitely to contend for tool platforms where the incumbent already holds design-in specifications.
A more plausible strategy — targeting mature-node and broader industrial segments where technical specifications are less rigid — reflects current competitive realities. VAT's 2025 presentation acknowledged this dynamic, describing its strategic position as "growing in the leading edge and defending regional pressure on mature nodes."1 This regional pressure primarily stems from Chinese domestic suppliers serving local semiconductor fabs amid Beijing's drive for supply-chain self-sufficiency. VAT projects that China's self-sufficiency ratio — the proportion of Chinese wafer fabrication equipment spending directed to domestic toolmakers — will rise from 17% in 2024 to 40% by 2028.1
The Field, Measured
Across the competitive landscape, MKS Instruments serves as the closest broad-line peer, competing across vacuum instruments and subsystems with roughly a 6% valve share.1 V-TEX holds a similar 6% share, while KITZ SCT and Presys each hold about 3%. Japanese industrial pneumatics specialists SMC Corporation and CKD Corporation hold roughly 1% and 2% of the market, respectively, as ultra-high-vacuum semiconductor process valves require a distinct engineering discipline from factory automation pneumatics.1 ULVAC and HVA each account for about 2%, leaving all remaining suppliers combined with a 6% share.1
The central strategic question is not whether a competitor will displace VAT at leading-edge nodes such as 2 nanometers, but whether mature-node and domestic Chinese equipment makers will expand rapidly enough to bifurcate the market. If growth shifts predominantly toward regional mature-node fabs, VAT's 71% market share could eventually represent a dominant position within a shrinking fraction of global capital spending.
The MKS-Atotech Counterexample
Capital allocation strategies among industry peers highlight contrasting approaches to balance sheet management and cyclical risk.
MKS Instruments announced on July 1, 2021, that it would acquire Atotech, a specialty chemicals and equipment company serving printed circuit board and semiconductor packaging markets, for an equity value of $5.1 billion and an enterprise value of approximately $6.5 billion — cash plus stock, funded with available cash and committed debt financing.16 The deal was projected to leave MKS with about $5.3 billion of total debt outstanding at closing, gross leverage under 4.0 times and net leverage under 3.5 times, with $50 million of annual cost synergies expected within 18 to 36 months.16
The transaction closed in August 2022, shortly before the semiconductor capital equipment market entered a sharp cyclical downturn and central banks raised interest rates rapidly. Taking on roughly $5.3 billion of debt to acquire a business at cycle-peak valuation left MKS servicing heavy debt obligations through a demand trough with significantly higher refinancing costs. Although the strategic logic of combining lasers, optics, and motion with process chemistry remains intact, the deal's timing and debt financing converted a strategic expansion into a balance sheet constraint, directing cash flow toward debt reduction rather than research and development or shareholder returns.
VAT's capital allocation during the same period followed a contrasting approach. Through the 2023 industry downturn, VAT maintained modest leverage, preserved its dividend, increased research spending, and funded capital investments in Malaysia, Romania, and the Haag Innovation Center — infrastructure that came online precisely as the 2026 ramp began.51 By avoiding heavy debt service obligations, VAT retained the financial flexibility to invest counter-cyclically during an industry trough.
Atonarp: A Small Deal With a Long Fuse
VAT's July 2026 acquisition announcement represents a notable departure from its historical focus on organic growth.
VAT agreed to acquire Atonarp, a Japan-headquartered developer of miniaturized mass-spectrometry sensors, for approximately CHF 110 million in cash, funded by a committed bilateral loan of the same amount, with closing expected in the third quarter of 2026.153 Founded in 2009, Atonarp developed the ASTON platform to measure gas composition in real time inside a process chamber.415 Chief Executive Urs Gantner illustrated the technology's function on an analyst call, stating that chipmakers currently operate "in a dark room" and that the sensor platform provides "eyes into the room."4 The strategic rationale centers on the requirement for molecular-level process visibility as semiconductor nodes advance below 2 nanometers.
Management was explicit regarding the transaction's financial profile. Gantner noted that success "should not be measured by near-term accretion, dilution, or cost synergies," describing it as "fundamentally a technology and capabilities acquisition" to be judged by future specification wins.4 Chief Financial Officer Fabian Chiozza added that meaningful bottom-line contributions are expected "by the end of the decade," supported by an additional annual research commitment of roughly 0.5% of revenue to build the platform.4 Management did not disclose Atonarp's revenue, employee count, or profitability.15
From an investment perspective, three factors define the transaction. First, at roughly 0.6% of VAT's market capitalization, the financial downside remains limited. Second, funding the purchase with debt reflects VAT's policy of distributing substantially all free cash flow to shareholders rather than balance sheet distress. Third, because management framed the deal around specification wins expected by 2030, its performance cannot be evaluated in the near term. A key benchmark for progress will be future specification wins, which management indicated it plans for 2027.4
That presentation will be delivered by a management team whose operational record forms the next subject of analysis.
VIII. Management, Governance, & The 2027 Strategic Roadmap (1:44 - 1:58)
During the July 2026 earnings call, Chief Executive Urs Gantner described VAT's production ramp with a mechanical metaphor. In investor meetings over preceding months, he had compared the ramp-up to "an idle diesel engine starting up — a lot of noise, a lot of smoke, but not yet operating at full speed." With second-quarter results delivered, Gantner reported that "the engine is now running smoothly."4
The Engineer in the Corner Office
The analogy reflects Gantner's background as a mechanical engineer. He holds a master's degree in mechanical engineering from ETH Zurich and joined VAT in 2004 as a product manager for customized transfer valve solutions.10 He assumed leadership of the semiconductor business unit in 2015, expanding it at more than twice the market growth rate, guided the expansion of the Malaysian manufacturing facility, and became executive vice-president of the Semiconductor Solutions Group in August 2022.10 He was appointed chief executive effective January 1, 2024, at age 53.10
Gantner succeeded Mike Allison, who announced in February 2023 his intention to step down at year-end after roughly six years leading the company through its post-IPO transition.10 Chairman Martin Komischke framed the internal succession as "further evidence of the high quality of our people."10 The transition was announced roughly ten months before taking effect, providing organizational stability. Allison was subsequently elected to the board of directors in April 2025, offering institutional continuity while placing the former chief executive on the board evaluating his successor.11
The CFO and the Falsifiable Forecast
Group Chief Financial Officer Fabian Chiozza assumed his role early in the second quarter of 2021.11 He joined VAT from Autoneum, where he served as divisional CFO for South America, the Middle East, and Africa, following senior finance roles at Rieter, including group controller. He holds a master's degree in accounting and finance from the University of St. Gallen. During the July 2026 conference call, Chiozza urged operational caution despite surging demand, stating: "It's not a sprint, it's a marathon. We have to pace ourselves."4
That discipline was evident in his second-half margin outlook. With consensus full-year sales of approximately CHF 1.3 billion implying more than 50% second-half revenue growth, Chiozza noted that having already hired 700 employees, production headcount would need to increase by only 10% to 15% further. As fixed-cost absorption improves, inflation stabilizes at first-half levels, and the continuous improvement program yields larger contributions in the second half,4 he projected full-year EBITDA would land in "the upper half of the lower half" of the guidance band, while second-half EBITDA would reach "the upper half of the upper half."4
Board, Auditor and How Executives Get Paid
Chairman Martin Komischke was elected in May 2017 and has been re-elected annually. The board of directors comprises eight non-executive members: Komischke, Vice-Chairman Urs Leinhäuser, Libo Zhang, Daniel Lippuner, Petra Denk, Thomas Piliszczuk, Clara-Ann Gordon, and Allison.11 The executive committee consists of three members: Gantner, Chiozza, and Chief Operating Officer Thomas Berden, who was appointed in October 2020.11 KPMG serves as external auditor.12
The executive compensation structure relies on structured performance metrics:
- Short-Term Incentive (STI): Based on four equally weighted objectives (25% each): EBITDA margin, free cash flow, growth—measured through auditable significant specification wins, co-development agreements, and new business models or sales channels—and a sustainability-and-projects category covering Sustainalytics ratings, Scope 3 emissions targets, Gallup employee engagement, ERP implementation, and operational excellence.13
- Long-Term Incentive (LTI): Granted in performance share units with three-year cliff vesting based on three equally weighted relative metrics (33.3% each): relative net sales growth, relative total shareholder return (TSR), and relative return on invested capital (ROIC). Each metric is ranked against an industry peer group, paying zero below the 25th percentile and capped at 200%.13
Relative benchmarking isolates operational execution from cyclical industry swings. The 2021–2023 LTI award vested at 152%, driven by a relative ROIC ranking at the 96.3rd percentile, TSR at the 73.7th percentile, and net sales growth at the 57.3rd percentile.13 Management compensation rewarded capital efficiency over volume expansion. Executive share ownership guidelines took effect January 1, 2024, requiring the chief executive to hold 200% of annual base salary in VAT shares and other executive committee members to hold 100% within five years.13
Target-Setting Under Scrutiny
At its 2022 Capital Markets Day, management set 2027 targets calling for net sales of CHF 1.8 billion to CHF 2.2 billion, an EBITDA margin corridor of 32% to 37%, ROIC above 45%, free cash flow conversion of 60% to 65%, capital expenditure of 4% to 5% of sales, and R&D spending of 5% to 6%. Management also projected expanding its semiconductor market share by more than ten percentage points by 2027.8
At the May 20, 2025 Capital Markets Day, management revised its 2027 sales target down to CHF 1.5 billion–CHF 1.7 billion and lowered the EBITDA margin corridor floor to 30%–37%.9 Management attributed the lower revenue outlook to a reduced 2027 wafer fabrication equipment (WFE) market assumption of $125 billion—down from $135 billion—and foreign exchange movements, specifically a US dollar exchange rate of 0.83 Swiss francs compared to 0.95 previously, representing a 13% adverse currency movement.9 Long-term guidance for 2025 through 2029 called for low-to-mid-teens annual revenue growth, a 30% to 37% EBITDA margin corridor, free cash flow conversion of 60% to 70%, ROIC above 45%, capital expenditure and R&D each around 5% of sales, and dividend payouts reaching up to 100% of free cash flow.9
Lowering the EBITDA margin floor to 30% aligned guidance with recent operational performance—30.6% in 2023, 31.2% in 2024, and 30.0% in 2025—reflecting the reality that VAT had not surpassed a 32% margin since 2022.
The Target Moves Again
By mid-2026, market conditions shifted upward again. On the July 2026 call, management stated that the CHF 1.5 billion to CHF 1.7 billion sales range for 2027 was "under review" because WFE estimates had risen substantially while currency assumptions remained largely unchanged.3 Consensus WFE for 2026 reached approximately $145 billion—up about 23% from 2025—compared to the roughly $130 billion assumed at the March 2026 results presentation.41 Gantner declined to provide a revised 2027 figure, stating that visibility into customer ordering patterns was insufficient "to quantify the magnitude of that growth with the precision we require."4
When analyst Joern Iffert proposed scaling the FX-adjusted 2027 midpoint of roughly $1.4 billion (built on $125 billion WFE) alongside industry growth toward $200 billion WFE, Gantner called it "a good model," and Chiozza added, "Maybe a bit more."4 The exchange indicated that the primary operational constraint on VAT entering 2027 lies in manufacturing capacity and supply chain throughput rather than customer demand.
Manufacturing metrics define that capacity envelope. Theoretical production capacity stands at CHF 2.5 billion to CHF 2.6 billion in annual output, with additional expansion potential on unused Phase 1C land in Malaysia.4 The year-end 2026 target aims for a quarterly factory output run rate above CHF 450 million, supplemented by 10% to 15% of revenues generated outside direct factory output.4 Capacity utilization reached approximately 70% in Switzerland and 80% to 85% at Malaysia Plant 1A.4 Chiozza identified the operational bottleneck not as internal labor or physical assets, but as component availability across the 75% of inputs sourced from external suppliers.4
While external industry summaries occasionally attribute a formal target of sourcing over 55% of manufacturing from best-cost countries to management, official corporate disclosures state more broadly that material sourced from best-cost countries "will further increase" to mitigate Swiss franc currency exposure.4
IX. Strategic Frameworks: 7 Powers & 5 Forces Analysis (1:58 - 2:12)
Frameworks are only useful if they can fail. Applied honestly, Hamilton Helmer's 7 Powers and Porter's Five Forces should identify not just where VAT is strong, but where that strength is thinner than the narrative suggests.
The Seven Powers, Ranked by Evidence
Switching costs are the load-bearing power, and they are extreme. Qualification locks a specific component into a specific position within a customer's process recipe, and changing it requires requalification with no direct economic benefit. What makes this power unusually durable at VAT is that it operates at two levels simultaneously: the equipment manufacturer locks the valve into the tool design, and the chipmaker then locks the tool into a production recipe. VAT would have to fail twice across two independent customers for a position to open. The observable evidence is a semiconductor market share that remained flat at 71% for two years after rising steadily for seven, in an industry where every buyer maintains a permanent incentive to dual-source.1 The falsification test is straightforward: if market share erodes at the leading edge while company disclosures describe it as growing there, the power is weakening.
Process power is high and genuinely hard to observe from the outside. Six decades of accumulated know-how in edge-welded bellows manufacturing, surface treatment, elastomer formulation under plasma bombardment, and low-particle actuation are not documented in patents alone; much of it is tacit, residing in specific personnel and production lines. The empirical evidence that this advantage is real is that competitors with far larger corporate parents, including major Japanese industrial groups, have not crossed into this niche at scale despite decades of opportunity.1
Scale economies in R&D are real but frequently overstated. VAT spends CHF 75 million annually across more than 130 simultaneous development projects.14 Against competitors holding roughly 6% market share each, VAT's absolute engineering capacity is a large multiple of any single valve-focused rival's. However, the popular claim that VAT spends five times all competitors combined is not disclosed by the company and should not be cited as fact. The actual scale advantage is subtler: because VAT is designed into every major platform, it can develop a product once and amortize the cost across the entire industry, whereas a challenger must fund development to win a single position.
Cornered resource is moderate. VAT holds an active patent portfolio, and the Atonarp acquisition explicitly bought "a differentiated technology platform protected by a strong portfolio of patents."4 Yet patents eventually expire and can be designed around. The more durable resource is organizational — the co-development relationships that give VAT visibility into customer roadmaps years in advance. The specification-win process runs 18 to 24 months and typically converts to revenue three to five years later, meaning VAT is engineering today for tool platforms that will ship near the end of the decade.1 A competitor cannot simply purchase a seat in those strategic conversations.
Counter-positioning is essentially absent, and that is a strength worth naming. Counter-positioning requires a new entrant to adopt a business model that the incumbent cannot copy without damaging its existing operations. No such model exists in this market. A cheaper valve is not a distinct business model; it is a lower-performing product in an industry where the buyer's dominant cost is tool downtime, not component purchase price. The nearest equivalent to counter-positioning is the Chinese domestic supply chain, which competes not on a superior business model but on a state policy mandate.
Branding and network effects are weak, and the "VAT Inside" framing oversells them. There is no consumer brand and no network effect in any technical sense. What exists is specification power within a small community of equipment engineers, which is a byproduct of switching costs and process power rather than an independent source of competitive advantage.
Porter's Five Forces, Honestly Applied
Evaluating Porter's Five Forces reveals three unambiguous dynamics and two that require careful qualification.
Threat of new entrants: very low. Market entry requires simultaneous mastery of vacuum physics, precision metallurgy, elastomer chemistry, and high-mix, low-volume manufacturing, followed by a multi-year qualification cycle during which revenue is zero and the incumbent's components perform reliably. Capital is readily available to many industrial firms; the necessary time and a customer's willingness to absorb operational risk are not.
Threat of substitutes: very low, representing the most robust force in VAT's favor. There is no known alternative to vacuum environments for atomic-scale deposition and etching. Industry trends run in the opposite direction, as vacuum-related equipment spending rose from 56% to 61% of total wafer fabrication equipment spending in a single year.1 The technological roadmap through gate-all-around architectures, complementary FETs, and sub-2-nanometer nodes increases vacuum intensity rather than reducing it. This force is grounded in manufacturing physics rather than commercial preference, and physical constraints do not renegotiate.
Supplier power: low to moderate, but rising. Raw material inputs are commodities; management noted that aluminum prices on the London Metal Exchange spiked as high as $3,800 per ton in June 2026 before recovering to roughly 5% up year to date, with hedges extended and no additional margin pressure expected.4 However, the primary supplier risk lies not in raw metals, but in the 75% of processed components that VAT purchases from external vendors.4 Operational disruptions in early 2026 illustrated this exposure when conflict in the Middle East caused partial supply chain delays, deferring an estimated CHF 20 million to CHF 25 million of first-quarter revenue.14 In this market, supplier power manifests less as price inflation than as physical component availability during an operational ramp.
Buyer power: moderate and the most contestable force. VAT's customer base is concentrated among a small group of major equipment manufacturers. Because the company does not disclose revenue by named customer, exact concentration metrics are not public. Offsetting factors are substantial — sole-source design-in positions, high requalification costs, and a component price that remains immaterial to total tool cost. However, that offset has limits. Large customers retain substantial bargaining leverage, and Chief Executive Urs Gantner's decision in July 2026 not to raise prices during an acute industry shortage demonstrates that VAT avoids exercising short-term pricing power even when market conditions allow it.
Rivalry: low at the leading edge, but meaningfully higher at mature nodes. This market bifurcation represents a critical nuance in the competitive picture, as reflected in VAT's explicit strategy of "defending regional pressure on mature nodes."1
The two frameworks converge on a consistent conclusion: VAT maintains an exceptionally defensible position in the fastest-growing segment of the market, faces real regional pressure in mature nodes, and consistently prioritizes long-term customer relationships over short-term margin extraction.
X. Bear vs. Bull Case & Skeptical Investor Stress Test (2:12 - 2:24)
Two intelligent investors can look at the same VAT Group and reach opposite conclusions. Both cases are stronger than the caricatures usually presented.
The Bull Case
The bull case starts with an end market that continues to surprise to the upside. Wafer fabrication equipment consensus shifted from roughly $115 billion in 2025 toward approximately $145 billion for 2026 within months, while management outlined a path toward $200 billion by 2028 and beyond, supported by more than 140 semiconductor fabs currently under construction or equipment installation.41 The underlying demand driver remains fundamental rather than speculative: hyperscaler data center investments require advanced logic and high-bandwidth memory that existing manufacturing capacity cannot supply. During the July 2026 conference call, management summarized the dynamic plainly, noting that global chip manufacturing capacity remains "fully booked into 2027."4
The second pillar is vacuum intensity, the structural core of the growth thesis. VAT's revenue does not track wafer fabrication equipment spending as a static percentage; its share expands as chipmaking shifts toward vacuum-intensive manufacturing steps. In 2025 alone, growth in vacuum-related equipment spending outpaced overall equipment spending by ten percentage points.1 If that pattern persists through upcoming gate-all-around and complementary FET architectural transitions, VAT can compound revenue faster than the broader equipment market even without capturing additional market share.
Third, the high-margin service annuity provides long-term earnings visibility. The installed valve base expanded to 1.7 million units by 2025 and is projected to reach 3.0 million units by 2030, generating recurring revenue at segment EBITDA margins in the mid-forties.12 Crucially, the service revenue associated with record 2026 equipment shipments has not yet materialized in reported financial results, as conversion typically begins 12 to 24 months after installation.4 This creates a predictable pipeline of high-margin cash flows stemming directly from equipment already delivered or ordered.
Fourth, exceptional capital efficiency underpins cash generation without structural leverage. VAT generated a return on invested capital in the mid-thirties, achieved cash conversion of 72% of EBITDA, and supported the distribution of substantially all free cash flow to shareholders — funded entirely by operating cash flows rather than balance sheet leverage.1 Furthermore, the manufacturing capacity required to serve the 2026 production ramp was largely constructed and funded before demand accelerated.
The Bear Case
The counter-argument presents equally specific operational and structural challenges.
The margin trajectory presents the most immediate challenge to the bullish thesis. In the first half of 2026, VAT expanded order intake by 75% but recorded an EBITDA margin of 29.0% — falling below its target guidance corridor and down from 29.6% in the prior-year period.3 Net sales declined 8.3% year on year during the same period, remaining flat at constant currency.3 Within the core Valves division, segment EBITDA margin contracted by 3.3 percentage points to 30.3%.3 Management attributed this margin pressure to front-loaded ramp-up costs, the addition of 709 new employees representing a 22% workforce expansion, and temporary fixed-cost underabsorption on lower shipped revenue.34 Nevertheless, the trend warrants scrutiny: after lowering its long-term EBITDA margin corridor floor from 32% to 30% in May 2025, the company delivered a 29.0% margin at the onset of a major demand acceleration. Management's expectation of strong second-half operating leverage represents an explicit, testable claim to which Chief Financial Officer Fabian Chiozza has tied operational credibility.4
Foreign exchange exposure creates a persistent structural headwind for a Swiss exporter. The downward revision to 2027 targets in May 2025 stemmed substantially from a 13% adverse movement in US dollar exchange rate assumptions.9 In 2025, foreign currency revaluations swung the net finance result by over CHF 17 million into negative territory.1 In the first half of 2026, reported sales declined 8.3% while remaining flat at constant currency, demonstrating that translation effects accounted for the entire top-line contraction.3 Because financial hedging cannot permanently insulate a Swiss-franc cost structure against revenues earned in dollars, yen, and won, management's primary mitigation strategy relies on expanding manufacturing capacity in lower-cost regions such as Malaysia and Romania.4
Geopolitical dynamics and Chinese market concentration introduce dual-sided operational risks. China generated approximately 32% of group sales in 2025 and 28% in the first half of 2026, while accounting for roughly 35% of first-half order intake; Chief Executive Urs Gantner dismissed suggestions of weakening Chinese demand, attributing the lower revenue share to faster growth in other geographic regions.14 Beijing's semiconductor self-sufficiency initiative acts as a double-edged sword, driving immediate fab construction that fuels current valve orders while fostering domestic equipment suppliers that could challenge mature-node market share over time. Company projections indicate that Chinese domestic equipment manufacturers will increase their share of local equipment spending from 17% in 2024 to 40% by 2028.1 Furthermore, expanding export controls and potential trade tariffs remain persistent risks, leading management to list geopolitical risk management among its top financial priorities for 2026.1
Supply chain execution represents the primary operational constraint during output acceleration. Operational disruptions in early 2026 illustrated this vulnerability when Middle Eastern transit delays deferred between CHF 20 million and CHF 25 million in first-quarter revenue recognition.14 With approximately 75% of production inputs purchased from external vendors during an unprecedented manufacturing ramp, component availability from third-party suppliers remains a key operational risk.4
The Activist's Angle
A critical investor analysis would highlight three specific governance and execution points. First is target setting credibility: management reduced its 2027 revenue outlook by roughly 20% and lowered its EBITDA margin floor in May 2025, only to place those same targets under review for an upward revision fourteen months later, suggesting multi-year guidance responds to near-term market sentiment rather than providing a stable long-term anchor.93 Second is the persistent return on invested capital gap: while management has reaffirmed a target ROIC above 45% across successive Capital Markets Days, reported returns have remained in the mid-thirties, diluted by elevated capital expenditure and research spending.189 Third is capital allocation strategy: despite a policy of distributing substantially all free cash flow to shareholders, the company drew a CHF 110 million debt facility to acquire Atonarp — a transaction expected to generate meaningful financial returns only by the end of the decade while requiring an additional annual R&D commitment equal to 0.5% of sales.34 Although financially modest, the transaction introduces debt-funded acquisition risk to an organic growth model.
Finally, market valuation leaves little margin for operational missteps. At an equity valuation of approximately CHF 18 billion against 2025 net income of CHF 214 million, the stock price reflects high growth expectations.[^5]1 The stock's twelve-month trading range between roughly CHF 258 and CHF 727 illustrates significant valuation volatility that far exceeds underlying operational fluctuations.[^5] For long-term investors, this volatility demonstrates that business quality alone does not insulate shareholder returns from broader valuation re-ratings.
The Honest Synthesis
In summary, VAT Group combines a highly defensible competitive moat with measurable end-market tailwinds. The investment thesis relies less on displacing market rivals than on three critical variables: whether second-half operating leverage delivers the projected margin recovery in 2026, how rapidly Chinese domestic competition shifts mature-node dynamics, and whether an elevated equity valuation leaves sufficient room for continued long-term compounding.
XI. Key Performance Indicators & Investor Dashboard (2:24 - 2:32)
Most investor dashboards track too many metrics. For VAT Group, three key indicators provide the bulk of operational insight, with remaining metrics serving largely derivative roles.
The Three That Matter
First, order intake and the book-to-bill ratio. This serves as the primary leading indicator for a company whose backlog typically converts into sales within three to four months under normal operating conditions. Chief Executive Urs Gantner described a healthy steady state as three to four months of orders on hand, noting that under a CHF 2 billion annual revenue scenario, that baseline implies a backlog of roughly CHF 500 million to CHF 600 million; during an operational ramp, backlog expands further, reaching CHF 648 million at the end of June 2026.43 The book-to-bill ratio provides greater analytical value than absolute order figures: sustained readings above 1.0 indicate an expanding backlog, while readings below 1.0 signal order consumption. Throughout 2025, the book-to-bill ratio remained below 1.0 for the first three quarters before crossing above 1.0 in the fourth quarter, an inflection that preceded the 2026 demand surge by roughly two quarters.1 During the July 2026 earnings call, Gantner explicitly noted that while he did not expect the record quarter-on-quarter growth rate to continue, he anticipated third-quarter order intake to stabilize around CHF 500 million.4 A sequential moderation from record growth rates does not signal operational weakening, whereas a drop in the book-to-bill ratio below 1.0 would indicate contracting forward demand.
Second, group EBITDA margin evaluated against the 30% to 37% target band. This metric measures operational execution, and 2026 provides a clear test of management's cost flexibility. On July 22, 2026, management projected full-year EBITDA margin would fall into the upper half of the lower half of the target corridor, driven by a second-half EBITDA margin reaching the upper half of the upper half, supported by expected second-half revenue growth exceeding 50%.4 If expanding revenue generates expected operating leverage, the flexible-cost model will demonstrate its efficacy during an industry upturn just as it did during the 2023 downturn. Conversely, if EBITDA margins remain near 29% despite a 50% top-line expansion, production ramp costs would exceed management projections, raising structural questions regarding long-term margin targets.
Third, specification wins. Disclosed annually with a mid-year update, specification wins represent the primary forward indicator of competitive strength. These wins measure how frequently VAT secures design-in positions on next-generation customer platforms, a process that spans 18 to 24 months from initial engineering engagement to pre-series prototype and converts into commercial revenue three to five years later.1 Specification wins expanded from 95 in 2019 to 99 in 2022 and 150 in 2025, with approximately half tied to leading-edge applications; by segment, 2025 wins were distributed roughly 50% to semiconductors, 25% to Advanced Industrials, and 25% to Global Service.1 In the first half of 2026, the company recorded 60 specification wins.4 Unlike backward-looking market share data, specification wins reflect future platform positions across upcoming process nodes. Product adjacencies — including gas inlet valves, motion components, and advanced modules — accounted for roughly 18% of specification wins and 9% of group sales in 2025, with management targeting adjacency revenue contributions of 15% by 2027 and 20% by 2029.1 The conversion of adjacency design wins into commercial shipments provides a direct test of the company's wallet-share expansion strategy.
Secondary Gauges
Three secondary metrics warrant ongoing evaluation. Free cash flow conversion — guided at 60% to 70% of EBITDA and recorded at 72% in 2025 — monitors working capital discipline during demand expansions; the metric dropped to 28% in the first half of 2026 due to inventory accumulation ahead of production ramps.13 Return on invested capital, targeted above 45% but running in the mid-thirties, tracks whether capital expenditure yields target returns.19 Finally, the manufacturing share in best-cost countries serves as an indicator of structural foreign exchange mitigation; because VAT does not publish an explicit percentage, capacity utilization rates across regional production sites provide the operational proxy.4
What to Ignore
By contrast, quarterly revenue performance relative to short-term guidance offers limited analytical value for long-term valuation. VAT's quarterly top line frequently fluctuates based on shipment schedules and supply logistics rather than structural franchise strength: first-quarter 2026 revenue missed expectations due to external transit disruptions, whereas second-quarter sales reached CHF 291 million within the guided range of CHF 265 million to CHF 295 million.143 Because quarterly revenue reflects delivery timing, long-term operational health is better evaluated through order intake, EBITDA margins, and specification wins.
XII. Epilogue & Playbook Lessons (2:32 - 2:40)
Sixty-One Years On
Sixty-one years after Siegfried Schertler began manufacturing vacuum valves for physics laboratories in an alpine valley, VAT Group's components are integrated into nearly every advanced semiconductor tool platform globally. The company employs roughly 3,900 people and carries a public market valuation near CHF 18 billion.[^5] Schertler's descendants sold controlling interest in 2014 to private equity investors who preserved the Swiss research hub while expanding manufacturing across Asia. Four broader operational lessons emerge from that evolution.
Four Lessons
Find the asymmetric component. Strong competitive positions in industrial supply chains rarely reside in high-cost primary systems. They form around lower-cost components whose operational failure causes catastrophic downtime. Vacuum valves account for a small single-digit percentage of total tool cost but carry outsized operational risk. That economic asymmetry establishes formidable switching costs once a component is qualified. Evaluating this pattern requires comparing component cost against downtime risk: when those two figures differ by several orders of magnitude, the qualified incumbent maintains structural pricing power and high customer retention.
Co-engineering is the moat, not the product. Technical specifications alone do not protect market leadership. VAT's primary advantage stems from embedded engineering relationships during the early design phase of next-generation tool platforms. The specification-win cycle — requiring 18 to 24 months of joint development followed by three to five years before converting into commercial revenue — means platform design wins secured today determine competitive positioning at the end of the decade.1 Competitors cannot bypass this qualification timeline through price discounting alone, as design-in positions must be earned through multi-year technical qualification.
Design the cost structure for the trough to preserve operational flexibility. The 2023 industry downturn demonstrated the strategic value of cost flexibility: despite a 43% drop in orders and a 23% decline in net sales, VAT maintained a full-year EBITDA margin of 30.6% and reached 32.1% in the second half.5 That margin resilience enabled management to expand research spending and complete three major capital expansion projects during a cyclical trough, ensuring manufacturing capacity was fully operational when demand accelerated in 2026.51 Peers burdened with heavy debt service during the same downturn lacked the balance sheet flexibility to fund counter-cyclical investments.
Maintain capital discipline while recognizing its trade-offs. VAT has avoided large, transformative acquisitions throughout its public history. The agreement to acquire Atonarp for roughly 0.6% of market capitalization represents a targeted technology capability purchase rather than a large-scale corporate combination.154 Maintaining a conservative balance sheet preserved operational flexibility through industry cycles, contrasting with peers that incurred substantial debt at peak valuations and subsequently directed cash flow toward debt reduction.16 However, distributing up to 100% of free cash flow to shareholders leaves the company reliant on external borrowing for strategic acquisitions, creating potential financial rigidity if capital allocation priorities require rapid adjustments.9
No Longer Hidden
Characterizing VAT Group as a quiet, family-built "hidden champion" overlooks its modern corporate structure. The company operates as a widely held public corporation with a free float of approximately 90%, active institutional coverage evaluating margin performance and pricing power, and a stock price that traded across a nearly threefold valuation range over twelve months driven by fluctuating market sentiment around artificial intelligence capital expenditure.12[^5]
The underlying operating model remains centered on core precision engineering. VAT maintains its market position by securing early design-in specifications and delivering component reliability that prevents fab downtime. Over the next five years, the central strategic test lies in operational execution and geopolitical management: converting a record order backlog into shipped revenue and expanding operating margins as promised, while navigating regional supply chain localization in China. For equity investors, translating competitive durability into long-term investment returns depends directly on management's ability to execute against those operational and geopolitical demands at current valuation multiples.
References
-
Full-year 2025 results presentation — VAT Group AG, 2026-03-03 ↩↩↩↩↩↩↩↩↩↩↩↩↩↩↩↩↩↩↩↩↩↩↩↩↩↩↩↩↩↩↩↩↩↩↩↩↩↩↩↩↩↩↩↩↩↩↩↩↩↩↩↩↩↩↩↩↩↩↩↩↩↩↩
-
VAT Media Release on Full-Year 2025 Results — VAT Group AG, 2026-03-03 ↩↩↩↩↩↩
-
VAT Media Release on Half-year 2026 Results — VAT Group AG / EQS News, 2026-07-22 ↩↩↩↩↩↩↩↩↩↩↩↩↩↩↩
-
Earnings call transcript: VAT Group H1 2026 results and Atonarp acquisition — Investing.com, 2026-07-22 ↩↩↩↩↩↩↩↩↩↩↩↩↩↩↩↩↩↩↩↩↩↩↩↩↩↩↩↩↩↩↩↩↩↩↩↩↩↩↩↩↩↩↩↩
-
VAT Media Release on Full-Year 2023 Results — VAT Group AG, 2024-03-05 ↩↩↩↩↩↩↩↩↩
-
VAT Holding AG, the global market leader in high-end vacuum valves, to be acquired by Capvis and Partners Group — Partners Group, 2013-12-06 ↩↩↩↩↩↩↩↩↩↩
-
VAT Group AG prices its IPO at CHF 45 per share and lists on SIX Swiss Exchange — VAT Group AG, 2016-04-13 ↩↩↩
-
VAT Media Release on Capital Markets Day 2022 — VAT Group AG, 2022 ↩↩↩
-
VAT Capital Markets Day 2025 — VAT Group AG / EQS News, 2025-05-20 ↩↩↩↩↩↩↩↩↩
-
Corporate Governance Report, Annual Report 2024 — VAT Group AG, 2025 ↩↩↩
-
Compensation Report, Annual Report 2024 — VAT Group AG, 2025 ↩↩↩↩
-
VAT Media Release on Q1 2026 Trading Update — VAT Group AG, 2026-04-16 ↩↩↩
-
VAT Media Release on Acquisition of Atonarp — VAT Group AG, 2026-07-22 ↩↩↩↩
-
MKS Instruments to Acquire Atotech — Atotech, 2021-07-01 ↩↩↩
-
VAT H1 2026 slides: record orders meet margin pressure in AI ramp — Investing.com, 2026-07-22 ↩
 LinkedIn
 WhatsApp
 Reddit
 Hacker News
 Email
Email Kindle
 RSS Feed
 Spotify
 Apple Podcasts
 Amazon Music
 Audible
 YouTube