United Utilities: The Engineering, Economics, and Politics of the North West Water Monopoly
I. Introduction & Episode Roadmap
Somewhere beneath a Lancashire field, inside a tunnel bored by workers using carbide lamps, water flows. It has moved continuously since the 1950s, leaving a reservoir in the eastern fells of the Lake District and arriving in Greater Manchester—about 110 kilometres away—without passing through a single pump. The entire system relies on gravity: an input no regulator can tax and no supplier can mark up. On a normal day, it delivers around 570 million litres—roughly 250 Olympic swimming pools—to about 2.5 million people, representing nearly 5% of England's population.1
It is a striking piece of Victorian-descended engineering, but by 2026, it is also a liability. The Haweswater Aqueduct is 70 years old and approaching the end of its serviceable life. United Utilities has committed to a roughly £3 billion programme to replace six of its tunnel sections—financed and built not by the company itself but by an outside consortium, under a procurement model the water regulator created specifically because it did not trust water companies to deliver megaprojects on their own balance sheets.1
That single asset serves as a metaphor for the entire business. United Utilities Group PLC (UU.L, London Stock Exchange) is the UK's largest listed water and wastewater company, supplying about 1.8 billion litres of drinking water a day through 88 water treatment works, and collecting sewage from roughly three million homes and 200,000 businesses through 77,000 kilometres of sewers feeding 569 wastewater treatment works, spanning from Carlisle in the north to Crewe in the south.2 It is a legal monopoly; regional customers cannot switch suppliers, and demand is virtually inelastic. Yet over the past five years, privatised water has become one of the most publicly criticized business models in Britain.
Here is the central paradox. The privatised English water framework, established in 1989, was designed as a self-sustaining system: private capital would modernize Victorian infrastructure, a regulator would set prices every five years, and shareholders would earn a modest, inflation-protected return on a growing asset base. For decades, the model functioned largely as intended for investors.
Then monitoring arrived. Event duration monitors on storm overflows began generating spill data, which quickly spread to news outlets and environmental groups, transforming a technical debate over combined sewer design into a national political issue. One of the ten original privatised regional companies, Thames Water, is negotiating a creditor-led recapitalisation involving a proposed 30% write-down of its senior debt, with the government's special administration regime standing as the alternative.3 Meanwhile, the sector regulator, Ofwat, is itself scheduled for abolition.4
United Utilities has navigated this storm as the sector's relative anchor: carrying the lowest gearing among peers, holding investment-grade credit ratings across all major agencies, and moving early on the 2025–2030 investment cycle. Yet on 30 April 2026, the company took an action that requires close examination. Reversing over a year of explicit management assurances to shareholders, it raised £800 million in new equity.5
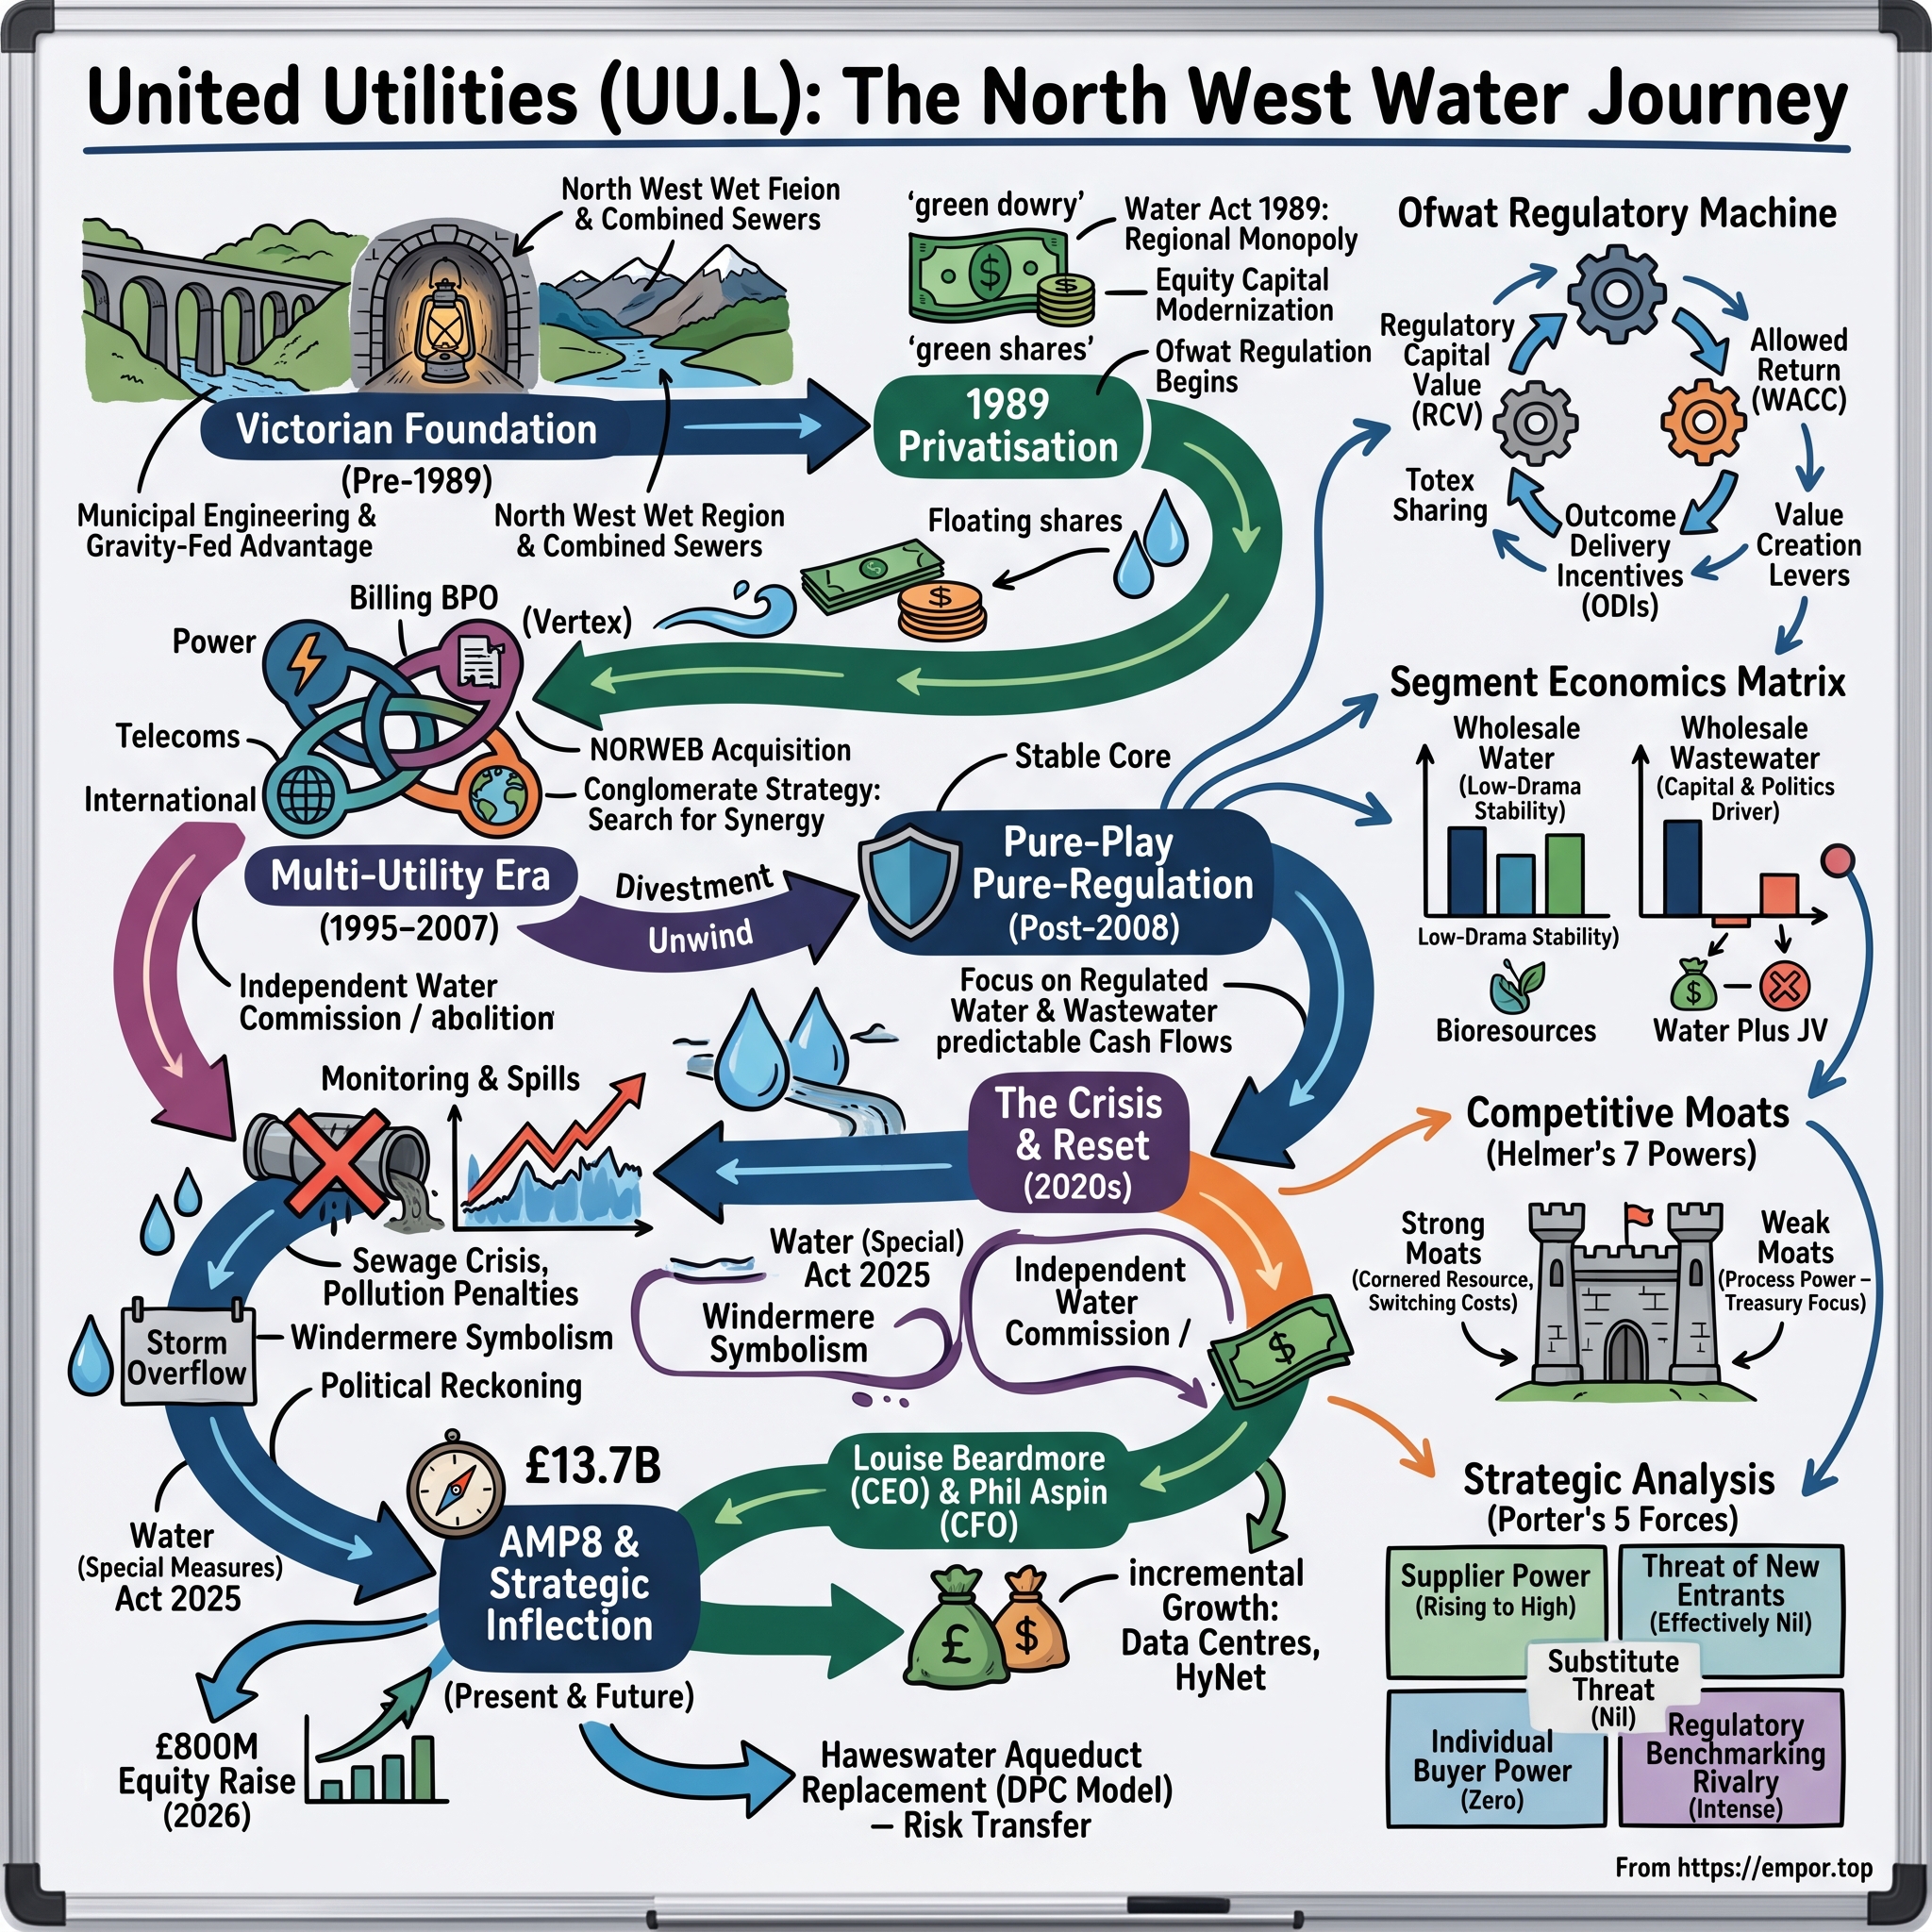
What this episode covers. The Victorian water engineering that gave North West England a structural cost advantage, and the 1989 Thatcher privatisation that converted that infrastructure into equity. The multi-utility strategy of 1995–2007, when the company acquired an electricity network, a call-centre outsourcer, and a telecommunications firm before eventually divesting all three.
The underlying mechanics of the Ofwat regulatory model—regulatory capital value, allowed returns, totex sharing, and outcome delivery incentives—explained clearly, as understanding them is essential to valuing the company. The segment economics, including the frequently over-hyped bioresources division and the loss-making retail joint venture. The sewage crisis and the political reckoning that followed. Chief Executive Louise Beardmore's leadership and the capital-allocation decisions of the past 18 months. Finally, a strategic assessment applying Hamilton Helmer's 7 Powers and Porter's Five Forces to a business with a complete legal monopoly but virtually no pricing power, paired with a bull-versus-bear analysis that tests management's key claims against empirical criteria.
The story begins with the water itself, where local geology dictates much of the underlying economics.
 Subscribe on LinkedIn
II. From Victorian Engineering to Privatisation: Water in the North West
Manchester in the 1840s was one of the most consequential cities on earth and among the least sanitary. Cotton, steam, and immigration generated a population density the built environment could not support. Cholera arrived through contaminated water, prompting a municipal response that was replicated across the industrial North: looking upward and northward to the high-rainfall uplands of the Pennines and Lake District, city leaders resolved that if clean water would not come to the city, the city must go get it.
What followed was a half-century of municipal engineering on a scale that would be politically unthinkable today. Manchester Corporation dammed and tapped Lake Thirlmere in the Lake District and drove an aqueduct south. Liverpool reached into mid-Wales for Lake Vyrnwy. In the twentieth century, Haweswater followed, its aqueduct constructed between 1933 and 1955 to carry Cumbrian water into Lancashire and Greater Manchester.6 Today, United Utilities still operates over 1,400 kilometres of raw-water aqueducts and owns more than 56,000 hectares of catchment land, with Haweswater alone holding over 84 billion litres.2
Why the topography matters to an investor. Water is heavy. Moving it is energy-intensive, and pumping represents one of the largest single operating costs on a water utility's balance sheet. A utility whose raw water sits hundreds of metres above its customers and moves via gravity enjoys a permanently lower operating cost per litre than one reliant on pumping from lowland rivers or deep aquifers—the prevailing setup across much of the drier, flatter east and south-east of England. This represents a genuine, physical, and non-replicable cost advantage.
Crucially, this operational efficiency is largely competed away at the retail level: sector regulator Ofwat benchmarks companies against peers and claws back structural advantages through cost allowances. Consequently, the edge manifests less as excess profit and more as operational resilience—a cost base insulated from power price volatility. That resilience proved vital during the 2022 energy shock and remains relevant, with management maintaining an energy hedging programme fully covered for summer 2026 and over 90% hedged for the following winter.7
The same geography produced the company's chief structural liability. The North West is England's wettest major region, and its cities were fitted during the Victorian era with combined sewers—single pipes carrying both foul sewage and rainwater runoff. While sensible in the nineteenth century, combined systems represent a modern operational trap. Chief Executive Louise Beardmore noted to analysts that 84% of Merseyside's wastewater system is combined, positioned on a west-facing coast that absorbs the full force of Atlantic storms.7 That structural feature accounts for much of the storm overflow challenge detailed in Section VI.
The state-ownership interlude. The Water Act 1973 consolidated a patchwork of municipal undertakings into ten regional water authorities organized around river basins, with the North West Water Authority inheriting the Manchester and Liverpool legacy. The primary flaw of the public-ownership era was not operational incompetence but capital competition: water and sewerage infrastructure spending competed within the Treasury against healthcare, education, and defence, consistently losing out. Sewers rarely win votes until they fail. By the late 1980s, the UK faced European environmental directives on bathing water and urban wastewater treatment that it could not realistically finance from public budgets.
The 1989 settlement. The Water Act 1989 privatised the ten regional authorities in England and Wales. The underlying financial architecture remains vital for investors to understand, as it established the framework for modern sector regulation. Private investors paid roughly £7.6 billion for the ten companies, while the government wrote off approximately £5 billion in authority debt and injected about £1.5 billion in cash—the "green dowry"—specifically to fund environmental catch-up investment.8 Contemporary reporting noted bluntly that the sell-off was proving expensive for taxpayers.9 The companies floated with clean balance sheets, defined asset bases, and an independent economic regulator empowered to set prices in five-year cycles.
Two outcomes unfolded simultaneously, triggering a debate that has persisted for nearly four decades. Capital flowed into the sector: England's water and wastewater infrastructure was substantially modernized after 1989 on a scale public ownership had failed to deliver. At the same time, essential regional monopolies were handed to equity investors with debt-free starting balance sheets and inflation-indexed returns—creating an exceptionally attractive risk-adjusted model for long-term capital.
North West Water Group plc listed in London as one of the ten original regional authorities. Within six years, however, management decided that operating a regional water utility was not, on its own, sufficiently ambitious.
III. The Multi-Utility Conglomerate Era & The Return to Pure-Play
The mid-1990s marked an ambitious period for British privatised utilities. Privatisation had created a dozen electricity distributors, ten water companies, and several gas and telecommunications entities. All were newly listed, highly cash-generative, and led by former public servants facing pressure from City investors to demonstrate corporate strategy. The defining concept of the era was the multi-utility: a single company offering water, electricity, gas, and telephony on one bill, serviced by one call centre and one maintenance crew digging up the street. It was corporate synergy in its idealised presentation.
In September 1995, North West Water launched a bid for NORWEB, the regional electricity company covering the same geography, completing the acquisition in October for approximately £1.83 billion.10 Britain's first cross-utility merger combined roughly 2.8 million water customer premises with 1.9 million electricity customer premises.10 Although trade unions requested a referral to the Monopolies and Mergers Commission over anticipated job cuts, the transaction proceeded.11 The combined entity rebranded as United Utilities plc—a name intended to signify a multi-utility category rather than a single service.
Why the logic was weaker than it looked. The operational synergies—shared billing systems, unified contact centres, and coordinated street works—were minor relative to the cost drivers that determine network utility economics: capital deployment and the cost of capital. On these critical dimensions, water supply and electricity distribution shared little operational overlap. They operated under separate regulators, distinct price-control cycles, differing asset lifespans, contrasting failure modes, and separate political constituencies. Merging them into a holding structure yielded no reduction in debt costs; instead, it introduced credit complexity. Debt investors in regulated utilities value clarity—a defined asset base, an explicit revenue formula, and a ring-fenced operating licence. Added complexity reduced clarity rather than creating value.
The diversification kept going anyway. Through the late 1990s and early 2000s, the company expanded into non-regulated commercial ventures. It created Vertex, a business process outsourcing unit providing billing and contact-centre operations to third parties, including local authorities. It operated a telecommunications infrastructure unit, Your Communications. It also acquired international water and electricity concessions, including a stake in an Argentine electricity distributor—a transaction with lasting legal friction, as United Utilities International remained a defendant in an Argentine multiparty claim concerning a defaulted US$230 million bond issued by that project company more than two decades after the initial investment.12
The pattern was a familiar conglomerate expansion. A stable, regulated core generated predictable cash flows, which management deployed into adjacent, non-monopoly markets. None of the expanded ventures possessed the core protections of the water monopoly: a guaranteed regional catchment and an inflation-indexed asset base. Vertex competed directly with established outsourcing firms such as Capita and Accenture; Your Communications faced BT; and international concessions exposed the group to sovereign risk.
The unwind, 2006–2007. Under shareholder pressure and a strategic review of core operations, United Utilities dismantled its conglomerate structure over eighteen months. It divested Your Communications in February 2006.
In January 2007, the board agreed to sell Vertex to a private equity consortium led by Oak Hill Capital, along with GenNx360 and Knox Lawrence International, for £217.5 million.13 The board stated that the transaction would allow the group to focus on its primary capability of managing water, wastewater, electricity, and gas networks.14 That operational focus narrowed further later that year: in December 2007, United Utilities sold its electricity distribution business—the former NORWEB network—to a consortium advised by Colonial First State Global Asset Management and J.P. Morgan Asset Management, which became Electricity North West.15
The investor lesson, stated plainly. Regulated utilities face a structural conglomerate discount when expanding beyond their core asset base.
The equity valuation of a regulated utility rests not on unconstrained growth, but on the predictability of a regulatory returns model. Unregulated earnings with volatile cash flows, potential cross-subsidisation concerns, or complex corporate holding structures increase forecasting uncertainty. That opacity depresses equity valuation multiples and widens debt spreads. Capital markets reward simplicity in regulated utilities. After a twelve-year diversification cycle, United Utilities divested its non-core assets to re-emerge in 2008 as a pure-play regional water and wastewater monopoly whose economic returns are governed by five-year regulatory determination cycles.
Understanding the company requires examining the mechanics of that regulatory negotiation.
IV. The Mechanics of the Ofwat Regulatory Machine
The economic mechanics of the UK water sector resemble a regulated monopoly toll road. Every five years, the regulator establishes three baseline parameters: an agreed asset valuation, an allowed percentage return on that asset base, and an inflation adjustment mechanism that increases the valuation annually while adding approved capital investments to the asset base to earn future returns.
This agreed baseline is the Regulatory Capital Value (RCV); as of 31 March 2026, United Utilities Water's adjusted RCV stood at £16.5 billion, up 7.5% year on year.16 The allowed percentage return is the weighted average cost of capital, which Ofwat set at a real rate of 4.03% (CPIH-stripped) for the 2025–2030 period, up from 2.96% in the previous cycle.17 Because the 4.03% figure represents a real return and the underlying RCV accretes with CPIH inflation, a 3% inflation environment yields a nominal return on the asset base of roughly 7% before accounting for operational or financial outperformance.
Where the value actually gets created. Value creation relies on three main mechanisms.
Lever one: grow the asset base. Every pound of qualifying capital expenditure approved by Ofwat enters the RCV, earning the allowed regulatory return for decades. Consequently, a water company's capital investment programme functions not as an operational cost to minimize, but as the primary engine of long-term asset growth. Ofwat's determination for United Utilities allowed £13.3 billion of gross total expenditure across 2025–2030 (£12.7 billion net of grants and contributions), comprising £7.4 billion in base maintenance spending and £5.9 billion in enhancement for new capabilities and regulatory compliance.17 That enhancement outlay drives asset expansion, with the company's environmental programme for this period set at 5.7 times the size of the previous cycle.17
Lever two: spend less than the allowance, or issue debt cheaper than assumed. Ofwat establishes a total expenditure (totex) allowance under a sharing mechanism: if a utility outperforms base cost allowances, it retains half the savings while customers receive the other half, whereas customers receive 60% of savings on most enhancement spending.17 Separately, Ofwat sets a sector-wide benchmark cost of debt; borrowing below this rate generates direct equity outperformance.
Financing outperformance represents a primary operational strength for United Utilities. In the year to 31 March 2026, the company generated 3.1 percentage points of financing outperformance on its regulatory return, and management stated that term debt raised thus far in the cycle beat Ofwat's debt indexation mechanism by approximately 80 basis points—a yield advantage that persists over the lifespan of each instrument.16 The group raised approximately £1.0 billion in term funding during the year—comprising a €500 million ten-year green bond in August, taps of existing euro bonds, and a £300 million fourteen-year sterling bond in December—at an average effective interest rate of 4.2%.16
Lever three: hit the performance targets. Outcome Delivery Incentives (ODIs) link operational metrics directly to financial returns. Parameters such as leakage, pollution incidents, supply interruptions, sewer flooding, and customer service scores each carry specific targets, yielding financial rewards for outperformance and penalties for shortfalls. For 2025–2030, Ofwat's incentive framework for United Utilities spans a potential range from a maximum reward of £585 million to a maximum penalty of £716 million over five years.17 At either limit, the impact is roughly equivalent to a full year of operating profit. Because incentive rewards and penalties affect revenues with a two-year lag, operational outcomes in 2025/26 translate into revenue adjustments in 2027/28.16
Examining the sources of outperformance. While United Utilities highlights a "strong track record of outperformance," its operational history shows mixed results across categories. On ODIs, the record is solid: the company secured cumulative net ODI rewards of £44 million during 2015–2020 and £129 million during 2020–2025, meeting or beating roughly 80% of its performance commitments.17 However, an analysis of total return sources during the 2020–2025 cycle tells a nuanced story. Although return on regulated equity reached 6.1% against a 4.0% regulatory baseline, financing performance contributed 2.8 percentage points and tax performance added 1.4 percentage points, whereas totex performance subtracted 2.2 percentage points.18 In the final year of that cycle alone, totex performance reached negative 6.9%.18
This breakdown clarifies the company's financial model. United Utilities did not generate its outperformance in the previous regulatory cycle through superior cost control or cheaper capital execution relative to regulator allowances; rather, it exceeded its expenditure allowances and offset those overruns through treasury management and tax positioning.
While effective balance sheet execution and an 80-basis-point debt advantage reflect financial competency, this represents a financial edge rather than an operational one. Consequently, these returns remain exposed to interest rate movements and periodic regulatory resets of benchmark debt costs. Management acknowledged these constraints during a November 2025 earnings call: when asked whether alternative cost modeling from the Competition and Markets Authority (CMA) implied room for cost outperformance, Chief Financial Officer Phil Aspin stated that the company remained focused on operating within its assigned totex envelopes and did not "particularly see huge scope to outperform."7
The balance sheet. Gearing—measured as group net debt relative to RCV—stood at 60% as of 31 March 2026, positioning the company in the middle of its target band of 55% to 65% on net debt of £9.94 billion.16 United Utilities Water maintains investment-grade credit ratings for its senior unsecured debt, rated Baa1 by Moody's, A- by Fitch, and BBB+ by S&P, all with stable outlooks.16
Approximately 32% of net debt is RPI-linked at an average real rate of 1.5%, while an additional 14% is CPI- or CPIH-linked at an average real rate of minus 0.6%. This structure acts as a hedge against inflation indexation of the asset base, as rising inflation increases debt principal alongside RCV growth.16 The portfolio features an average debt maturity of roughly fourteen years, with management indicating plans to reduce the index-linked portion of net debt from approximately half to about one-third over the current cycle.16
This financial standing contrasts sharply with distressed peers such as Thames Water, whose senior gearing reached 85.9% by 30 September 2025 alongside declining liquidity of £0.9 billion, prompting creditor proposals for a complete write-off of Class B debt, subordinated debt, and existing equity.3 While management frequently highlights this contrast to underscore relative balance-sheet stability, such comparisons demonstrate solvency and capital resilience rather than superior equity return potential.
While the mechanics of the regulatory framework are structured and predictable, its financial results across specific operating segments present a more complex picture.
V. Segment Economics & The Portfolio Matrix
When a company operates several named divisions, investors may be tempted to analyze them as a portfolio of independent assets. That approach is misleading here. United Utilities is fundamentally a regulated water and wastewater business with two small peripheral operations, and an objective accounting reveals that virtually all of its economic value resides within the wholesale price controls.
Wholesale water: the low-drama half. Water resources and the primary water network together carry a total expenditure allowance of about £4.4 billion for 2025–2030—comprising £696 million for abstraction and raw water, and £3.69 billion for the treatment and distribution network.17
This segment represents the core operating stability of the business. Per capita demand is stable to slightly declining as metering expands across the region; the company installed more than 200,000 smart meters in the year to March 2026 as the first phase of a rollout designed primarily for leak detection and demand management rather than billing upgrades.16 The underlying assets are exceptionally long-lived. The Regulatory Capital Value (RCV) run-off rate—effectively regulatory depreciation—is approximately 5.2% annually for the water network and just 2.7% for water resources, allowing reservoirs and aqueducts to be written down over generations.17
The leakage paradox. The operational focus in the year to March 2026 centered on leakage, providing a clear case study in how regulatory metrics can diverge from underlying performance. The company replaced over 150 kilometres of water mains—exceeding its combined total for the prior five years—and recorded its lowest single-year leakage level in the North West. Yet management still expects to miss its regulatory target because Ofwat calculates compliance on a three-year rolling average that has not fully absorbed the recent gains.16 While both facts are accurate, investors must track the rolling metric because it determines financial penalties, even as the operational trend moves in a positive direction.
Wholesale wastewater: where the capital and the politics live. The wastewater network carries a gross total expenditure allowance of about £7.5 billion for the 2025–2030 period—representing more than half of the company's total investment program—with £4.55 billion dedicated to capital enhancement.17 This segment serves as the central driver of business growth. It also features the lowest annual RCV run-off rate at roughly 3.4%, making wastewater capital deployment the single most powerful driver of asset base expansion: capital is deployed, the asset base expands, and regulatory depreciation releases value over a long horizon.17
Operational metrics in the year to March 2026 showed measurable progress across several key areas. Storm overflow spill activations decreased by 23% and total spill duration dropped by 27%. Internal sewer flooding incidents—where sewage backs up inside a property, consistently cited by customers as the most severe failure mode—fell by 42%, while external sewer flooding declined by 25%.16 However, total pollution incidents will still trigger a financial penalty. Although United Utilities recorded zero Category 1 (most serious) pollution events and achieved year-on-year reductions in Category 2 and Category 3 incidents, updated industry reporting rules expanded to include events previously excluded, such as those triggered by severe weather or external power failures. Consequently, roughly 21% of total 2025 pollution incidents were linked to named storms, with 12% caused by Storm Éowyn alone.16
A note on that methodology argument. Management cites these reporting rule changes frequently, and while the explanation is factually grounded, analysts should evaluate it critically: procedural adjustments are often invoked in regulated sectors to reframe operational shortfalls.
The core test is whether performance is improving on an underlying, methodology-adjusted basis. On storm spills and property flooding, empirical data indicates genuine operational gains. On pollution events caused by pumping station power failures—where Chief Executive Louise Beardmore noted that roughly a third of pollution incidents stem from energy resilience vulnerabilities on overhead power networks in rural Cumbria and Cheshire—the operational reality reflects a persistent exposure that remains largely dependent on third-party electricity grid reliability.7
Bioresources: useful, not a story. In the bioresources segment, sewage sludge is treated and digested to produce agricultural fertilizer or generate renewable energy. The bioresources price control sets a total expenditure allowance of £803 million for 2025–2030 based on an assumed annual volume of approximately 213,000 tonnes, with revenues adjusted for actual output on a two-year lag.17 Anaerobic digestion provides practical operational value by turning a waste stream into an energy input, lowering grid power exposure and supporting emissions targets.
However, its overall financial impact must be placed in context. The £803 million allowance represents only about 6% of the group's five-year expenditure package, and the segment's 8% annual RCV run-off rate—the highest across the business—reflects shorter asset lifespans that require faster replacement cycles.17 Bioresources acts primarily as an operating cost offset rather than an independent driver of equity value.
Furthermore, regulatory and environmental risks are emerging in this area. Ofwat explicitly identified per- and polyfluoroalkyl substances (PFAS)—commonly known as "forever chemicals"—in biosolids as one of four notified items in its regulatory determination, alongside sludge spreading, major Windermere projects, and cybersecurity, acknowledging that potential compliance costs fall outside baseline allowances and may require future price adjustments.17 Beardmore informed analysts that PFAS contamination affects both drinking water and biosolids, noting that the ultimate financial liability remains difficult to quantify.7
Water Plus: a joint venture that loses money. Following the 2017 deregulation of England's non-household water retail market, regional incumbents were required to separate commercial retail operations from wholesale supply. United Utilities transferred its commercial customer base into Water Plus, a 50/50 joint venture with Severn Trent. The entity has consistently underperformed on earnings: United Utilities recorded an £11 million share of losses in the year to March 2025—primarily caused by a data cleansing exercise that increased bad debt provisions on receivables18—followed by an additional £4.6 million loss in the year to March 2026.16
Management contends that the venture safeguards the wholesale revenue stream, as commercial retailers handle billing and collection while remitting wholesale charges. While this arrangement mitigates direct counterparty default risk for the wholesaler, Water Plus remains a capital-light, low-margin operation that continues to generate losses. Furthermore, co-funding a loss-making commercial retailer alongside a regional peer introduces strategic ambiguity. Although financial exposure is limited—the group's guarantee obligations to Water Plus wholesalers were capped at £50.7 million16—persistent unprofitability in peripheral operations inevitably invites investor scrutiny.
This accumulated operational and regulatory friction leads directly to the issue that placed the entire sector under intense public and political scrutiny.
VI. The Sewage Crisis, Environmental Scrutiny, and Strategic Inflection
The event that altered the industry's trajectory was not a spill. It was a sensor.
For most of the privatised era, storm overflows—the relief valves that allow a combined sewer to discharge diluted sewage into a river or the sea rather than back up into homes during heavy rainfall—operated in something close to statistical darkness. They were a known, permitted, deliberately engineered feature of a Victorian system. Nobody counted them precisely because nobody possessed the technical capability to do so.
Then event duration monitoring was deployed across the industry, giving every overflow a timestamped record. The resulting figures were striking—hundreds of thousands of discharge events annually across England—and they landed in a country that had recently embraced wild swimming, held deep affection for the Lake District, and was already frustrated with privatised utilities.
Windermere became the symbol. England's largest lake, situated within a UNESCO World Heritage landscape, was receiving discharges from United Utilities assets. The Environment Agency opened an investigation in October 2023 into discharges from the Glebe Road pumping station between 2021 and 2023, examining whether permit conditions were breached and whether the company had failed to notify the regulator of certain discharges.19 As of July 2026, that investigation has not produced a published enforcement outcome.
Separately, Ofwat opened enforcement cases in July 2024 into four additional companies' management of sewage treatment works and networks—including United Utilities—following an analysis of environmental performance and spill data.20 That case also remains open. In a sector where the regulator fined Thames Water nearly £123 million across two investigations, an unresolved enforcement case represents an active financial and regulatory overhang rather than a settled cost.20
The measured record is mixed, and worth stating precisely. In the Environment Agency's Environmental Performance Assessment for 2024, United Utilities recorded two serious pollution incidents and 347 total pollution incidents—equivalent to 45 per 10,000 kilometres of sewer—while self-reporting 90% of incidents, failing numeric permit limits at seven sites, and achieving a 99.4% delivery rate on its Water Industry National Environment Programme (WINEP) obligations along with meeting its supply-demand balance index target.21 Across the entire sector, sewerage assets generated 75 serious incidents and 2,469 total pollution events.21 United Utilities was downgraded to a two-star rating in that assessment—a result Chief Executive Louise Beardmore called disappointing, while noting that the company had accumulated 13 of a possible 16 stars over the assessment period as the second-highest-rated company.7
That is the appropriate framing for an investor: neither the villain of the piece nor exonerated. On the metrics that matter most environmentally, the company sits in the better half of a sector whose better half remains under intense pressure.
The political escalation. The Water (Special Measures) Act 2025 granted Ofwat powers, effective 6 June 2025, to block executive bonuses outright when companies breach standards on customer service, environmental performance, criminal liability, or financial resilience, while introducing individual criminal liability for senior managers—carrying up to five years' imprisonment—where pollution causes significant ecological damage and due diligence failures are demonstrated.22 This represents a structural shift in personal executive risk, and its incentive effect is substantial: an executive facing personal criminal exposure for environmental failure will rationally allocate more capital to prevention than a traditional shareholder-value calculation alone would dictate.
Then came the broader reset. The Independent Water Commission, chaired by former Bank of England deputy governor Jon Cunliffe, reported in July 2025 with 88 recommendations and concluded that the sector required a fundamental overhaul—including the abolition of Ofwat and the creation of a single integrated regulator absorbing the water functions of Ofwat, the Environment Agency, Natural England, and the Drinking Water Inspectorate.4 In January 2026, the government published its response, a white paper titled A new vision for water, to be followed by a transition plan and a Water Reform Bill.4
What that means, and what it does not. The direction of travel is clear: the government chose regulatory reconstruction over balance-sheet nationalisation. Equity is not being repurchased by the state. What is changing is who establishes the rules, how they supervise operations, and—crucially for a five-year price control cycle—when those rules take effect.
On a November 2025 earnings call, analyst Mark Freshney raised the timing question directly: if primary legislation is not completed in 2026 and a new regulator must subsequently be established, will the next price review slip, leaving the sector with a rollover or a two-year extension of a settlement struck at low allowed returns? Beardmore's response was non-committal on timing while firm on principle, stating that the primary requirement was that the growth the company must deliver remains facilitated and remunerated, regardless of cycle length.7 That position represents a pragmatic stance as well as an acknowledgment that the legislative timetable remains outside management's control.
Management anticipated this shifting environment relatively early. Beardmore has publicly advocated for a national social tariff for water, pointing out that water is the only essential utility without universal affordability support comparable to the energy sector's Warm Home Discount. Through a data-sharing partnership with the Department for Work and Pensions, the company proactively transferred 180,000 customers onto discounted tariffs, bringing total supported customers to over 422,000 against a target of one in six households.167 While this initiative serves as reputational protection, it is also the practical mechanism that maintained bad debt at 1.8% of statutory revenue during a year of double-digit bill increases—a metric directly impacting cash flow.16
Myth versus reality
Three widespread narratives about the sector warrant examination against empirical evidence, as each contains partial truths that misdirect investment conclusions if taken at face value.
Myth one: water companies deliberately dump sewage to save money. Reality: storm overflows are a permitted, engineered feature of Victorian combined sewers designed to prevent sewage from backing up into properties during heavy rainfall. The central issue is not the existence of overflows, but decades of under-investment in network separation and expansion, along with alleged failures in specific instances—such as the Windermere pumping station currently under investigation—to adhere to permit conditions and reporting requirements.19 These represent distinct operational and compliance issues requiring targeted remedies, and conflating them leads to flawed policy and inaccurate financial forecasting.
Myth two: the sector was starved of investment so shareholders could be paid. Reality: while applicable to highly leveraged peers across the broader sector, this narrative does not fit United Utilities. The company's gearing has remained within its 55% to 65% target band for two decades without requiring emergency recapitalisation, and management invested over £2 billion above its regulatory allowance between 2010 and 2025 across additional total expenditure, pension deficit repair, and customer support.17 The aggressive financial engineering that precipitated the sector's wider debt crisis remains concentrated in privately held, highly leveraged entities—most notably Thames Water.
Myth three: nationalisation is coming. Reality: after evaluating the sector through the Cunliffe Commission, the government opted to restructure regulation rather than repossess corporate equity.4 The primary risk to shareholders is not state expropriation, but rather a stricter, more interventionist regulatory framework that compresses achievable equity returns while raising required capital outlays—a slower, less dramatic, and far more probable outcome.
The PR24 decision, and its cost. Ofwat published its final determinations on 19 December 2024.23 Five companies—Anglian, Northumbrian, South East, Southern, and Wessex—rejected their determinations and exercised their statutory right to appeal to the Competition and Markets Authority (CMA). United Utilities accepted its determination, alongside Severn Trent, Yorkshire Water, and Thames Water.
Management stated to analysts that its acceptance reflected a holistic evaluation of the package rather than individual line items, noting that appealing to the CMA reopens the entire determination, that the company secured favorable adjustments to total expenditure allowances between the draft and final stages, and that it negotiated company-specific targets for storm overflow spills and internal sewer flooding tailored to the region's rainfall and combined-sewer profile.717
On 26 March 2026, the CMA published final determinations for the five appealing companies, raising the allowed return on the appointed business from 4.03% to 4.20% and granting £463 million in additional revenue—roughly 17% of the appellants' total request.24 The appealing companies also received an alternative cost-modelling methodology that implied higher expenditure allowances than Ofwat had originally granted.
This outcome raises a key strategic question: did accepting the initial determination cost shareholders value? In direct financial terms, missing out on a 17-basis-point increase in allowed return on a £16.5 billion asset base is significant. Conversely, the appealing companies spent fifteen months in regulatory uncertainty without capital planning clarity, whereas United Utilities mobilized over 100 supply-chain partners and initiated capital deployment immediately. Whether securing early operational certainty justified forfeiting 17 basis points of allowed return is a central debate, but management made an explicit choice rather than drifting into a decision. The strategic test for investors is whether early acceptance delivers superior capital execution—a claim that will be tested across the 2025–2030 regulatory cycle.
VII. Modern Management & The £13.7B AMP8 Gamble
On 30 April 2026, Chief Executive Louise Beardmore presented full-year financial results that showed solid operational growth—and simultaneously announced that United Utilities was issuing 60,975,610 new shares at 1,312 pence per share to raise £800 million in equity.5
Fourteen months earlier, in the investor summary that accompanied the accepted price determination, she had written that the company's balance sheet strength and relatively low gearing meant it had "the ability to fund our plans without needing recourse to equity."17 Twelve months earlier, the full-year results statement described the group as "fully equity funded for AMP8."18 Six months earlier, when asked by an analyst on the interim call whether the business remained fully funded and what might alter that view, Chief Financial Officer Phil Aspin highlighted a strong balance sheet with substantial headroom, noting that Moody's Baa1 credit threshold sat at 68% gearing compared with the company's 60%.7
Evaluating this shift requires examining both management's strategic justification and the resulting impact on shareholders.
The defence, which is substantive. The equity issuance was not designed to rescue the original investment programme. The company's strategic update specified that the base plan of approximately £9 billion in capital expenditure was fully funded before the transaction; the £800 million raised covers the equity portion of roughly £2.5 billion in additional investment identified after the regulatory determination.5 The underlying growth drivers were real and externally verifiable: updated local authority housing targets in the North West added an expected 66,000 homes by 2030; government designation of data centres as Critical National Infrastructure, alongside an AI Growth Zone initiative, generated unexpected industrial water demand in Greater Manchester; and HyNet, a major industrial decarbonisation project, was confirmed as a top government priority.5 Beardmore had already flagged 35 data centre connection applications to analysts five months prior to the capital raise.7
From a balance-sheet perspective, issuing equity to fund incremental RCV growth at an accretive regulatory return represents textbook capital allocation for a utility, avoiding the financial strain of pushing gearing toward the 68% rating agency threshold.
The challenge, which is also substantive. Executive statements such as "without needing recourse to equity" and "fully equity funded" were interpreted by shareholders as commitments against dilution, rather than narrow statements about a single expenditure envelope. Issuing roughly 61 million new shares against a prior weighted average of 682 million resulted in equity dilution of approximately 9%.165
The equity placing was executed at 1,312 pence—the closing market price on 29 April 2026—without a discount, representing a strong market endorsement with ATLAS Infrastructure acting as a £400 million cornerstone investor.25 Nevertheless, shareholders who invested based on earlier assurances of no equity dilution experienced immediate dilution. The underlying issue is less about capital deployment efficiency and more about disclosure framing: management could have provided clearer conditionality around its funding stance, particularly after signaling potential growth-driven regulatory re-openers to analysts as early as November 2025.
Who is making these calls. Louise Beardmore became chief executive in March 2023, becoming the first woman to lead the company after more than two decades within the group across both water and electricity operations—most recently serving as customer service and people director.26
That operational background shapes her executive approach. Her management structure emphasizes localized execution, including five county-level delivery plans rather than a single regional framework, a customer service operation based entirely within the North West, and direct advocacy for a national social tariff for water. During analyst briefings, she frequently focuses on granular engineering and operational details, such as sewer gradients, Cumbrian rainfall patterns, and grid loading balances.7 She also serves as a non-executive director of industry body Water UK and retail joint venture Water Plus.26
Phil Aspin has served as chief financial officer since July 2020, following more than thirty years at the company as group controller and group treasurer.26 A chartered accountant and Fellow of the Association of Corporate Treasurers, Aspin previously chaired the rate-regulated activities working group at the European Financial Reporting Advisory Group. His treasury background produced the company's financial structure, including an index-linked debt portfolio, a fourteen-year average debt maturity, and an 80-basis-point borrowing advantage over the regulatory benchmark—factors that enabled financing outperformance to contribute 3.1 percentage points to the regulatory return in the year to March 2026.16
With two long-serving insiders directing the business through the largest capital expansion in its history, the group benefits from deep institutional familiarity with its subterranean asset base. The primary risk remains typical of long-standing insider leadership: potential resistance to challenging established internal assumptions or communication strategies.
Incentives, accountability and a contested pay vote
To evaluate executive priorities, a company's remuneration report often provides clearer signals than its strategic presentation. In July 2026, United Utilities' executive compensation structure generated the most significant shareholder opposition of Beardmore's tenure.
The controversy followed an explicit regulatory intervention. For the 2024/25 financial year, Ofwat exercised its powers under the Water (Special Measures) regime to block Beardmore's £417,000 annual bonus after a December 2024 reservoir incident resulted in severe fish mortality.27 The penalty demonstrated the direct financial consequences introduced by the regulator's enhanced enforcement framework, establishing a clear precedent of regulatory intervention in executive compensation.
For the year to March 2026, following broad operational improvements, Beardmore received an annual bonus of £830,000 alongside long-term incentive awards valued at £712,000.27 Additionally, the board introduced a fixed share allowance worth £435,000 annually, disbursed in two installments with a required two-year holding period.27
The introduction of the share allowance drew substantial investor opposition. At the annual general meeting on 18 July 2026, the remuneration policy passed with 75.8% support, as 24.2% of votes were cast in opposition—a level of proxy dissent that under UK corporate governance standards obliges a board to consult and respond publicly.27 Proxy advisory firm Institutional Shareholder Services had urged shareholders to vote against the measure, contending that fixed share awards insulated executive pay from operational performance "to a degree."27 Management defended the structure by stating that executive remuneration is funded by shareholders rather than customer bills, and argued that competitive compensation is essential to retain leadership during a major capital cycle.27
How an investor should read this. The core investor concern centered not on absolute pay figures—which remain modest relative to broader FTSE 100 benchmarks—but on structural alignment.
A fixed share allowance is inherently less contingent on performance than an annual bonus or long-term incentive plan. Introducing fixed equity pay shortly after Ofwat demonstrated its willingness to claw back variable compensation created the perception of restructuring executive pay to shield it from regulatory oversight. While board members may view guaranteed equity as necessary to recruit and retain talent in an increasingly punitive regulatory environment, nearly a quarter of voting shareholders viewed the shift as diluting accountability in a business where investment returns depend directly on meeting regulated operational targets.
The results themselves, and an accounting judgment that deserves attention. In the year to 31 March 2026, underlying revenue grew 20% to £2,576 million, driven by an allowed real increase of roughly 23% in wholesale revenues during the first year of the PR24 price determination alongside CPIH inflation adjustments. Underlying operating profit rose 35% to £1,060 million, while underlying earnings per share expanded 42% to 107.1 pence.16
A closer examination of the financial notes reveals important accounting context. The underlying earnings per share figure of 107.1 pence reflects a positive 37 pence contribution from a revised capitalization methodology for infrastructure renewals expenditure, as well as a 3 pence benefit from updated estimation techniques for index-linked debt.16 Both accounting adjustments were adopted prospectively from 1 April 2025, with prior-year figures restated on a pro forma basis; the infrastructure capitalization change alone would have increased prior-year operating profit by an estimated £152 million had it been applied retrospectively.16 In cash terms, £249.7 million of infrastructure asset additions were capitalized into property, plant, and equipment rather than expensed as operating costs.16
The accounting treatment was fully disclosed and aligns with regulatory frameworks that categorize infrastructure renewals as capital investments. However, financial analysts must recognize that a substantial portion of reported earnings growth resulted from accounting reclassification rather than underlying operational expansion. Capitalizing renewal expenses increases near-term reported profitability while expanding the asset base for future depreciation, meaning headline earnings growth figures require adjustment for cash-flow modeling.
The core metric for evaluating utility performance remains the return on regulated equity, which reached 13.0% for the year. This comprised a 5.2% base regulatory return, 2.4 percentage points of net outperformance—driven by 3.1 points in financing gains, offset by 0.5 points in ODI penalties, 0.1 points in totex overruns, and 0.2 points in retail losses—alongside 1.7 points from gearing structures and 3.8 points from inflation indexation.16 Management cautioned that financing outperformance was front-loaded in the regulatory cycle, indicating that this level of return should not be projected as an ongoing baseline.16
Capital deployment and the deliverability question. Total capital expenditure reached £1,525 million in the year to March 2026, a 41% increase year-on-year. Operational scaling involved managing over 1,000 active projects, contracting with more than 100 supply chain partners, hiring over 1,300 employees, and achieving a 100% score on the capital programme delivery incentive.16 Capital expenditure guidance for the following year was set at approximately £2 billion.16 Management's updated operational framework targets cycle-average return on regulated equity of 10% to 11%—a 100-basis-point increase over previous guidance—compound annual asset base growth of roughly 10%, dividend growth tied to CPIH inflation from a baseline of 53.66 pence, and gearing maintained within the 55% to 65% target band.516
The central operational challenge facing the group is whether £11.5 billion in total capital expenditure can be effectively deployed over five years amid sector-wide supply chain constraints, as ten regional water monopolies compete simultaneously for specialized contractors, materials, and engineering labor.
Management points to procurement strategy as its primary defense against cost inflation and execution bottlenecks, citing early mobilization prior to the AMP8 cycle and a standardization initiative named Project Blueprint, which utilizes modular designs, bulk purchasing, and advance component procurement to hold cost and quality within allowances.16 Initial execution metrics align with targets, reflected in on-schedule project delivery, expenditure on profile, and full achievement of delivery incentives. However, execution risks remain, as capital outlays are back-loaded into the middle of the regulatory cycle, with total expenditure for wastewater networks expected to peak during 2027/28.17
HARP: risk transfer as strategy. The Haweswater Aqueduct Resilience Programme (HARP) is being executed via Ofwat's Direct Procurement for Customers (DPC) model, marking the first large-scale application of DPC in the UK water sector.1 Cascade Infrastructure Limited—a consortium comprising STRABAG, Equitix, and GLIL Infrastructure—achieved financial close and secured the contract covering financing, design, construction, and 25 years of maintenance, with STRABAG UK directing construction over an estimated nine-year timeline utilizing approximately 1,200 workers at peak.61 The associated financial costs pass directly through United Utilities' revenue framework, with FY27 revenue guidance of £2.7 billion to £2.8 billion incorporating approximately £70 million in HARP pass-through charges.16
The strategic rationale behind the structure is clear: transferring a £3 billion, nine-year tunnelling initiative protects United Utilities' core balance sheet from geological, construction, and contractor insolvency risks during a period when the company is executing an £11.5 billion in-house capital program. Ring-fencing project risks comes at a direct financial cost, as United Utilities forfeits adding the £3 billion asset to its own Regulatory Capital Value, thereby foregoing long-term regulatory returns on that investment. The arrangement demonstrates a deliberate choice to exchange potential asset base expansion for operational risk mitigation.
VIII. Playbook: Business & Investing Lessons
Four transferable lessons emerge from the North West water monopoly's trajectory.
1. Monopoly guarantees demand, not returns. The intuition that a legal monopoly over an essential service guarantees attractive investment returns is incomplete. Demand is assured: every household in the region must consume water, cannot switch providers, and has no practical alternatives. Yet pricing is determined by a regulator whose explicit mandate is to prevent monopoly rents, and the ceiling on returns is political rather than purely economic. Between 2020 and 2025, that ceiling shifted across the sector not because the cost of capital changed, but because public dissatisfaction mounted. A social licence to operate functions as an active operational constraint with a tangible impact on the cost of capital, despite appearing nowhere on a balance sheet.
The implication for investors in any regulated monopoly asset—whether water, rail, airports, or power grids—is that while downside demand protection is robust, upside returns are administratively capped. The core investment evaluation rests on whether investors are adequately compensated for political tail risk.
2. Asset base growth creates value only above the cost of equity. The mechanical attraction of the regulated utility model is that capital expenditure expands the regulatory asset base, which increases allowed revenues and drives headline earnings growth. On paper, it resembles compounding.
In reality, asset expansion creates value only if the return earned on incremental capital exceeds the return required by equity holders. At Ofwat's 4.03% real allowed return baseline, the underlying spread is thin; the investment case depends almost entirely on stacking operational, financing, and incentive outperformance on top. If regulatory penalties, capital overruns, or higher debt refinancing costs erode that margin, spending £11.5 billion simply expands a larger asset base at an inadequate return—destroying equity value while creating the appearance of growth. Consequently, management's target of a 10% to 11% return on regulated equity is a far more critical performance metric than the headline capex total.
3. In an incentive-regulated business, operations are finance. This principle is frequently overlooked by generalist investors. In a framework where missing a leakage benchmark incurs financial penalties and exceeding a sewer-flooding target yields cash rewards—with a cycle-wide swing potential reaching hundreds of millions of pounds—the operational field organization acts as a direct profit driver rather than a simple cost centre. The 42% reduction in internal sewer flooding represents a direct revenue adjustment realized on a two-year lag.16 The secondary effect is that weather events, third-party power disruptions, and regulatory rule changes transmit directly into bottom-line earnings—making the fact that 21% of one year's pollution events were storm-linked a material financial parameter rather than an operational defense.16
4. In a capital super-cycle, procurement is the primary differentiator. When a regulator mandates simultaneous, sector-wide capital expansion, specialized contractors, tunneling firms, and equipment manufacturers become the scarce resource, reversing traditional pricing leverage. United Utilities responded by contracting over 100 supply-chain partners prior to the cycle, standardizing asset designs, purchasing materials in bulk, and securing critical equipment early—a pragmatic strategy that delivered initial execution on schedule and on profile.16
The test for investors is whether this procurement advantage holds when project volumes peak mid-cycle. Across any industry-wide capital expenditure expansion, outperformance accrues to operators that lock in supply capacity before consensus forms, while latecomers face budget overruns and contractor shortages.
IX. Competitive Analysis, Helmer's 7 Powers & Porter's 5 Forces
Applying strategic frameworks to a legal monopoly can easily become an exercise in stating the obvious: an operator with no direct competitors naturally possesses wide competitive moats. The analytical value lies in identifying where these frameworks break down, because those structural failure points are where investment risks reside.
Hamilton Helmer's 7 Powers
Cornered Resource — strong, and the group's most durable power. United Utilities holds the reservoirs, catchment land, aqueducts, treatment assets, and underground pipe networks across an entire region, backed by statutory abstraction licences. Replicating this infrastructure is virtually impossible: no entity could secure planning permission to dam a Lake District valley or bore a new 110-kilometre tunnel beneath Lancashire on a commercially viable timeline. Furthermore, the region's gravity-fed topography provides a physical cost advantage that no competitor could match even if granted entry. This power remains effectively absolute and permanent.
Scale Economies — strong in operational cost structure, weak in equity returns. Serving seven million customers across an extensive fixed asset base generates genuine unit-cost efficiencies. However, Ofwat's comparative efficiency model is designed to measure and reclaim these scale advantages, returning them to billpayers through baseline cost allowances. Consequently, scale serves primarily to mitigate operational underperformance risks rather than drive superior equity returns.
Switching Costs — total for household customers, yet economically muted. Household customers cannot switch water suppliers, ensuring complete regional revenue capture. However, this captivity confers zero pricing power, as revenue is determined entirely by the regulator. In Helmer's framework, switching costs generate power by allowing a firm to raise prices without losing customers; here, pricing is fixed externally. Customer captivity yields volume predictability rather than pricing power, which in turn enables access to long-dated, low-cost debt—the primary mechanism through which this advantage creates financial value.
Process Power — moderate, with operational capabilities trailing financial execution. Decades of accumulated expertise in leak detection, network routing, and sludge treatment represent genuine operational capabilities, reinforced by standardized engineering initiatives such as Project Blueprint. However, true process power should manifest as sustained cost outperformance, which the historical record does not demonstrate: total expenditure overruns subtracted 2.2 percentage points from regulatory returns during the 2020–2025 cycle, and management has explicitly guided against expecting material total expenditure outperformance in the current cycle.187 The company's clearest process advantage resides in treasury management, where its sustained borrowing advantage of approximately 80 basis points over the regulatory debt index represents a repeatable financial edge.16
Counter-Positioning, Branding, Network Economies — absent. The business operates without a direct incumbent to counter-position against, and its network exhibits no user-side network effects. Regarding brand, the company maintains strong operational service scores—including a 4.5 Trustpilot rating, above-median scores across all three regulatory customer experience benchmarks, 90% employee engagement, and a 4.6 Glassdoor rating16—yet brand strength in Helmer's sense implies pricing power, which a regulated monopoly cannot exercise. Public reputation remains heavily influenced by broader environmental coverage, over which management maintains limited control.
Porter's Five Forces
Threat of new entrants: effectively nil. Statutory operating licences, physical land rights, massive capital intensity, and planning constraints combine to create an insurmountable entry barrier.
Threat of substitutes: nil. No scalable substitute exists for municipal piped water and sanitation. Bottled water serves a distinct niche and cannot replace grid infrastructure.
Bargaining power of buyers: zero individually, overwhelming via regulatory proxy. This force fundamentally governs the business. While individual billpayers possess no bargaining leverage, Ofwat acts as a monopsonistic proxy buyer that dictates allowed revenues, cost allowances, performance targets, and regulatory returns on capital. Furthermore, the regulator's leverage is reinforced by political authorities that have established executive criminal liability and proposed replacing Ofwat with a consolidated regulatory body. The effective buyer is the state, whose policy priorities have grown increasingly demanding.
Bargaining power of suppliers: moderate, rising to high. Because all regional water companies are executing major capital programs simultaneously under identical regulatory deadlines, specialized civil engineering firms, tunneling contractors, and equipment manufacturers retain significant pricing power. Early framework agreements and advance procurement mitigate this pressure but cannot fully eliminate it, as multi-year contracts remain subject to inflation indexation and variation clauses.
Competitive rivalry: absent locally, intense via regulatory benchmarking. While United Utilities faces no direct market competition for regional customers, it operates under intense regulatory rivalry. Ofwat utilizes comparative models that benchmark operators against an industry efficiency frontier. Consequently, cost efficiencies achieved by peers like Severn Trent raise performance targets for United Utilities, while operational distress at Thames Water alters sector-wide risk perceptions and impacts overall capital costs. This represents rigorous competition driven by regulatory benchmarking rather than customer acquisition.
The peer comparison. Compared with Severn Trent, United Utilities exhibits similar balance sheet strength and regulatory standing, while operating in a wetter geography that provides cheaper raw water alongside greater combined-sewer spill exposures. Compared with Pennon, United Utilities operates on a substantially larger scale with greater capital resilience. Compared with Thames Water, the contrast reflects two distinct financial models: Thames Water represents a debt-restructuring case whose resolution will establish precedents for equity risk across the UK water sector, directly influencing capital costs for all regional operators. Finally, compared with the five peers that appealed their price determinations to the Competition and Markets Authority, United Utilities surrendered 17 basis points of allowed regulatory return in exchange for fifteen months of operational and planning certainty.24
X. Financial Spine, KPIs, Risk Radar & Bear vs. Bull Case
The KPIs that actually matter
Three, and only three. Everything else is either derived from these or noise.
1. Regulatory return (return on regulatory equity). This is the master metric because it captures base return, every source of outperformance, actual gearing and inflation in one number, and because it is defined by Ofwat's own annual performance report rather than by the company. Management has now guided to 10–11% across the five years, having delivered 13.0% in the first year with the caveat that financing outperformance is front-loaded.165 The question to ask each year is not whether the number is high, but what it is made of — a return built on financing and inflation is more fragile than one built on operational incentives and cost efficiency, because the first two mean-revert when the regulator resets the debt allowance and inflation normalises.
2. Net ODI position. The company incurred a net customer ODI penalty of about £35 million in the year to March 2026 and has guided to another penalty in the coming year with year-on-year improvement, while maintaining that the cycle will net out in reward.16 That is a specific, dated, falsifiable claim. Track it. The maximum swing across the cycle runs from a £585 million reward to a £716 million penalty.17 If the annual penalty is not shrinking materially by 2027-28, the "net reward across the AMP" guidance is failing and roughly a third of the promised outperformance stack is at risk.
3. RCV gearing. Net debt to regulatory capital value, held at 60% at the last two year-ends against a 55–65% target and a Moody's Baa1 threshold at 68%.167 This is the constraint that governs whether the company can keep funding growth without returning to shareholders. The 2026 equity raise was, in effect, a decision to protect this number. If gearing drifts toward the top of the band while capex accelerates, another equity event becomes more likely — which is precisely why this metric deserves watching more closely than earnings.
Risk radar
Execution risk on the capital programme. The programme is now guided at about £11.5 billion, spending is back-weighted, and the supply chain is serving the entire industry at once.5 The first year delivered on profile, but the peak years are ahead. Cost overruns above allowance are shared 50:50 on base costs and 60:40 in customers' favour on most enhancement, so the company absorbs a meaningful share of any overspend.17
Note also that the incremental £2.5 billion is not yet approved: about £1.4 billion went to Ofwat under the 2026 re-opener process, with draft decisions due 15 August 2026 and final decisions 15 December 2026, and a further c.£1.2 billion planned for 2027 and 2028 submissions and transitional investment into the next cycle.5 The equity was raised before the approvals were granted. If Ofwat approves materially less than requested, the company will have diluted shareholders ahead of a smaller opportunity than advertised.
Regulatory and political risk. Ofwat is scheduled for abolition and replacement, the timetable for the next price review is genuinely unclear, and the Water (Special Measures) Act has introduced personal criminal liability and bonus prohibition powers.422 An open Ofwat enforcement case and an unresolved Environment Agency investigation into Windermere both sit outstanding.2019
There is also live litigation: collective proceedings issued in the Competition Appeal Tribunal in December 2023 on behalf of approximately 5.6 million domestic customers, claiming at least £141 million including interest, alleging the company abused a dominant position by providing misleading information to regulators. The CAT unanimously declined to certify in March 2025 on statutory grounds; the proposed class representative sought permission to appeal, and the company maintains the claim is without merit.18
Separately, the Supreme Court's July 2024 ruling in the Manchester Ship Canal case established that common law nuisance and trespass claims may be brought against water companies over discharges — a precedent whose financial implications the company itself described as unclear.18
Refinancing and cost-of-capital risk. The average effective interest rate rose to 4.2% from 3.8%, cash interest expense increased £67 million, and the company plans to shift from roughly half to about a third of net debt in index-linked form.16 Ofwat's debt indexation mechanism updates on a trailing basis, so a sustained rise in real gilt yields raises the company's new-issue cost faster than the allowance adjusts. The 80-basis-point advantage is a spread over an index, not immunity from the index.
Governance and alignment. The 24.2% vote against the remuneration policy is a live signal rather than a resolved issue, and it sits alongside a joint venture that has produced losses in consecutive years and an equity raise that followed repeated assurances of full funding.27 None of these is individually severe. Collectively they describe a board that is comfortable revising previously stated positions, which is worth monitoring in a company about to make five years of very large capital decisions.
Accounting and disclosure judgment. The infrastructure renewals capitalisation change added an estimated 37 pence to underlying EPS in its first year, and the index-linked debt estimation change a further 3 pence.16 Both were disclosed and comparatives re-presented, but investors should treat year-on-year underlying earnings comparisons across the transition with care, and should note that the company reports on an "underlying" basis that also strips out HS2 diversion revenue and deferred tax.
Affordability and collection risk. Household bills under the determination rise from an average of £519 in 2025-26 to about £585 by 2029-30 in constant 2022/23 prices, with the largest step in year one — a K factor of 13.38%.17 Bad debt held at 1.8% of statutory revenue in the first year, which is encouraging evidence, but this is a region with significant deprivation and the increases compound.16
Cyber and climate. Both are named risks in the company's own disclosures, with cyber security an explicit notified item in the determination — meaning costs are not fully allowed for.17 The company operates over 100 dams and service reservoirs, many of them Victorian, in a region where Beardmore has described 8% of annual rainfall arriving in Cumbria in a single day.167
Bull versus bear
The bull case. The balance sheet is the strongest in a sector where balance sheets have become the whole story: 60% gearing, Baa1/A-/BBB+, liquidity secured into the second half of FY28, and a demonstrated ~80 basis point advantage over the regulatory debt index that compounds across every instrument issued in the cycle.16 Asset base growth guided at around 10% compound to 2030 gives inflation-linked real asset compounding with a dividend growing in line with CPIH — the fifteenth consecutive year of at least inflation-matched dividend growth.5
Operationally, the first year of the cycle delivered material improvements on the metrics that carry both political and financial weight: spills down 23%, internal sewer flooding down 42%, zero category 1 pollutions, and reward status on all three customer experience measures.16
Early acceptance of the determination bought fifteen months of contracting advantage while five peers argued. And the incremental investment opportunity — housing, data centres, HyNet decarbonisation — is a genuine, externally driven expansion of the regulated asset base that did not exist eighteen months ago.5
The bear case. Start with the composition of returns. The outperformance stack is dominated by financing, which is front-loaded, mean-reverting and vulnerable to rate moves, while operational cost performance subtracted from returns across the entire previous cycle and management has explicitly guided against expecting much totex outperformance in this one.187 The ODI position is currently a penalty, and the promised swing to net reward across the cycle is a forecast, not a result.16
The company accepted a 4.03% allowed return that the CMA subsequently raised to 4.20% for those who fought, meaning the settlement United Utilities locked in is now demonstrably below what was achievable.24 The equity raise happened after eighteen months of assurances that equity would not be needed, which — whatever the technical justification — is a data point on how to read this management's forward statements about funding.17185 A material share of reported earnings growth came from an accounting change rather than economics.16
Two significant regulatory investigations and a live appeal in a consumer collective action remain unresolved, in a political environment that has criminalised executive failure and is dismantling the regulator that set the current settlement.2019184 And the deliverability question is unanswered: no English water company has attempted to spend at this rate, the supply chain is fully subscribed sector-wide, and the peak years are still to come.
The synthesis. The reason to own this business is not that it grows; it is that it is the most defensively financed operator in a sector where financing has become the differentiator between survival and restructuring, attached to an asset base that indexes with inflation. The reason to doubt it is that the sources of its historical outperformance are precisely the ones that are hardest to repeat, and that the political and regulatory framework which determines every material variable is being rebuilt from the ground up while the company executes the largest capital programme in its history. Both statements are supported by the evidence. Which one dominates depends almost entirely on things that will be decided by ministers, a new regulator and a construction supply chain — not by anything the company controls.
XI. Epilogue & Outro
Return to the tunnel. In 2026, contractors began work to replace six sections of a structure built by engineers who could not have envisioned the entity that would inherit it: a FTSE 100 corporation whose executives face personal criminal liability for environmental failures, whose prices are determined by an agency slated for abolition, and whose shareholders were called upon in April 2026 to finance water infrastructure for artificial intelligence data centres.
United Utilities represents the cleanest available test of whether the 1989 privatisation model can function over the long term. The company possesses the sector's strongest balance sheet, executive leadership with deep operational familiarity, a structural cost advantage handed down by Victorian engineering and Cumbrian geology, and an initial year in the 2025–2030 cycle that met most of its operational commitments. Conversely, it locked in an allowed return lower than its appealing peers achieved, maintains an outperformance record built more on treasury management than operational cost efficiency, executed an equity raise that contradicted previous management assurances, and relies on a regulatory settlement authored by an agency being wound up.
What to watch from here. Ofwat's draft decisions on the £1.4 billion re-opener submission on 15 August 2026 and final decisions on 15 December, which will test the growth assumptions used to justify the equity raise. The annual outcome delivery incentive outturn, specifically whether penalties shrink along the trajectory management promised. Construction progress and expenditure on the Haweswater program, marking the sector's first major trial of risk transfer through direct procurement. Resolutions to the Environment Agency's Windermere investigation and Ofwat's enforcement case. And the board's response to the 24.2% shareholder vote against its remuneration policy, showing how leadership handles investor dissent.
Finally, the Water Reform Bill—and within it, the answer to the timing question that went unanswered on the November call: when the next price review will occur, and under whose regulatory authority.
The water will keep flowing downhill either way. Everything else remains open to negotiation.
References
-
Landmark £3bn deal to overhaul 70-year-old aqueduct that supplies water to over 2.5 million customers in the North West — United Utilities ↩↩↩↩
-
Thames Water considers creditor-led recapitalisation proposal — Water Magazine, 2026-03-20 ↩↩
-
Water reform: "A new vision for water" — House of Commons Library ↩↩↩↩↩↩
-
Strategic update — United Utilities Group PLC, 2026-04-30 ↩↩↩↩↩↩↩↩↩↩↩↩
-
STRABAG consortium awarded major water infrastructure project in the UK by United Utilities — STRABAG, 2025-08 ↩↩
-
United Utilities FY26 Interim Results Q&A webcast, 2025-11-13 — Results, reports and presentations, United Utilities ↩↩↩↩↩↩↩↩↩↩↩↩↩↩↩↩
-
Water privatisation in England and Wales — libcom.org archive of UK water privatisation 1989–2001 ↩
-
Thatcher's Water Sell-Off Plan Is Proving Costly — The Christian Science Monitor, 1989-08-10 ↩
-
UK water group bids for power utility — UPI Archives, 1995-09-08 ↩↩
-
North West Water/Norweb Merger — Hansard, written answers, 1995-11-08 ↩
-
2025/26 Preliminary full year results announcement, litigation and contingencies — United Utilities Group PLC, 2026-04-30 ↩
-
United Utilities sells Vertex for £217.5m — Accountancy Age, 2007-01-15 ↩
-
Oak Hill Capital, GenNx360 and Knox Lawrence to Acquire Vertex from United Utilities — Oak Hill Capital, 2007-01-15 ↩
-
2025/26 Preliminary full year results statement — United Utilities Group PLC, 2026-04-30 ↩↩↩↩↩↩↩↩↩↩↩↩↩↩↩↩↩↩↩↩↩↩↩↩↩↩↩↩↩↩↩↩↩↩↩↩↩↩↩↩↩↩↩↩↩
-
2025–30 (AMP8) Final Determination — Investor summary, United Utilities, 2025 ↩↩↩↩↩↩↩↩↩↩↩↩↩↩↩↩↩↩↩↩↩↩
-
2024/25 Full Year Results Statement — United Utilities Group PLC, 2025 ↩↩↩↩↩↩↩↩↩↩
-
Coverage of Environment Agency investigation at Lake Windermere — Environment Agency blog, 2024-10-17 ↩↩↩↩
-
Ofwat announces enforcement cases against four more companies in wastewater treatment investigation — Ofwat, 2024-07-16 ↩↩↩↩
-
Water and sewerage companies in England environmental performance summary graphic 2024 — Environment Agency ↩↩
-
Government grants Ofwat new powers to force polluting water companies to ban exec bonuses — Ofwat, 2025-06 ↩↩
-
PR24 redetermination: what the CMA's decision means for UK households and water regulation — Oxera, 2026 ↩↩↩
-
United Utilities raises £800m through share placement — Investing.com, 2026-04-30 ↩
-
Majority of United Utilities shareholders approve pay plans despite backlash — Perspective Media, 2026-07-18 ↩↩↩↩↩↩↩
 LinkedIn
 WhatsApp
 Reddit
 Hacker News
 Email
Email Kindle
 RSS Feed
 Spotify
 Apple Podcasts
 Amazon Music
 Audible
 YouTube