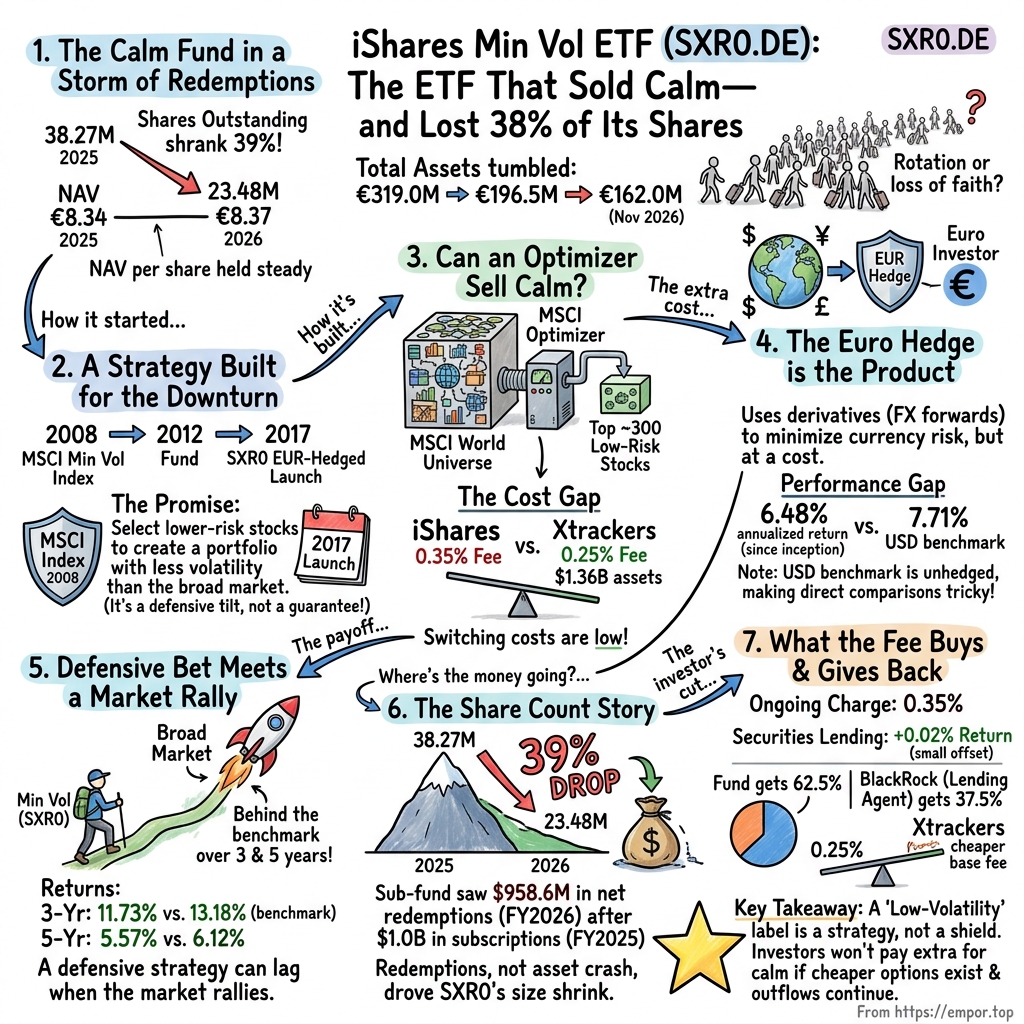
iShares Minimum Volatility: The ETF That Sold Calm—and Lost 38% of Its Shares
I. The Calm Fund in a Storm of Redemptions
Picture the ledger at the end of March 2026, in the offices of an Irish umbrella fund that most of its investors will never visit. On one line sits a share class called SXR0, the euro-hedged, accumulating version of the iShares Edge MSCI World Minimum Volatility UCITS ETF. A year earlier, that line had shown about 38.3 million shares in issue. Now it showed about 23.5 million.1 Nearly two out of every five shares had simply ceased to exist, handed back to the fund and cancelled.
Then look one column over, at the value of each remaining share. It had been €8.34. It was now €8.37.1 Through twelve months that included plenty of market noise, the thing the fund was built to deliver, a steady unit value, had held almost perfectly still. The investors were the part that moved.
That mismatch is the whole story in miniature. Class net assets fell from about €319 million to about €196.5 million over the fiscal year.1 If the portfolio had collapsed, the price per share would have collapsed with it. It did not. The asset base shrank because people left, not because the holdings lost their value. By 16 November 2026, the class held roughly €162 million, smaller again.2
So this is a strange kind of business story. There is no founder to profile, no factory, no quarterly earnings call. There is a promise, written into an index methodology and sold through a listed share: buy developed-market equities, but tilt toward the ones that have historically swung the least, and strip out the euro-dollar currency noise along the way. The product's customers are free to leave at any moment by selling on Xetra, and in the year to March 2026 a large share of them did.
The question that hangs over the rest of this story is simple to ask and hard to answer. Were those departures a temporary rotation, the kind of money that floods into defensive products when markets wobble and drains back out when they rally? Or were they a slower verdict on the product itself, on a fee of 0.35% a year, on a currency hedge whose value is hard to see, and on a cheaper rival that tracks the same index?
The stakes are clear enough. A systematic defensive strategy only earns its keep if, after fees and hedging, it delivers something an investor could not get more cheaply elsewhere. SXR0 charges 0.35% a year.3 An Xtrackers ETF that follows the same MSCI index charges 0.25%.4 That ten-basis-point gap is small in any single year and large over a decade, and it frames every section that follows.
Before going further, it helps to draw the borders precisely, because ETFs blur them. SXR0 is not a company. It is one share class within a sub-fund of iShares VI plc, an open-ended Irish umbrella fund managed by BlackRock.1 The sub-fund holds the stocks; the share class is a slice of that pool with its own currency treatment and its own count of shares. BlackRock's revenues, staff and group assets do not belong to SXR0, and neither do the dollar totals of the wider sub-fund, which also serves investors in other share classes.1
That boundary matters for a reason that is more than bookkeeping. Irish law ring-fences liabilities between sub-funds within the umbrella, but not between share classes inside the same sub-fund.1 The EUR hedge that defines SXR0 is run on behalf of this class, yet it lives inside a shared portfolio. Keep that detail in mind; it returns when the story reaches the currency forwards.
For now, the important point is what kind of product an investor actually bought. Not a slice of BlackRock, and not a bet on a management team, but access to a rules-based portfolio that promised to be calmer than the market. To judge whether that promise was worth paying for, the story has to go back to where it was born: in an index lab, in the middle of a financial crisis.
A word on the name, because every part of it carries meaning. "EUR Hedged" says the currency exposure is neutralised into euros. "Accumulating" says the dividends the fund receives from its roughly 300 companies are not paid out but reinvested, so they show up only as a slowly rising price per share.3 An investor who holds SXR0 never receives a cheque. Her entire return, income included, lives in that one number on the Xetra screen, which is exactly why a price that barely moved for a year, while the crowd of holders thinned, is so revealing.
 Subscribe on LinkedIn
II. A Strategy Built for the Downturn
The timing could hardly have been more dramatic. MSCI launched its World Minimum Volatility Index in 2008, the year when the idea of a "safe" equity portfolio was being tested more brutally than at any point in a generation.5 Banks were failing, correlations between stocks were rushing toward one, and investors who had been told that diversification would protect them discovered that, in a panic, almost everything falls together.
The idea MSCI packaged was not new in academic circles. For decades, researchers had noticed an awkward fact for textbook finance: over long periods, the least volatile stocks had not delivered the meagre returns that their low risk seemed to imply. MSCI's own research later framed low volatility as one of the established equity factors, a systematic tilt with its own pattern of good and bad market regimes rather than a free lunch.6 The commercial insight was to turn that observation into a rulebook that a fund could follow mechanically.
In plain language, the promise works like this. Start with the MSCI World index, the familiar basket of large and mid-sized companies across developed markets. Estimate how volatile each stock is likely to be and, crucially, how its movements line up with every other stock. Then let an optimizer assemble the combination with the lowest expected volatility, rather than simply picking the individually calmest names.7 Two jittery stocks that tend to zig when the other zags can, together, make a smoother pair than two steady stocks that always move in lockstep.
That distinction is the heart of the product, and it is worth dwelling on. A "low-volatility" index could be built crudely, by ranking stocks on their past wobble and buying the bottom fifth. The minimum-volatility approach is different: it is a portfolio-level calculation. It cares about how the pieces fit together. That is why it needs a risk model and an optimizer rather than a ranking table, and why its holdings can look surprising to anyone expecting a list of utilities and supermarkets.
The machine that makes that calculation is a risk model, and the one behind this index comes from Barra, the risk-analytics business that MSCI absorbed.7 Think of it as a weather service for stocks. It does not forecast whether a share will rise or fall; it forecasts how turbulent the share is likely to be and how its turbulence relates to everyone else's, by breaking each company down into exposures to countries, industries and common style traits. The optimizer then reads that forecast and assembles the portfolio least likely to get caught in a storm. If the forecast is wrong, so is the portfolio, and that dependence on a model is a quiet assumption buried in every minimum-volatility product.
Then came the product layers, each arriving years apart, and it is easy to blur them. The index came first, in 2008.5 The iShares sub-fund that tracks it opened in 2012, priced in US dollars and holding the global portfolio.2 The euro-hedged share class that trades as SXR0 arrived last, launching and listing on Xetra on 21 April 2017.8 Three birthdays, three different track records.
The distinction is not pedantic, because each layer has a different claim to evidence. The index's published history reaches back well before 2008, but the years before its launch are back-tested: they show how the rules would have behaved if anyone had been running them, not what any investor actually experienced.9 A back-test is a simulation with the benefit of hindsight in its design. It can explain a strategy. It cannot prove that the strategy, chosen after the fact, would have been chosen beforehand.
The live index record begins in 2008, the fund record in 2012, and SXR0's own record in the spring of 2017. That last window is the one that matters most to a euro investor holding this share class, and it is narrower than the strategy's long marketing history might suggest. It contains one sharp pandemic crash and rebound, one inflation and rate shock, and a long stretch in which a small group of very large technology companies dominated the market's gains. It does not contain a 2008.
That gap shapes how much weight the long history can bear. When marketing materials, or enthusiastic investors, talk about how minimum-volatility strategies cushioned the global financial crisis, they are talking about the index, partly in its back-tested years. SXR0 holders were not there. Their evidence is the nine and a half years since the class began trading, plus whatever they choose to infer from the index's longer life.
The documents are careful on this point, and it is worth taking them at their word. Lower historical volatility is an objective of the index, not a guarantee about the future behaviour of the ETF.3 The fund is classified as an equity product that can lose money, and the KID's risk indicator places it among products that carry real market risk.3 Calm, in other words, is a target the optimizer aims at using past data. Whether the next decade cooperates is another matter.
There is also a subtler limit. Minimizing volatility as measured by a model is not the same as minimizing losses. A portfolio can have lower day-to-day swings and still fall a long way if its favoured sectors are hit by a shock the risk model did not anticipate, such as a sudden spike in interest rates that punishes bond-like stocks. The strategy is defensive by design. It is not insured.
So the product that euro investors bought in April 2017 was a long-running factor idea wrapped in a young share class. The idea had history behind it; the class had to earn its own. And the mechanism that turned the idea into a portfolio, an optimizer working through a risk model, raised a question that would matter more and more as competitors arrived: if the recipe was public, who owned the dish?
III. Can an Optimizer Sell Calm?
Imagine the moment of a rebalance. A risk model has estimated how every stock in the MSCI World universe is likely to move, alone and together. An optimizer is handed a goal, find the portfolio with the lowest expected variance, and a set of rules it may not break. It churns, and out comes a list of roughly 300 names with their weights.9 That list is the minimum-volatility index until the next review. Nobody at BlackRock picked a single stock.
The rules are where the craft lies. An unconstrained optimizer chasing the lowest possible volatility would do absurd things: pile into a handful of sleepy stocks, abandon whole sectors, concentrate in one or two countries. MSCI's methodology prevents that with guardrails. Individual stock weights are capped, sector and country weights are held within bands around the parent index, and turnover at each review is limited so that the portfolio does not lurch from one composition to another.7 The intent is a portfolio that is calmer than the market but still recognisably investable.
Those guardrails are the reason minimum-volatility products have a distinct personality. Because the optimizer is rewarded for stocks whose returns are steady and weakly correlated with the rest, it tends to lean toward businesses with dependable demand, such as consumer staples, healthcare, utilities and telecoms, and away from the high-beta parts of the market, the cyclicals and the fastest-growing technology names, at least relative to the parent index.9 The factor exposures can differ materially from the broad market, which is exactly the point and exactly the risk.
Now step back and look at the industry chain, because it reveals who holds the power. MSCI designs and owns the index and licenses it. BlackRock licenses that index, builds a portfolio that tracks it, wraps it in an Irish UCITS structure and distributes it across Europe under the iShares name.110 Authorised participants, large trading firms, create and redeem shares directly with the fund, which keeps the exchange price close to the value of the holdings.3 The investor, finally, buys and sells on Xetra like any other stock.
Notice what is missing from that chain: exclusivity. MSCI does not license the minimum-volatility index to one manager alone. DWS's Xtrackers runs an ETF on the same MSCI World Minimum Volatility index, charging 0.25% a year and reporting about $1.36 billion in assets at the end of September 2026.4 Its holdings are built from the same rulebook. Its performance, before fees and hedging, should look much like BlackRock's.
This is the competitive crux. In most industries, a company's moat lives in something its rivals cannot copy: a network, a brand customers will pay for, a cost advantage from scale. Here, the core of the product, the index, is available to anyone willing to pay MSCI's licence fee. The methodology is published. The portfolio is disclosed. Two managers can sell what is, at the level of the stock list, close to the same thing.
So what is left to compete on? Three things. The first is cost: Xtrackers is ten basis points cheaper.4 The second is implementation: how tightly each fund tracks the index after trading costs, withholding taxes and lending income. The third is packaging and distribution: currency treatment, listing venues, platform availability, and the gravitational pull of the iShares brand on European brokers and advisers.
The fee gap deserves a moment of arithmetic. On €10,000, ten basis points is €10 a year. That sounds trivial, and in any single year it is. But it compounds, and it applies whatever the market does. Over a decade it becomes a visible slice of returns on a strategy whose entire pitch is modest, steady gains. For a product that expects to beat the broad market only through smaller losses in bad years, a permanent cost disadvantage eats directly into the margin of safety.
There is an important caveat, and it cuts in SXR0's favour. The Xtrackers fund is unhedged.4 SXR0 runs a currency hedge, which costs money to operate and is a distinct service. The fee comparison therefore does not isolate the price of the minimum-volatility exposure itself: some of SXR0's extra charge may be paying for the hedge rather than for BlackRock's name. A fair comparison would set SXR0 against a same-index, euro-hedged alternative, and that is a narrower field.
That caveat narrows the competitive verdict without overturning it. A euro investor who wants this specific index with a currency hedge has fewer choices, and BlackRock's hedged class occupies that niche. But a euro investor who is willing to hold the dollar and other currency exposure, or who hedges elsewhere, has a cheaper door into the same portfolio. And the hedge itself, as the next section shows, has its own costs and its own uneven record.
What about BlackRock's distribution muscle, the argument that iShares wins because it is everywhere? There is some evidence for scale at the fund level. The underlying sub-fund held about $3.3 billion at the end of March 2026, more than twice the Xtrackers peer.14 Scale can bring tighter trading spreads, deeper liquidity and more lending revenue. But the same year showed that scale is not loyalty: the sub-fund recorded roughly $959 million of net redemptions in fiscal 2026.1 Assets that arrive through distribution can leave the same way.
The relevant capital allocation in this business is not acquisitions or factories. It is the portfolio change at each index review. When MSCI's optimizer reshuffles weights, the fund must trade to follow, and those trades cost money. Because the fund uses an optimised approach rather than buying every index constituent in exact proportion, BlackRock's portfolio managers also decide how closely to match the list and where small deviations are worth the saving in costs.3 That is the only real "management decision" in the product, and its quality shows up in tracking difference, not in strategy statements.
Optimised sampling sounds technical, but the idea is homely. If an index holds 300 stocks and a few of them are tiny weights in expensive-to-trade markets, a fund can sometimes skip or underweight those names and adjust the rest so that the overall portfolio behaves almost identically.3 The saving in trading costs can outweigh the small risk of deviating. Done well, it is invisible. Done badly, it shows up as tracking error, the wobble between the fund and its index, and that wobble is the one place where the manager's skill or carelessness becomes measurable.
On that score, the evidence at the fund level is reassuring. In fiscal 2026 the sub-fund's main dollar class returned 2.54% against 2.53% for its index, essentially perfect tracking once lending income and other offsets are counted.1 Whatever gap exists between SXR0 and its stated benchmark, it does not appear to come from BlackRock's management of the stock portfolio. It comes from somewhere else in the wrapper.
So, can an optimizer sell calm? It can produce calm, or at least a credible attempt at it. Selling it at a premium is harder. The recipe belongs to MSCI, the dish can be cooked by a rival, and the rival charges less. Any minimum-volatility "moat" BlackRock possesses here is unproven: the best case for paying more rests on tight tracking, liquidity and the currency treatment. The first two are visible at the fund level. The third is the feature that defines SXR0, and it is where the story goes next.
IV. The Euro Hedge Is the Product
Consider a saver in Munich in the spring of 2017. She wants global equities, and she likes the idea of a calmer ride. But a global portfolio is a currency portfolio too. Most of the minimum-volatility index sits in American, Japanese, Swiss, British and other non-euro companies, and the fund that holds them keeps its books in US dollars.1 Every move in the euro against those currencies would ripple through her returns, sometimes more violently than the stocks themselves. SXR0 was built to take that ripple out.
The mechanism is simpler than it sounds. The fund holds the same stocks for every share class. For the euro-hedged class, it adds a layer of currency forwards: contracts that agree today to exchange one currency for another at a fixed rate on a future date.3 If the dollar weakens against the euro, the stocks lose value in euro terms, but the forwards gain, and the two roughly cancel. If the dollar strengthens, the reverse happens. The hedge is a seesaw designed to keep the currency side level.
Roughly is the important word. The KID is explicit that hedging may not eliminate currency risk and can itself affect returns.3 There are good mechanical reasons. Forwards are typically rolled monthly, so between rolls the portfolio's value drifts away from the amount that has been hedged. Investors create and redeem shares between rolls. And the portfolio spans many currencies, not just the dollar, so the hedge must track a moving mixture. The result is close to neutral, but not perfectly so.
Then there is the cost of carry, which is invisible on the factsheet but real in the returns. A currency forward's price reflects the gap between interest rates in the two currencies. When dollar rates sit above euro rates, a euro investor who hedges dollar assets gives up roughly that gap each year, because the forward locks in a less favourable exchange rate than today's. When euro rates are higher, the hedge earns it. Over the life of SXR0, that carry has been a recurring drag or boost layered on top of the stock returns, and it can rival the size of the fee.
This is why the hedge is the product, not an accessory. A euro investor in SXR0 is not simply buying minimum-volatility equities. She is buying minimum-volatility equities plus a rolling series of currency contracts whose economics depend on central-bank policy on both sides of the Atlantic. When she compares SXR0's returns with anything else, that second component must be accounted for.
Picture a year in which the dollar falls sharply against the euro. An unhedged euro holder of a global portfolio watches her returns shrink even if the companies she owns have a good year; a hedged holder sees mostly the companies' performance. Now picture the reverse, a year of a soaring dollar. The unhedged holder enjoys a windfall from the currency; the hedged holder forgoes it. The hedge does not make a portfolio better or worse on average. It changes what the investor is exposed to. That is a preference, and preferences can be worth paying for, but only if the investor knows what the preference costs.
Here is the problem: almost nothing in the published comparisons accounts for it. SXR0's factsheet shows a since-inception annualised return of 6.48% at the end of October 2026, against 7.71% for its published benchmark.11 That benchmark is denominated in US dollars.11 The comparison sets a euro-hedged share class beside a dollar index, which means the gap of about 1.2 percentage points a year is a blend of at least four things: the fee, the hedge carry, the hedge's imperfections, and any tracking of the stock portfolio itself.
The arithmetic of that gap is sobering when compounded. Over the roughly nine and a half years since launch, 6.48% a year turns €100 into about €182; 7.71% turns it into about €203.11 A euro investor might look at that and conclude that SXR0 has cost her around €20 per €100 relative to its benchmark. But she would be measuring a hedged euro product against an unhedged dollar yardstick, so the comparison cannot say whether the hedge helped, hurt, or simply did its job.
One clue narrows the possibilities. At the fund level, in dollar terms, the portfolio tracked its index almost exactly in fiscal 2026.1 The stock-picking machinery is not leaking. That points toward the wrapper, the fee and the hedge, as the source of most of SXR0's shortfall against the dollar benchmark. It does not say how much is fee and how much is carry, and that split is what an investor needs to know to judge whether the euro hedge was worth having.
The whole-fund accounts offer a tempting but misleading shortcut. They show net foreign-exchange gains on other instruments of about $60 million in fiscal 2026, after a loss of roughly $29 million the year before.1 It is natural to read those as the hedge's report card. They are not. They are aggregate figures for a dollar-based sub-fund with several share classes, and they mix hedging results for different classes with other currency effects. BlackRock does not publish a separate annual hedge gain or loss series for SXR0 in the annual report.1
MSCI does publish versions of the minimum-volatility index in euro terms.12 But an index translated into euros is not the same as an index hedged into euros: the first carries the full currency swing, the second removes most of it. The yardstick SXR0's investors need is a hedged-to-euro version of the same index, net of the same withholding taxes, set against the class's own returns year by year. Only then could a euro holder see the hedge's contribution in isolation.
There is also a residual structural risk worth naming once. Because Irish law does not ring-fence liabilities between share classes within a sub-fund, a hedging loss attributable to one class could, in an extreme case, affect the assets of others.1 The forwards are also contracts with banks, which introduces counterparty exposure that a plain equity holding lacks. These are tail risks, managed by collateral and policy, but they are the price of building a hedged class inside a shared pool.
What, then, can be concluded? The hedge is a meaningful feature for a euro investor who does not want her equity returns to depend on the dollar. That use case is genuine. But its value has never been demonstrated in a clean comparison, and the headline numbers investors see do not allow one. The figure that would settle the matter is a multi-year return bridge: market exposure, hedge result, fee, lending income and tracking, each shown separately, against a consistent euro-hedged benchmark.
Without that bridge, the euro hedge is a promise investors take on trust. And trust, in an equity product, is ultimately tested by the returns. So the next question is the most direct one of all: when the market turned, did the calm portfolio actually deliver?
V. The Defensive Bet Meets a Rally
Run the tape of SXR0's life as calendar years and a pattern appears. In 2019, it rose almost 20%.3 In 2020, the pandemic year, it ended slightly down.3 In 2021, it gained about 16%; in 2022 it lost about 9.6%; then came gains of about 6%, 13% and 6.6% through 2025.3 It is a recognisable equity path: good years, bad years, a few flat ones. The calm, in other words, is relative.
Even the first full year carried a lesson. In 2018, SXR0's opening calendar year, the class lost about 3.7%.3 Nothing dramatic happened to the strategy; it was simply a year in which equities sold off late and a defensive portfolio fell too, if less than many. Investors who had bought in the spring of 2017 expecting a product that would never post a red year learned within eighteen months that the label described a tendency, not a floor.
The most revealing years are the ones where the strategy's character showed. Take 2022. Inflation surged, central banks raised rates at the fastest pace in decades, and the broad MSCI World index fell by roughly 18% in dollar terms.9 SXR0 lost under ten percent.3 That is the minimum-volatility promise in action: not avoiding the decline, but taking roughly half of it. For an investor who bought the product to sleep better in a bear market, 2022 was the year it earned its keep.
Now take 2020 and 2023. In 2020, the broad developed market finished the year with a gain in the mid-teens after its pandemic crash and recovery, while SXR0 ended slightly negative.93 The defensive tilt that should have shone in the March crash did not prevent losses, and it then missed the violent rebound led by technology stocks. In 2023, the broad index rose more than 20% as a narrow group of mega-cap growth companies powered the market; SXR0 gained about 6%.93 Those were the years when calm cost money.
This is the trade investors signed up for, whether they knew it or not. A minimum-volatility portfolio deliberately underweights the most exciting and most volatile parts of the market. In years when those parts lead, it lags, sometimes by a wide margin. In years when they crash, it falls less. The question is not whether it lags in rallies; it is designed to. The question is whether the protection in the down years outweighs the drag in the up years.
Measured against its own benchmark, the answer from the live record is not encouraging. At the end of October 2026, SXR0 had returned about 11.7% a year over three years, 5.6% over five years and 6.5% since inception.11 Its published benchmark had returned about 13.2%, 6.1% and 7.7% over the same periods.11 The class trailed in every window shown. The lag was largest over three years, about one and a half points a year, and smallest over five.
But this is where the currency mismatch from the euro hedge returns. Those benchmark figures are in dollars. A hedged euro investor was never going to receive the dollar index return; she would receive the index return adjusted for the hedge carry and the fee. The persistent lag is therefore real as a description of what the stated comparison shows, but it is not proof that the strategy failed in euro-hedged terms. It is a comparison that cannot answer the question being asked of it.
What would answer it? Two things together. First, a like-for-like euro-hedged benchmark, to see whether SXR0 delivered the index as designed. Second, a comparison against the broad developed market, also hedged into euros, to see whether the minimum-volatility tilt itself paid off on a risk-adjusted basis. The class publishes neither on its factsheet as a headline comparison, so the investor must assemble them herself or take the strategy on faith.
The longer index record helps frame what the right test looks like, while reminding everyone that it is not SXR0's own. MSCI's research describes low volatility as a factor that tends to outperform in falling markets and underperform in strong rallies, with results that depend heavily on the period measured.6 Over long spans, the index has delivered returns broadly comparable to the market with materially lower volatility, but part of that history is back-tested, and the live portion includes the post-2008 bull market in which defensive stocks were both fashionable and expensive.9
The honest reading of SXR0's record, then, is that the defensive mechanism has worked when markets fell hard, as in 2022, and has cost heavily when markets were led by the stocks it avoids, as in 2023. Lower volatility is not capital protection: the class still lost money in two of its eight full calendar years and finished a third roughly flat.3 And over every reported horizon it trailed its stated benchmark, by margins that the hedge may explain in part but which no published figure decomposes.
That leaves the central claim, that minimum volatility compensates investors over a full cycle, intact but unproven for this share class. The live record does not reject it. The 2022 cushion is real evidence for it. But nine and a half years, with the decade's mega-cap rally in the middle, is not a full comparable cycle, and the stated benchmark is the wrong currency. The metric that would confirm or falsify the claim is SXR0's realised volatility and net return against a euro-hedged broad-market index over a period that includes at least one sustained bear market.
Investors, of course, do not wait for perfect evidence. They vote with their money, continuously, every trading day. And in the share count, the record of who arrived and who left, the market has already been casting its votes.
VI. The Share Count Tells the Outflow Story
Follow the share count as if it were a crowd moving through a station. At the end of March 2024, SXR0 had about 14.3 million shares in issue.1 Twelve months later the crowd had swollen to about 38.3 million, more than two and a half times larger.1 Then, over the following year, it thinned to about 23.5 million.1 A surge, then a retreat that gave back more than half of what had arrived.
For an ETF, the share count is unusually honest data. An open-ended fund does not issue equity to raise capital or buy back shares to support a price. Shares come into existence when authorised participants deliver cash or securities to create them, because investors are buying, and they disappear when those participants redeem them, because investors are selling.1 The count therefore measures demand directly, stripped of the market's mood.
The mechanics also explain why the departure of so many holders did no visible damage to those who stayed. When an authorised participant redeems a large block of ETF shares, the fund can hand over a slice of its underlying stocks rather than selling them in the market, and the participant bears the cost of unwinding them.10 Remaining holders are largely shielded from the trading bill of their departing neighbours. It is one of the quiet virtues of the ETF wrapper, and it is part of why the price per share could hold steady while nearly two-fifths of the share count vanished.
That is why reading the count beside the price is so powerful. Between March 2025 and March 2026, shares outstanding fell by about 39% and class net assets by about 38%, while the net asset value per share barely moved, from €8.34 to €8.37.1 If market losses had driven the decline, the price per share would have fallen. It did not. The contraction was almost entirely investors handing their shares back.
The surge before it is just as telling. In fiscal 2025, the class nearly tripled its share count. That kind of inflow suggests a product that was actively chosen, perhaps by advisers, model portfolios or platforms that added a defensive, euro-hedged sleeve. Flows of that kind can be large and lumpy: a single portfolio decision can move tens of millions of euros in or out. Which means a large outflow may reflect a handful of allocation decisions as much as a broad loss of faith.
The wider sub-fund tells the same story at a larger scale. It took in about $1.0 billion of net subscriptions in fiscal 2025, then recorded about $959 million of net redemptions in fiscal 2026.113 The pooled strategy, in other words, round-tripped almost exactly: a year of enthusiasm followed by a year of departure. That pattern looks more like a tactical allocation coming and going than a slow, steady erosion.
But the fund-level figures must be held in perspective. They cover every share class and every currency, so they show pressure on the minimum-volatility strategy as a whole, not what happened to the euro-hedged class alone. SXR0's own figures are the ones that matter for its viability, and they were, if anything, more dramatic, because the class had grown so quickly the year before.
What happened after March 2026? The class-level flow series for the months since the fiscal year-end is not published in the annual accounts, so the share count after that date has to be inferred from the asset figures on the factsheet and product page. At the end of October 2026 the class held about €164.5 million; by mid-November, about €162 million.112 Set beside the €196.5 million at the fiscal year-end, assets kept shrinking while the market, judging by the class's positive three-year record, was not collapsing.11
Treat those later asset figures as a scale check, not a verdict. Assets move with both flows and returns, and a few weeks of market drift can mask or exaggerate a trend. What they do establish is that the outflow did not snap back into inflow in the months after the year-end. The class remained smaller, and modestly shrinking, through autumn 2026.
How much does size matter for a share class like this? Less than for a stand-alone fund, because SXR0 rides on a sub-fund of more than $3 billion.1 Its trading costs, liquidity and portfolio management are shared across the pool. But share classes do have a viability threshold of their own: providers periodically review small classes and can merge or close them when they no longer pay their way. At around €160 million, SXR0 is far from that edge, yet the direction of travel is what a holder should watch.
It also helps to see how small a slice of the whole SXR0 is. The sub-fund reported roughly $3.2 billion of assets at the end of October 2026, while the euro-hedged class accounted for about €164.5 million of that.11 Even allowing for the exchange rate, the class is only a single-digit percentage of the pool it rides on. Its departures are significant for the class and its fee base, but they are a minority of the money inside the strategy, which is why the fund-level flows and the class-level flows have to be read as separate stories that happen to share a portfolio.
The test that would settle the central question is precise. It is the class's annual creations and redemptions, reported separately from its investment return. If redemptions slow and creations resume, the 2025–26 outflow was a rotation: money that came in for defensive cover and left when it no longer felt needed. If the drip continues through another year, it becomes harder to argue that demand for this particular expression of minimum volatility is merely cyclical.
There is a reason to suspect the answer depends on what investors think they are paying for. A product that loses a large share of its holders while delivering exactly what it promised, a steady unit value, is telling its manager something. Perhaps the holders wanted a different kind of calm, or found it cheaper elsewhere, or simply concluded that the steady path had become too slow. To understand which, the story has to follow the money that every holder pays, whether they stay or go.
VII. What the Fee Buys—and What Lending Gives Back
Every morning, before the market opens in Frankfurt, a tiny fraction of the fund's value quietly moves from the investors' side of the ledger to the manager's. Nobody sends an invoice. The charge is accrued daily inside the net asset value, so the price an investor sees on Xetra is already net of it. For SXR0, that charge runs at 0.35% a year, the class's ongoing charge and total expense ratio.311 It is the price of the whole BlackRock-managed structure: portfolio management, the currency hedge, custody, administration, index licensing and the rest.
Put that fee into euros and it becomes concrete. At the class's recent size of roughly €160 to €200 million, 0.35% amounts to somewhere between about €560,000 and €700,000 a year.21 Spread across thousands of holders, it is invisible to each. Gathered together, it is the revenue line of this small business within a business, and it does not depend on whether the strategy works. The fee is charged in rising markets and falling ones, in years of calm and years of storm.
That is the first thing to understand about the economics: the manager's income scales with assets, not with performance. BlackRock earns more when SXR0 is large and less when it shrinks. The fiscal 2026 outflows, which took about €120 million out of the class, cut its fee base by close to two-fifths. In that narrow sense, the manager's incentive and the investor's flow behaviour are tightly linked: BlackRock wants holders to stay, and holders stay only if they believe the product is worth its charge.
Against that fee sits an offset that most investors never notice: securities lending. The fund lends some of the shares it holds to other market participants, typically to support short selling or settlement needs, in exchange for a fee and against collateral. The income flows back into the fund. For the year to 30 September 2026, the class's securities-lending return was about 0.02%.2 Two basis points, set against thirty-five.
The arithmetic is unkind to anyone hoping lending will make the fee disappear. Two basis points recovers roughly one-seventeenth of the charge. It is a real offset, and it is better than nothing, but it does not change the investor's economics in any meaningful way. It certainly does not close the ten-basis-point gap to the cheaper Xtrackers fund, which can also lend its holdings.4
The fund-level figures confirm the scale. The sub-fund earned about $644,000 of securities-lending income in fiscal 2026, slightly down from about $686,000 the year before.1 Against roughly $3.3 billion of net assets, that is about two basis points, the same order of magnitude as the class figure.1 Those dollar totals belong to the whole sub-fund, not to SXR0; the class's share is the small percentage, not the headline amount.
Here the arrangement becomes interesting, because the lending agent is BlackRock itself. Under the disclosed split, the fund keeps 62.5% of the lending revenue and BlackRock receives 37.5% for running the programme.3 In other words, the manager earns a fee for managing the fund and a separate share of the revenue from lending out the fund's assets. That is a common structure across the ETF industry, and the split is disclosed openly. But it is an affiliated arrangement, and it deserves the scrutiny that affiliated arrangements always do.
The question a skeptical investor would ask is not whether BlackRock is entitled to be paid for lending, it is whether the terms would look the same if negotiated at arm's length. The board says they do. The annual report states that transactions with connected parties must be conducted at arm's length and in shareholders' best interests, and that the directors were satisfied the procedures were followed.1 That is a governance assurance, not an independent benchmark. A fund that keeps a larger share of lending revenue, or pays a third-party agent less, would be the natural comparison.
There is another affiliated thread in the accounts. At the end of March 2026, the broader sub-fund held about $22.2 million in a BlackRock-managed dollar liquidity fund.1 That is the fund's cash management: money parked between trades or as a buffer, invested in a BlackRock money-market vehicle that earns its own fees. It is a whole-fund holding, not an SXR0 balance, and at well under one percent of net assets it is small. But it is one more place where BlackRock sits on both sides of a relationship.
The accounts report no related-party guarantees or commitments in either of the last two fiscal years and no related-party balances written off.1 Deloitte's audit opinion for fiscal 2026 was unmodified; the auditor's key matters were the valuation and existence of the fund's financial assets and liabilities, the bread-and-butter risks of a fund that holds listed stocks and derivatives.1 The fund reported no significant commitments or contingent liabilities at either year-end.1 None of this is dramatic, which is exactly what a holder of a passive fund should want to see.
Who watches over all of this? Not a chief executive with an equity stake, because the fund has none. Oversight sits with a board of directors and with the management company to which BlackRock delegates the work. In 2026 the board had five non-executive directors, four of them independent, and the annual report records no director holdings in the fund.1 That last detail cuts both ways. Independence from the manager is the point of the board. But a board with no money in the product has no personal stake in whether its fees and arrangements serve holders well.
Put the recurring economics in one frame and the picture is straightforward. The investor's return equals the return of the stock portfolio, plus or minus the currency hedge, minus the 0.35% charge and any trading or tracking slippage, plus a sliver of lending income. Of those pieces, the fee is the only one that is certain every year. The hedge and the portfolio swing with markets; lending adds a rounding error.
What would make the economics clearer is a class-level reconciliation, published every year, showing every BlackRock-related payment against the class's assets and returns: management fee, lending agent share, any money-market fees on cash, set against lending income retained. The pieces are disclosed in different documents and at different levels of the structure. A holder who wants to know the all-in cost of owning SXR0 after lending income has to assemble it from the KID, the product page and a several-hundred-page umbrella annual report.321
The conclusion is not that the fee is excessive or the affiliated arrangements improper; the documents show standard industry practice, clearly disclosed and formally overseen. It is that the investor is paying a fixed toll for a variable outcome, and that lending income does little to lower that toll. Whether the toll is worth paying depends on the case for the product as a whole, which is where the story now has to weigh everything it has learned.
VIII. Analysis & Bear vs. Bull Case
Imagine an investor at her screen with two tabs open. In one, SXR0: euro-hedged, iShares-branded, 0.35% a year, a class that has shrunk from about €319 million to under €200 million in a single fiscal year.1 In the other, the Xtrackers fund on the same MSCI index: unhedged, 0.25% a year, about $1.36 billion in assets.4 Both promise the same calm portfolio. One costs more and wraps the euro. The decision she faces is the whole bull-and-bear debate in a single click.
Start with the bull case, argued as strongly as the evidence allows. The core exposure is systematic and diversified: roughly 300 developed-market stocks chosen by a transparent rulebook, with sector, country and turnover constraints that keep the portfolio investable.97 There is no star manager to lose, no style drift, no hidden leverage. An investor knows what she owns, and the holdings are published.
The strategy's defensive character has live evidence behind it. In 2022, when the broad developed market fell by roughly 18% in dollars, the class lost under ten percent.93 For a saver whose biggest risk is panic-selling at the bottom, a portfolio that falls half as far may be worth more than its long-run return suggests, because it keeps her invested. That behavioural benefit does not show up in any benchmark comparison, but it is the real reason many people buy minimum volatility.
The currency hedge adds a second, distinct use case. For a euro investor, much of a global equity portfolio's short-term volatility comes from exchange rates rather than stock prices. Hedging removes most of that, which makes the portfolio's euro returns depend chiefly on the companies inside it.3 Combine a defensive stock tilt with a currency hedge and the product offers something genuinely specific: global equities with two layers of noise removed.
Implementation also looks clean where it can be measured. The sub-fund tracked its index almost exactly in dollar terms in fiscal 2026.1 The structure is physical, holding real shares rather than swaps, which adds transparency. Securities lending is modest but positive.2 Deloitte's audit was unmodified and the board, by its own account, is majority independent.1 None of that is a moat, but all of it is what a careful investor would want from plumbing she cannot see.
Where the calm runs out
Now the bear case, argued just as hard. SXR0 remains an equity product, exposed to equity losses and to the specific risk of the minimum-volatility factor falling out of favour.3 The live record shows what that means: a negative 2020 while markets rallied, a 2023 in which the class gained about six percent as the broad index rose more than twenty.39 A defensive tilt can lag for years, and nothing in the rulebook says when the drought ends.
The record against its stated benchmark is persistently behind: about 1.2 points a year since inception, about half a point over five years, about one and a half over three.11 The hedge mismatch makes that gap ambiguous, as the euro-hedge discussion showed, but ambiguity is not a defence. A product that cannot show, in its own headline materials, that it delivered its strategy in its own currency has handed the burden of proof to its customers.
The same-index peer costs less.4 Whatever the merits of the hedge, an investor who does not need it, or who hedges at the portfolio level, can buy the identical stock exposure for ten basis points less every year. And the class has just experienced a large wave of redemptions, which, whatever their cause, show that a substantial share of the investors who chose SXR0 in 2024 and 2025 chose to leave by 2026.1
Then there is what the investor pays for the underlying companies. At the end of October 2026, the portfolio's aggregate price-to-earnings ratio was about 23 times and its price-to-book about 3.2 times.11 Those are portfolio measures, not a valuation of the fund, but they make a point the low-volatility label can obscure: calm stocks are not necessarily cheap stocks. When investors crowd into defensive equities, they can bid them up, and a defensive portfolio bought at a full price carries a valuation risk of its own.
A brand is not a moat
Run the competitive frameworks once, briefly, because they clarify why the bull case is narrower than it looks. Switching costs for an ETF investor are close to zero: selling one fund and buying another takes seconds and costs a spread and perhaps a tax event. Buyer power is therefore high. The threat of substitutes is high too: the same index from Xtrackers, other low-volatility indices from other providers, or simply a cheaper broad-market fund paired with a bond allocation to dampen swings.
Supplier power sits with MSCI, which owns the index and licenses it to whoever pays. That is a meaningful force: BlackRock cannot make the index exclusive, and it pays a licence fee for something its rivals can also rent. The threat of new entrants is moderate. Launching a UCITS ETF is not trivial, but the large managers already have the infrastructure and can add a product quickly. Rivalry among existing players is intense, and it is fought chiefly on fees, where the cheaper peer sets the ceiling.
Hamilton Helmer's seven powers sharpen the verdict. Scale economies exist at the fund level, since a larger pool spreads fixed costs and supports tighter trading, but they have not translated into a lower fee for this class. Network effects are absent. Counter-positioning is absent, since every rival can copy the product. Switching costs are negligible. A cornered resource would require exclusive control of the index or the risk model, and MSCI holds those. Process power is limited to execution quality, visible in tracking. Brand is the strongest candidate: iShares is the default choice on many European platforms and in many model portfolios.
Brand, though, is precisely what the fiscal 2026 outflows test. If the iShares name kept investors loyal, the class would not have lost nearly two-fifths of its shares in a year in which the price per share held steady.1 The history does not reject the brand advantage, because the class still exists at a meaningful size and the sub-fund remains more than twice the Xtrackers peer.14 But it narrows it: brand attracts flows, and it did not prevent them from leaving.
A skeptical long-term investor, the kind who would write a pointed letter to a fund board, would focus on incentives first. BlackRock earns a recurring fee based on assets and receives 37.5% of lending revenue as agent.3 Neither depends on performance against a benchmark. The board, five non-executive directors with four independent, oversees those arrangements, yet holds no shares in the fund.1 The governance structure is standard for the industry. It is also one in which no party with power over the fees has money riding on the outcome.
That investor would then ask three specific questions. Why does the class not publish a euro-hedged benchmark alongside its dollar benchmark, so that holders can judge the hedge? Why is the all-in cost after lending income not reconciled at the class level? And what is the rationale for a fee ten basis points above the closest same-index rival, broken into the parts that pay for the hedge and the parts that pay for everything else? None of these questions implies wrongdoing. All of them would make the product easier to evaluate.
The risks worth naming are few and specific. The first is equity and factor-cycle risk: the class can lose money in absolute terms and lag the market for long stretches. The second is hedge risk: basis between the hedge and the portfolio, carry costs that depend on interest-rate gaps, and counterparty exposure to the banks on the other side of the forwards.31 The third is fee competition, which can only push in one direction. The fund has no corporate debt, no operating segments, no acquisitions and no capital-allocation programme in the conventional sense; those risks simply do not apply.
If an investor wanted to track this product with three numbers, these would be the ones. The first is SXR0's net flows, separated from performance: the share count fell from about 38.3 million to about 23.5 million in fiscal 2026, and class assets kept drifting lower into November 2026.12 The direction is down. Stabilisation would be the first sign the outflow was a rotation rather than a verdict.
The second is net return and realised volatility against a consistent euro-hedged benchmark. The latest available reading uses a dollar yardstick, against which the class trails by about 1.2 points a year since inception.11 What matters is whether a like-for-like comparison shows the product delivering its index, and whether the volatility reduction persists. The third is all-in cost after lending income against the closest peer: currently 0.35% against 0.25%, with about two basis points of lending offset.1142
Weigh all of it, and the verdict is clear enough to state plainly. The bull case rests on a coherent use case, a defensive global equity tilt with currency noise removed, and on clean implementation where it can be measured. But the product's advantage over cheaper alternatives is not established by a like-for-like net-return record, and the competitive structure gives BlackRock little protection beyond its brand. The bear case is strengthened by persistent benchmark lag and the redemption wave. It would weaken if the class's flows stabilise and euro-hedged comparisons show the hedge and the tilt earning their keep.
That is the analytical verdict. But funds like this one also teach something beyond their own numbers, about what it means to buy a promise and how to tell whether it is being kept.
IX. Business & Investing Lessons
Go back to that ledger line in March 2026: a share count that had fallen by nearly two-fifths, sitting beside a price per share that had barely twitched.1 It is an image that teaches more than any performance chart, because it separates two things investors routinely confuse: whether a product does what it says, and whether people still want what it says.
The first lesson is that a lower-volatility label is a method, not a safety net. SXR0 did exactly what its rulebook asked: it held stocks whose combined behaviour was expected to be calmer than the market. And in 2022 the method delivered, falling about half as far as the broad index.39 But the same method produced a loss in 2020 and a gain of only about six percent in 2023, and its documents never promised otherwise: the KID warns that the class can lose money and that its lower historical volatility is an objective, not a guarantee.3 Buy the method for what it is, a tilt with a personality, and the bad years will not feel like a betrayal. Buy it as insurance and they will.
The wider point for investors is that a rule-based product's virtue is predictability of process, not predictability of outcome. The optimizer will behave the same way next year as last year. The market will not. Anyone selling or buying a systematic strategy should ask what kind of market makes it look foolish, because that market will arrive, and the holders who did not expect it will be the first through the door.
The second lesson is that flows tell you whether investors still want the promise. A fund's price measures how well it delivered; its share count measures how much its customers still value that delivery. In SXR0's case, the two diverged sharply. The price held; the holders left.1 That pattern is a warning to anyone who judges an ETF only by its performance chart. A product can keep its promise perfectly and still lose its market, if the promise stops being the one investors want to buy or if someone else sells it cheaper.
For asset managers, the lesson is sharper. Flows that arrive quickly in a defensive mood can leave just as quickly when the mood changes. The class nearly tripled in fiscal 2025 and gave back more than half of that in fiscal 2026.1 A manager who reads a surge of inflows as proof of product-market fit, rather than as a tactical allocation that will reverse, will misjudge the business. In ETFs, as in retail, the customer who came for the sale is not yet a loyal customer.
The third lesson is that a hedge earns its fee only in a fair comparison. SXR0's headline record sets a euro-hedged share class against a dollar benchmark, and the gap of about 1.2 points a year cannot reveal whether the hedge helped or hurt.11 BlackRock does not publish a separate class-level hedge result in the annual accounts.1 So the feature that most distinguishes this class from its cheaper same-index rival is also the one whose value is hardest to see. A feature you cannot measure is a feature you are taking on trust, and trust is a poor basis for paying a premium year after year.
There is a fourth lesson, quieter than the others, about who owns the recipe. The minimum-volatility index belongs to MSCI.7 BlackRock rents it, and so does DWS.4 When the core of a product is licensed to all comers, the product's edge must live somewhere else: in cost, in execution, in packaging. SXR0's packaging, the euro hedge, is real. Its execution, judged at the fund level, is tight. Its cost is higher. Founders and managers building on a licensed foundation should assume that every advantage they claim will be copied except the ones they can prove with numbers.
Put the lessons together and they compress into a single line for this fund. Calm is not the product. Calm net of fees, hedge costs and factor cycles, delivered more cheaply than the nearest rival, is the product. Everything short of that is a story about a portfolio, not a reason to pay for one.
X. Epilogue
Tonight, in mid-November 2026, SXR0 is a share class of roughly €162 million inside a sub-fund of a little over $3 billion.211 It is about half the size it was at its peak in March 2025, and modestly smaller than it was at the fiscal year-end. The fund still tracks its index tightly in dollar terms. The class still charges 0.35%. The cheaper same-index rival still charges 0.25%. And the question that opened this story, rotation or rejection, remains open.
The next moments that will decide it are not earnings calls. The fund publishes no ETF-specific earnings-call series, and BlackRock's group commentary, however informative about the asset-management industry, is not evidence about SXR0's own results. The evidence arrives through quieter channels: monthly factsheets, the product page's daily asset figure, the semi-annual and annual reports of iShares VI plc, and any update to the prospectus or the KID.1121103
The first test is flows. The annual report for the year to March 2027 will show the class's share count at its next year-end, and with it the net creations or redemptions over the period. If the share count stabilises or rises, the 2025–26 retreat will look like a rotation: tactical money that came in for cover and went out when the cover felt unnecessary. If it falls again, the case that demand for this particular expression of minimum volatility is weakening becomes much harder to dismiss.
The second test is the comparison that has never been made in the headline materials. MSCI already publishes the minimum-volatility index in euro terms, and a version hedged into euros is the natural yardstick for a hedged class.12 A holder, an adviser or a fund board could set SXR0's net return against a properly hedged version of the index, year by year, and finally see how much of the long-run gap to the dollar benchmark came from the fee, how much from hedge carry, and how much from anything else. If that comparison shows the class delivering its hedged index almost exactly, the dollar-benchmark lag becomes an artefact. If it shows a persistent shortfall, the product has a problem that no amount of branding can fix.
The third test is the market itself. A minimum-volatility strategy is built for the day the rally breaks. If the next sharp downturn arrives and SXR0 again falls materially less than the broad market, as it did in 2022, the defensive case will gain fresh, live evidence, and some of the holders who left may return. If the next downturn arrives in a form the risk model did not anticipate, such as a rate shock that hits bond-like defensive stocks hardest, the class could disappoint precisely when it is meant to shine.
And there is the fee. In a market where same-index competition is a click away, a ten-basis-point gap is a standing invitation for holders to leave. Whether BlackRock narrows it, defends it with clearer evidence of the hedge's value, or simply accepts a smaller class is a decision the manager will make, not the market. Each choice would say something about how much the provider believes this share class is worth fighting for.
So the outcomes divide cleanly. If class outflows stabilise and the product delivers lower realised volatility without a persistent net-return penalty against a fair euro-hedged yardstick, the defensive case gains real support and the 2025–26 retreat becomes a footnote. If assets continue to fall and the comparable hedged return remains weak after fees, the case for paying more than the nearest rival narrows to a small group of investors who value the hedge for its own sake. The tension that remains is the one the product was built around: whether calm, once bought, is something investors will keep paying for when the market stops frightening them.
XI. Outro
Return, one last time, to that ledger line. A price per share that drifted from €8.34 to €8.37. A share count that fell from about 38.3 million to about 23.5 million.1 The portfolio held its nerve. The investors did not.
That is what makes SXR0 unlike any operating company in an ordinary story of business. It has no product launch to celebrate, no factory to build, no rival to acquire. It has one promise, written by an optimizer and sold through a currency hedge, and it lives or dies by a single vote cast every trading day by everyone who owns it. Calm is the fund's pitch. Whether investors stay is the market's verdict, and in the year that ended in March 2026, that verdict was written in the shares that disappeared.
References
-
iShares VI plc Annual Report and Audited Financial Statements, year ended 31 March 2026 — iShares, 2026-06-25 ↩↩↩↩↩↩↩↩↩↩↩↩↩↩↩↩↩↩↩↩↩↩↩↩↩↩↩↩↩↩↩↩↩↩↩↩↩↩↩↩↩↩↩↩↩↩↩
-
iShares Edge MSCI World Minimum Volatility UCITS ETF EUR Hedged (Accumulating) — iShares ↩↩↩↩↩↩↩↩↩↩↩
-
Key Investor Information: iShares Edge MSCI World Minimum Volatility UCITS ETF EUR Hedged (Acc) — iShares, 2026 ↩↩↩↩↩↩↩↩↩↩↩↩↩↩↩↩↩↩↩↩↩↩↩↩↩↩↩↩↩
-
Xtrackers MSCI World Minimum Volatility UCITS ETF 1C Factsheet — DWS, 2026-09-30 ↩↩↩↩↩↩↩↩↩↩↩
-
Low Volatility over the Market Cycle: Understanding Factor Investing — MSCI, 2023 ↩↩
-
MSCI Global Minimum Volatility Indices Methodology — MSCI ↩↩↩↩↩
-
iShares Edge MSCI World Minimum Volatility UCITS ETF — Listing and Product Literature — iShares ↩
-
MSCI World Minimum Volatility Index Factsheet — MSCI ↩↩↩↩↩↩↩↩↩↩↩
-
SXR0 iShares Edge MSCI World Minimum Volatility UCITS ETF Factsheet — iShares, 2026-10-31 ↩↩↩↩↩↩↩↩↩↩↩↩↩↩↩↩
-
iShares VI plc Annual Report and Audited Financial Statements 2025 — iShares, 2025-06-25 ↩
 LinkedIn
 WhatsApp
 Reddit
 Hacker News
 Email
 Kindle
 RSS Feed
 Spotify
 Apple Podcasts
 Amazon Music
 Audible
 YouTube