Stellantis N.V.: The Global Consolidation Machine & The Price of Margin Obsession
I. Introduction & Episode Roadmap
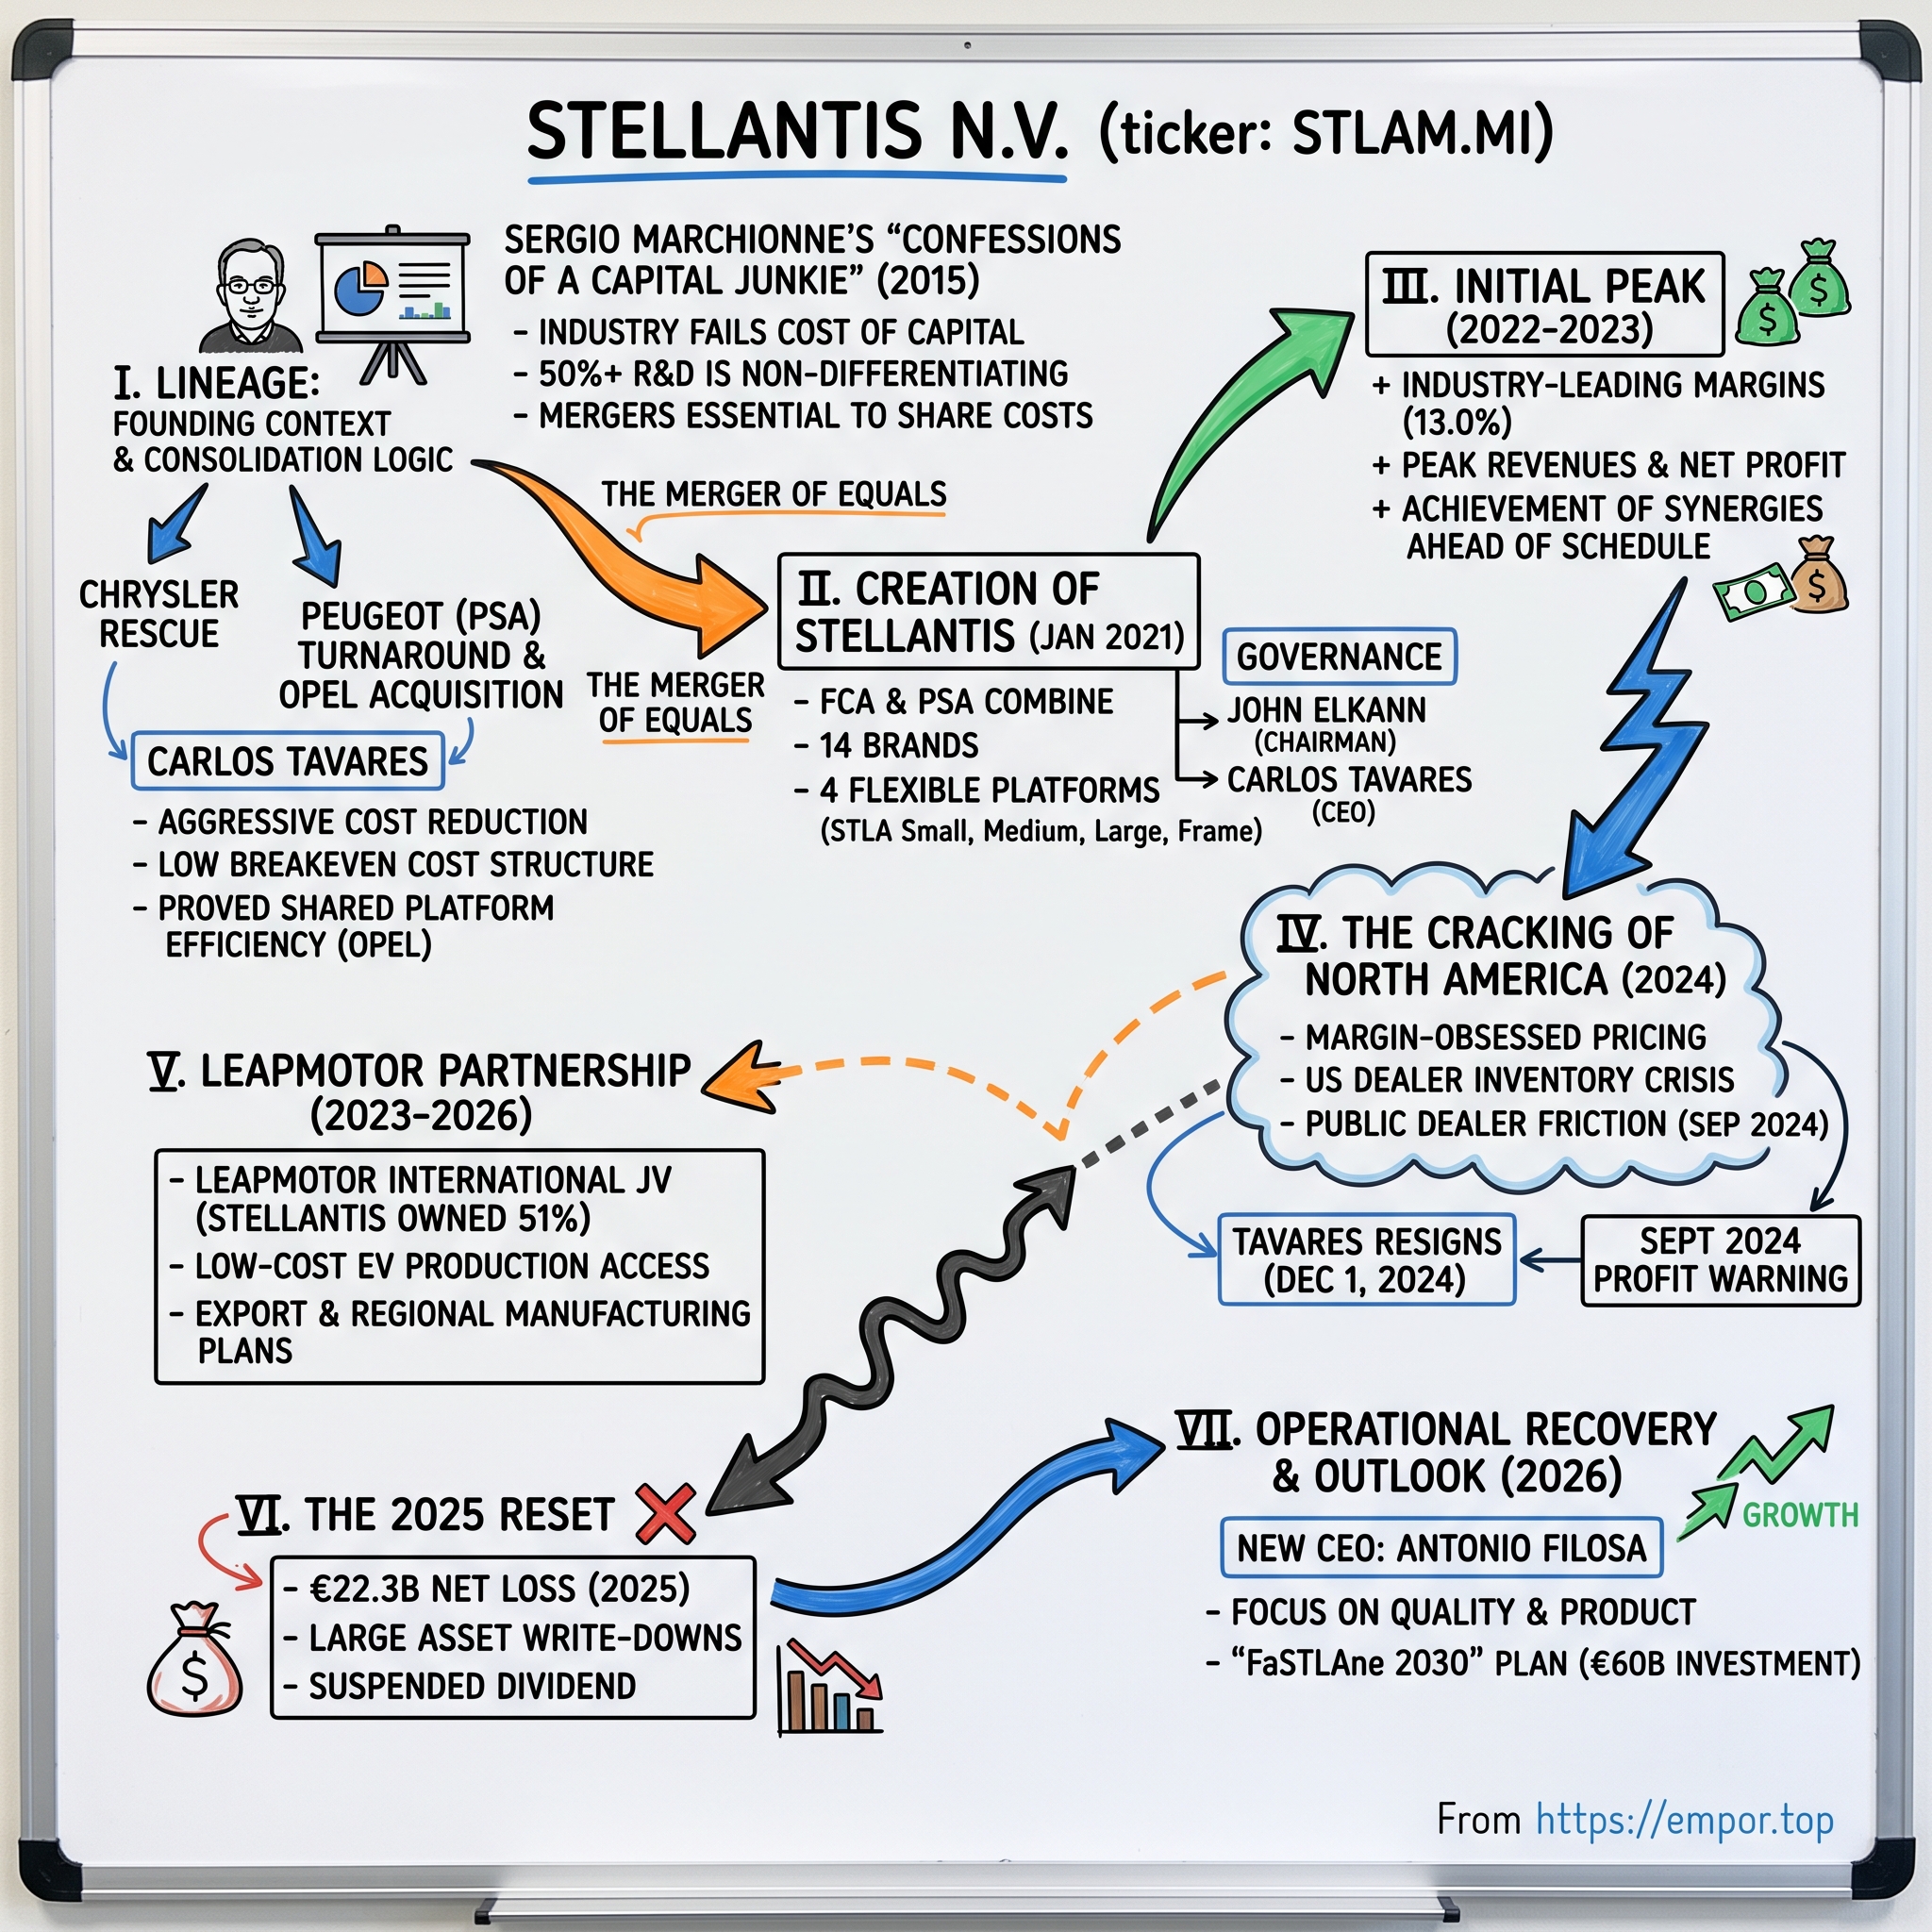
On the morning of July 30, 2026, Stellantis reported second-quarter results that reflected a stark transformation from its financial standing four years prior. Second-quarter revenue reached €43.5 billion, a 13% increase, while vehicle shipments rose 10% to roughly 1.6 million units. Net profit turned positive at €0.3 billion, recovering from a €1.9 billion loss in the second quarter of 2025, and industrial free cash flow improved by €1.0 billion year over year to reach €1.0 billion.1
Yet the underlying operating margin for the quarter stood at just 1.8%.1
That figure captures the trajectory of Stellantis. In 2022, the company generated a 13.0% adjusted operating margin—the highest among global volume automakers—and signaled to investors that it had solved the challenge of multi-brand efficiency.2 Four years later, achieving a 1.8% margin represents a meaningful operational recovery, even as it highlights the depth of the preceding decline.
Stellantis N.V. trades on Euronext Milan under the ticker STLAM.MI, with parallel listings in Paris and New York. Formed in January 2021 through the merger of Fiat Chrysler Automobiles and France's Groupe PSA, the company is domiciled in Hoofddorp, the Netherlands—a location selected to maintain neutrality between two national champions that framed the transaction as a merger of equals.3 The group employs roughly 259,000 people across fourteen brands: Jeep, Ram, Dodge, and Chrysler in the Americas; Peugeot, Citroën, Fiat, Opel, Vauxhall, and Abarth in mainstream European markets; Alfa Romeo, DS, and Lancia in the premium segment; and Maserati in luxury.4
The central question surrounding Stellantis is straightforward: How did the world's most profitable mass-market automaker post a €22.3 billion annual loss—the largest in modern European automotive history—within thirty-six months?5 Broader market conditions alone do not explain the shift, as peers like Toyota and General Motors avoided losses of that magnitude. The reversal stemmed from specific strategic and operational decisions.
This analysis examines that trajectory across several distinct phases. It begins with the lineage: two distressed automakers rescued by different leadership styles, underpinned by Sergio Marchionne's 2015 presentation, "Confessions of a Capital Junkie," which argued that consolidation was essential for an industry failing to earn its cost of capital.6 Next is the merger and the operational model established under Carlos Tavares, which created an exceptionally low breakeven cost structure that initially converted incremental volume into high profitability.
The narrative then evaluates the group's regional architecture, where North American truck and SUV earnings effectively subsidized European volume operations alongside profitable South American business units. That model unravelled during the 2024 U.S. inventory crisis, which triggered dealer friction, a severe profit warning, and the resignation of Tavares on December 1, 2024.7 To address structural cost disadvantages, Stellantis acquired a €1.5 billion stake in Chinese EV manufacturer Leapmotor (零跑汽车) and established a joint venture to leverage lower-cost production platforms.8
Finally, the central investment thesis remains contested: whether a conglomerate managing fourteen brands on shared platforms can navigate softening Western demand while facing low-cost Chinese electric vehicle competition. Management has put forward a €60 billion strategic framework titled FaSTLAne 2030.9 Investors remain cautious, with shares trading near multi-year lows and analysts lowering price targets to as low as €4.10
Understanding the severity of this downturn requires examining the factors that drove the company's rapid rise—a process that began with an executive who challenged the fundamental capital efficiency of the global auto sector.
 Subscribe on LinkedIn
II. The Lineage & Founding Context: From Bankruptcy to Consolidation
On April 29, 2015, Sergio Marchionne, then chief executive officer of Fiat Chrysler Automobiles (FCA), presented a stark critique of the global automotive sector to institutional investors, using his own company to illustrate systemic capital inefficiency across the industry.
The 26-slide presentation was titled Confessions of a Capital Junkie: An insider perspective on the cure for the industry's value-destroying addiction to capital.6 Marchionne outlined a fundamental structural issue: the auto industry failed to earn its cost of capital over economic cycles, making consolidation essential to remedy the problem. He explicitly noted that the presentation was neither an excuse for FCA's competitive standing nor an indication that the company was for sale.
Marchionne's core argument centered on product development efficiency. In a typical vehicle program, approximately 40% of spending went to vehicle R&D, 35% to tooling, and 15% to powertrain R&D. Yet he estimated that only 45% to 50% of development costs created features discernible to buyers. The remaining 50% to 55% was spent on non-differentiating components that were potentially overlapping with what competitors were building at the same moment, in the same segment, at similar cost.6
To illustrate the industry's capital consumption, Marchionne calculated the years of capital expenditure and R&D required for various sectors to reinvest an amount equal to their enterprise value. While industries such as aerospace, pharmaceuticals, telecommunications, and consumer retail averaged roughly twenty years, mainstream automakers reinvested their entire enterprise value every four years. Despite this rapid reinvestment rate, mainstream automakers over the decade through 2014 persistently generated returns on invested capital below a consensus cost of capital of roughly 9%.6
The implication was clear: automakers were committing massive capital to customer-invisible engineering without generating returns above their cost of capital. Marchionne proposed industry-wide consolidation to reduce platform counts, share non-differentiating development costs, and maximize scale per architecture. Although his merger overtures were rejected by competitors—including the board of General Motors—the logic established the intellectual foundation for Stellantis following his death in July 2018.
Marchionne had already demonstrated the consolidation model on a smaller scale. When Fiat acquired control of a bankrupt Chrysler during the 2009 U.S. government-backed restructuring, it did so without an initial cash injection, contributing small-car technology and platform access in exchange for equity before earning full ownership. Strategically, Marchionne redirected capital away from Chrysler's unprofitable sedan operations toward Jeep and Ram. Because off-road SUVs and full-size pickups commanded higher pricing power and contribution margins than compact cars, the American operation generated steady cash flow that supported Fiat's unprofitable European business during the eurozone crisis.
A parallel rescue unfolded in Europe under a different operational strategy. Peugeot S.A. (PSA) entered 2014 near insolvency following six consecutive years of European automotive market contraction. The company was recapitalized through a three-way structure involving the French state, the Peugeot family, and China's Dongfeng Motor, each acquiring equal stakes. To execute the restructuring, PSA hired Carlos Tavares, a former Renault chief operating officer who had departed after publicly expressing his executive ambitions.
Under strategic plans titled "Back in the Race" and "Push to Pass," Tavares systematically reduced fixed costs across PSA. He consolidated vehicle platforms, standardized components, renegotiated supplier contracts, and lowered the group's breakeven volume threshold so that PSA could maintain profitability through cyclical downturns.
In March 2017, PSA agreed to acquire Opel and Vauxhall from General Motors for €1.3 billion for the automotive operations, plus €0.9 billion for GM Financial's European operations acquired jointly with BNP Paribas—a €2.2 billion total transaction for a business with six assembly plants, five component facilities, an engineering center in Rüsselsheim, and roughly 40,000 employees.11 The European business had generated losses for General Motors every single year since 1999.12
PSA targeted €1.7 billion in annual synergies by 2026, setting Opel/Vauxhall a goal of a 2% recurring operating margin by 2020 rising to 6% by 2026.11 Tavares restored Opel to profitability ahead of schedule by eliminating duplicated engineering, migrating Opel models onto PSA platforms, consolidating purchasing, and prioritizing margin over unprofitable market share.
The integration of Opel served as operational proof that a distressed European carmaker could return to profitability on shared platform architectures. It converted Marchionne's consolidation theory into a demonstrated execution model, paving the way for the larger combination that followed.
III. The Creation of Stellantis: The 50/50 Mega-Merger
The strategic rationale for combining Fiat Chrysler Automobiles and Groupe PSA was straightforward, reflecting clear operational synergies alongside substantial integration risks.
Fiat Chrysler possessed what PSA lacked: a profitable North American footprint, where Jeep and Ram generated the highest per-unit earnings across the combined group, while PSA had been absent from the United States since the early 1990s. Conversely, PSA offered efficient small- and mid-size vehicle architectures and an established electrification roadmap for Europe's tightening regulatory environment—areas where FCA's sub-scale European operations lagged behind. In essence, FCA contributed the immediate profit pool, while PSA provided platform efficiency and engineering discipline.
Following initial discussions in late 2019, the merger became effective on January 16, 2021, with shares trading on Euronext Paris, Euronext Milan, and the New York Stock Exchange under the ticker STLA.3 Structured as a fifty-fifty share exchange framed as a merger of equals, the transaction balanced political and corporate sensitivities across France and Italy.
The governance settlement divided leadership between the two core factions. John Elkann, chairman of Fiat's founding family holding company Exor, became chairman of Stellantis, while Carlos Tavares assumed the role of chief executive officer. This arrangement paired Exor's board leadership with PSA's operational management team.
The reference shareholder structure established at founding remained highly concentrated. As of February 25, 2026, Exor N.V. held 15.48% of issued common shares, Établissements Peugeot Frères held 7.72%, and the French state's investment vehicle, Bpifrance Participations, held 6.64%.4 However, a loyalty voting mechanism granting double voting rights to long-term investors provided Exor with 23.84% of total voting power, EPF with 11.89%, and Bpifrance with 10.22%.4 Together, these three core shareholders held approximately 46% of voting control with under 30% of economic ownership, insulating management from external shareholder activism and concentrating governance power within Exor and the Peugeot family. Meanwhile, China's Dongfeng Motor, which had participated in PSA's 2014 bailout, completed an orderly exit around the time of the transaction.
Management targeted €5.0 billion in annual run-rate synergies, projecting that 80% would be realized by the fourth year while committing not to close any assembly plants.13 That political constraint required savings to be extracted from platform rationalization, consolidated purchasing, shared powertrains, and administrative overhead. Stellantis began consolidating a wide range of legacy architectures into four flexible, multi-energy platforms: STLA Small, STLA Medium, STLA Large, and STLA Frame.
This modular platform strategy operationalized Marchionne's consolidation thesis. By standardizing underlying engineering elements—such as floorpans, electrical architectures, suspension mounting points, and powertrain interfaces—across multiple brands and market segments, Stellantis amortized non-differentiating development costs across higher aggregate vehicle volumes, transforming substantial fixed R&D expenses into a lower unit-cost structure.
Immediately following the integration, macroeconomic tailwinds amplified this cost structure. The post-pandemic global semiconductor shortage severely restricted vehicle production just as consumer demand rebounded. Reduced dealer inventory eliminated traditional promotional discounting and expanded manufacturer pricing power. Because Tavares had systematically lowered the group's breakeven threshold, Stellantis possessed strong operational leverage, allowing incremental price increases to flow directly to operating margins.
Financial performance accelerated rapidly. In 2022, Stellantis reported net revenues of €179.6 billion, adjusted operating income of €23.3 billion—representing a 13.0% margin—net profit of €16.8 billion, and industrial free cash flow of €10.8 billion.2 Management also disclosed that the group had already achieved €7.1 billion in net cash synergies, exceeding its original €5.0 billion annual target more than two years ahead of schedule.2 Results expanded further in 2023, with revenues reaching €189.5 billion, adjusted operating income rising to €24.3 billion at a 12.8% margin, net profit climbing to €18.6 billion, and industrial free cash flow increasing to €12.9 billion.14
Capital distributions kept pace with profit growth. For full-year 2023, Stellantis returned €6.6 billion to shareholders through dividends and share repurchases, proposed a dividend of €1.55 per share, and announced a new €3.0 billion buyback program for 2024.14 In February 2024, leadership reiterated a minimum commitment to maintain a double-digit adjusted operating margin for the full year 2024.14
In retrospect, the 13% adjusted operating margin achieved in 2022 and 2023 represented an exceptional peak for a mass-market automaker. While merger-related cost reductions provided genuine structural efficiency, a significant portion of those profits reflected temporary industry supply constraints that suspended normal price competition. Treating these cyclical earnings as a permanent baseline proved to be a critical miscalculation for management and capital markets alike. Understanding how those peak earnings were generated—and where structural vulnerabilities began to form—requires examining the group's regional architecture.
IV. Segment Architecture & Economic Proportionality
There is a version of Stellantis that exists only in the segment tables of its financial filings, distinct from its corporate presentation narratives.
At the company's operational peak in 2023, North America generated €86.5 billion in revenue and €13.3 billion in adjusted operating income—yielding a 15.4% segment margin.15 Across all six reportable segments, group adjusted operating income totaled roughly €25.3 billion before corporate items, meaning North America accounted for approximately 46% of total revenue and more than half of segment profits. Meanwhile, Enlarged Europe generated €66.6 billion in revenue and contributed €6.5 billion in adjusted operating income at a 9.8% margin.15 Together, these two regions formed the vast majority of the business, leading public markets to view the remaining operations as secondary.
Disaggregating those figures reveals the underlying structural reality of the company. North America did not achieve its financial dominance through volume; it shipped substantially fewer vehicles than Europe, but sold them at vastly higher transaction prices and content levels. Full-size Ram 1500 pickups alongside Jeep Grand Cherokees and Wagoneers commanded price multiples over compact European models like the Citroën C3, while the incremental cost of premium trims, larger powertrains, and extended wheelbases represented only a fraction of their retail price premiums. This dynamic has made full-size trucks and body-on-frame SUVs the primary profit engine for Detroit automakers for decades.
This structural concentration created a fundamental vulnerability. With over half of corporate operating profit tied to a single geographic market and a small portfolio of light-truck nameplates, overall profitability depended almost entirely on sustained pricing power for those specific vehicles. Rather than functioning as a broadly diversified global automaker, the enterprise operated essentially as an American truck manufacturer with international volume operations attached.
Enlarged Europe performed the opposite structural role. It provided the necessary volume—through high-selling models such as the Peugeot 208, Fiat 500, Citroën C3, and Opel Corsa—generating scale for purchasing organizations and driving platform cost amortization. Operating margins in Europe remained structurally lower due to broader market dynamics rather than operational execution alone: European consumers paid lower average transaction prices, market competition remained highly fragmented, and regional fleet-emissions mandates required manufacturers to sell electrified models at compressed margins. Consequently, European operations yielded high single-digit margins during industry cyclical peaks, and significantly lower returns during broader market downturns.
By contrast, South America delivered strong operational profitability that received less capital market attention. In 2023, the segment produced €16.1 billion in revenue and €2.4 billion in adjusted operating income—a 14.8% margin that comfortably exceeded Europe's return and approached North America's level.15 Stellantis maintained market leadership in Brazil and Argentina, leveraging Fiat's historical manufacturing footprint and dealer network alongside a product lineup tailored to regional purchasing power, such as the Fiat Strada pickup and Cronos sedan. The Middle East & Africa segment achieved even higher unit economics: generating €2.5 billion in adjusted operating income on €10.6 billion in revenue for a 23.7% margin, supported by North African localization and Turkish production through the Tofaş joint venture.15
These regional results demonstrated a key principle in automotive economics: establishing dominant local market share with products specifically tailored to regional price points often yields superior margins compared to competing as a middle-tier player in crowded, highly competitive developed markets.
In Asia Pacific and China, the group pursued a strategic retreat. Stellantis' initial China ambitions largely dissolved following the breakdown of its GAC-Jeep joint venture, leaving the region to contribute under €2 billion in annual revenue.5 Management subsequently transitioned to an asset-light strategy across Asian markets—a shift that minimized capital exposure as domestic electric vehicle manufacturers eroded foreign legacy automakers' market share in China.
Maserati represented the smallest and most financially troubled segment. In 2023, the luxury brand generated €2.3 billion in revenue and €141 million in adjusted operating income.15 By 2025, revenue contracted to €726 million, resulting in an adjusted operating loss of €198 million as vehicle shipments fell from 11,000 units to 8,000.5 Shipping only 8,000 units annually impaired the brand's ability to cover its fixed engineering and manufacturing overhead. The contrast with Ferrari—which was spun off from the same historic Agnelli family holding structure—remained sharp, as Ferrari maintained higher shipment volumes alongside industry-leading operating margins and profitability.
By 2025, the group's regional profit structure experienced a severe reversal.
In North America, revenue fell to €61.0 billion, resulting in an adjusted operating loss of €1.9 billion—a negative 3.1% margin compared to a positive 4.2% margin in 2024.5 Enlarged Europe generated €57.8 billion in revenue but posted an operating loss of €651 million.5 The two core geographic segments that together generated approximately €20 billion in operating profit in 2023 recorded a combined €2.5 billion loss two years later.
In contrast, non-Western operations demonstrated relative stability. The Middle East & Africa segment generated €1.4 billion in operating profit on €9.7 billion in revenue, while South America generated €2.0 billion on €16.2 billion.5 The regional operations previously characterized by management as a supplementary "third engine" proved to be the group's sole profitable divisions during its steepest operational downturn.
This structural shift challenged the core investment thesis presented during peak earnings years. The high-margin North American core proved highly sensitive to volume and inventory cycles, whereas the peripheral operations—supported by localized production and regional market dominance—demonstrated greater earnings resilience. As a result, evaluating Stellantis' long-term earnings capacity requires treating North American margins as highly variable, while recognizing the disproportionate stabilizing role played by South America and the Middle East & Africa relative to their revenue shares.
This shift underscores a broader strategic inquiry: what structural competitive advantages remain to protect the company's market position?
V. Core Business Deep Dive: Industry Structure, 7 Powers, & 5 Forces
Consider two engineers—one in Rüsselsheim, Germany, and another in Auburn Hills, Michigan—designing a rear suspension knuckle during the same month for vehicles that will never compete directly against one another. Multiply that inefficiency across every unglamorous component in a modern vehicle, and then across fourteen distinct brands. The core strategic case for Stellantis rests on preventing that duplication—ensuring that a single component is engineered once and deployed across millions of vehicles wearing different badges.
Evaluating the business through Hamilton Helmer's 7 Powers framework highlights where this strategy succeeds and where structural vulnerabilities emerge.
Scale economies represent the group's most durable advantage. Amortizing platform, powertrain, and software development costs across roughly 5.5 million units annually provides a structural advantage over smaller competitors, reflecting the same mechanism PSA utilized to restore Opel's profitability. This efficiency materialized in synergy execution, with net cash synergies reaching €7.1 billion against an initial €5.0 billion annual target, achieved well ahead of schedule.2 However, scale is a relative power. Stellantis' competitive set includes Toyota, producing over 10 million units annually, alongside vertically integrated Chinese manufacturers operating with lower battery supply costs. Scale remains a necessity in the global auto industry, but it is no longer a guarantee of market leadership.
Process power—the embedded organizational capability to execute complex operational tasks better than rivals—proved to be the group's most fragile asset. The operating model under Carlos Tavares relied on rigorous internal plant cost benchmarking, aggressive supplier contract renegotiations, footprint rationalization, and strict inventory discipline. While this system initially delivered industry-leading margins, process power centered on top-down executive directives carries inherent operational risks when efficiency measures compromise product engineering. The financial consequences emerged in the 2025 annual results through a €4.1 billion adjustment to warranty provisions, driven by cost inflation and quality deterioration.16 Aggressive cost reduction strategies that squeeze engineering and supplier quality rarely trigger immediate failure; instead, the financial toll surfaces several product cycles later in rising warranty liabilities.
Cornered resource applies to two specific geographic assets. In South America, the group's manufacturing footprint and established distribution network across Brazil and Argentina cannot be easily replicated by competitors at a reasonable cost. In the United States, the group benefits from a legally protected, state-by-state dealer franchise network. While this retail network represents a critical commercial asset, it also functions as an independent constituency capable of exerting significant public pressure on executive leadership, as demonstrated during the 2024 inventory dispute.
Branding yields uneven competitive strength across the portfolio. Jeep maintains global pricing power, commanding premium margins on models such as the Wrangler, while Ram retains strong brand equity in the North American pickup market. Conversely, European heritage labels such as Lancia, DS, and Alfa Romeo have struggled to generate consistent returns. Under the FaSTLAne 2030 strategic plan announced in May 2026, management addressed this imbalance by concentrating capital: four global brands—Jeep, Ram, Peugeot, and Fiat—will receive 70% of future investment, while Chrysler, Dodge, Citroën, Opel, and Alfa Romeo will be managed regionally, and DS and Lancia will be repositioned as specialty lines overseen by Citroën and Fiat, respectively.9 This capital allocation strategy establishes a clear brand hierarchy, though it defers broader decisions regarding brand rationalization.
Applying Michael Porter's Five Forces framework illustrates the intensifying structural pressure across the global auto industry.
Threat of new entrants has altered the European competitive landscape dramatically. Chinese automakers captured a record 10.7% of European Union new-car sales in May 2026, bringing their year-to-date market share to 10.6%—nearly double their share from the prior year.17 Five Chinese automotive groups delivered more than 619,000 vehicles across the EU, EFTA, and UK during the first five months of 2026, led by SAIC Motor's MG brand with over 141,000 units, BYD with over 135,000 units, and Chery Automobile with nearly 123,000 units.17 Rather than relying solely on battery-electric exports subject to EU tariffs of up to 45%, these manufacturers pivoted rapidly to hybrid powertrains, capturing approximately one-quarter of all hybrid and plug-in hybrid sales in the European Union.17 This strategic shift highlights the limitations of tariff-based trade barriers in protecting domestic markets. In contrast, stringent U.S. tariffs and regulatory hurdles have effectively restricted Chinese entrants from the American market, preserving North America as a more insulated profit pool for legacy manufacturers.
Buyer power has expanded significantly as vehicle supply normalized. The strong pricing power automakers enjoyed from 2021 through 2023 resulted from pandemic-era inventory shortages. As dealer lots replenished and elevated interest rates increased monthly vehicle payments, consumer price sensitivity returned. When mid-size SUVs reach price thresholds above $70,000, retail buyers increasingly resist dealer markups or defer purchases entirely.
Rivalry among existing competitors remains intense across key developed markets. General Motors, Ford, Toyota, Volkswagen, Hyundai Motor Group, and Renault are competing aggressively for Western market share. Toyota's established leadership in hybrid powertrains has proven particularly advantageous as consumer demand for fully electric vehicles moderates.
Bargaining power of suppliers presents a distinct operational vulnerability created in part by internal procurement policies. Prolonged, aggressive cost squeezes on component suppliers yield immediate margin improvements but risk long-term supply chain friction, program delays, and commercial disputes. The group's 2025 financial statements recorded a dedicated supplier provision that management cited as a primary driver of elevated South American industrial costs,18 while first-quarter 2026 cash flow reflected a further €700 million impact from ongoing supply claims.19 Squeezing supplier margins ultimately shifts costs into future operational cycles, introducing unquantified financial liabilities.
Combining these frameworks yields a clear strategic diagnosis. Stellantis possesses a genuine advantage in platform and purchasing scale, yet it operates within an industry structure characterized by intensifying competitive pressures across nearly every operational dimension. This dynamic does not rule out financial recovery, but it requires that any positive investment thesis rely on internal operational execution rather than structural market protection, which has proven less resilient than peak 2022 operating margins suggested.
The severe operational disruption of 2024 demonstrated the vulnerability of relying on temporary industry pricing tailwinds rather than enduring structural advantages.
VI. The 2024–2025 Operational Crisis & Unraveling
On September 10, 2024, Kevin Farrish, chairman of the Stellantis National Dealer Council, sent an open letter to Carlos Tavares. Dealer councils exist to manage friction quietly. Publishing a letter is the equivalent of a board resignation with a press release attached.
The letter accused Tavares of "reckless short-term decision-making" that had produced "devastating" consequences for the Jeep, Dodge, Ram and Chrysler brands, whose combined US market share the dealers said had been cut nearly in half.20 It asked for two things that were, in retrospect, exactly right: clear out the aged inventory, and get the plants building vehicles Americans actually want and can afford. Stellantis responded within a day, taking "absolute exception" to the letter and countering with metrics — August sales up 21% versus July, market share up 0.7 points, dealer stock down about 10% over two months.20
Rebutting your own distribution network in public, with a monthly sales statistic, is the tell. It signals a management team that has diagnosed a strategic problem as a communications problem.
The underlying failure had been building for three years, and it had a clean mechanical logic. During the semiconductor shortage, Stellantis pushed US pricing harder and faster than its Detroit and Japanese peers, optimising for margin percentage rather than for share. Simultaneously it thinned the bottom of the range, discontinuing accessible nameplates — including the Jeep Cherokee, which sat in the mid-size SUV segment, the largest vehicle segment in the world — without lower-cost replacements ready. The combination systematically evacuated the middle-class buyer from the showroom.
When supply normalised, the arithmetic reversed. Stellantis was left with lots full of high-trim, high-price, model-year-old vehicles in a market that had rediscovered choice. Dealer inventory ballooned, floorplan financing costs mounted, and every week of delay made the eventual discount deeper.
The reckoning came on September 30, 2024. Stellantis cut its 2024 adjusted operating margin guidance to 5.5–7.0%, from the "double digit" commitment it had reiterated in February.21 Industrial free cash flow guidance flipped from positive to negative €5 billion to €10 billion.21 The company disclosed it was accelerating inventory normalisation, targeting no more than 330,000 units of US dealer stock by year-end, and cutting second-half shipments by more than 200,000 vehicles — double the reduction previously flagged.21 Roughly two-thirds of the margin destruction was attributed to the North American corrective actions themselves.21
Read that carefully, because it is the crux. The majority of the profit collapse was not caused by weak demand. It was caused by the cost of fixing a self-inflicted inventory position. The company was paying to undo its own strategy.
Two months later, on December 1, 2024, the board accepted Tavares' resignation with immediate effect.7 The framing in the release was unusually candid for a governance statement. Henri de Castries, the senior independent director, noted that Stellantis' success "has been rooted in a perfect alignment between the reference shareholders, the Board and the CEO" and that "in recent weeks different views have emerged which have resulted in the Board and the CEO coming to today's decision."7 Elkann thanked Tavares for his role in creating Stellantis and in the previous turnarounds of PSA and Opel.7 Elkann took the chair of a new Interim Executive Committee, and a permanent successor was promised in the first half of 2025.7
The full-year 2024 results, published in February 2025, quantified the damage: net revenues of €156.9 billion, down 17%; adjusted operating income of €8.6 billion at a 5.5% margin, down 64%; net profit of €5.5 billion, down 70%; and negative industrial free cash flow of €6 billion.22 US dealer stock finished at 304,000 units, beating the 330,000 target.22 The board still proposed a dividend of €0.68 per share.22
Then 2025 got worse, and for a different reason.
On May 28, 2025, Stellantis named Antonio Filosa as chief executive, effective June 23.23 Filosa was an internal appointment in the most literal sense: he joined Fiat Group in 1999, spent his career across Latin America and North America, ran the Jeep brand globally, and was serving as chief operating officer for the Americas and chief quality officer when appointed. He holds an engineering degree from Politecnico di Milano and an executive MBA from Fundação Dom Cabral in Brazil.23 The symbolism was deliberate — after a French-Portuguese cost engineer, an Italian product-and-quality operator who had actually run the region that broke.
He inherited a tariff war. The United States imposed 25% tariffs on imported vehicles and parts, and Stellantis builds a substantial share of its US-sold Chrysler, Dodge and Jeep vehicles in Canada and Mexico. In July 2025 the company estimated the 2025 net tariff impact at roughly €1.5 billion, about $1.7 billion, of which only €0.3 billion had been incurred in the first half.[^24] Most of the pain was still ahead.
Filosa's response was to place a very large bet on American manufacturing. On October 14, 2025, Stellantis announced a $13 billion US investment over four years — the largest in its 100-year US history — to add more than 5,000 jobs and raise annual US finished-vehicle production by 50%.24 The plan included reopening the shuttered Belvidere, Illinois plant with over $600 million to build the Jeep Cherokee and Compass from 2027, $400 million at Toledo for an all-new midsize truck in 2028, and further investment at Warren and Detroit in Michigan and Kokomo in Indiana.24 It also committed to five new vehicles and nineteen additional product actions through 2029.24
And then, on February 6, 2026, came the reset that redefined the company's balance sheet.
Stellantis took approximately €22.2 billion in charges in the second half of 2025, of which roughly €6.5 billion would be paid in cash over four years.16 The largest component — €14.7 billion — related to realigning product plans with customer preferences and changed US emissions regulation, including €2.9 billion of write-offs for cancelled products and €6.0 billion of platform impairments.16 A further €2.1 billion covered EV supply-chain and battery capacity rationalisation. The remaining €5.4 billion comprised the €4.1 billion warranty provision reassessment and €1.3 billion of European restructuring.16 The single most symbolically loaded decision inside it: the cancellation of the Ram 1500 battery-electric pickup.16
The board suspended the 2026 dividend and authorised up to €5 billion of perpetual hybrid bonds to shore up the balance sheet.16 The market's verdict was immediate — the shares fell around 25% on the day.
Full-year 2025 closed with net revenues of €153.5 billion, an adjusted operating loss of €842 million at a margin of negative 0.5%, a net loss of €22.3 billion including €25.4 billion of total charges, and negative industrial free cash flow of €4.5 billion.5 Diluted loss per share was €7.75.5
The essential thing to understand about that €22 billion is that most of it was non-cash. It was the accounting recognition that a decade of electrification capital — platforms, battery contracts, product programmes — had been committed against a demand curve and a regulatory curve that did not materialise. As Filosa put it in the results release, the numbers reflected "the cost of over-estimating the pace of the energy transition."5 That is an honest sentence. It is also an expensive one, and it was written by a management team about decisions made largely by its predecessor.
Which brings the story to the question of what, exactly, gets built with the capital that remains.
VII. Capital Deployment & M&A Benchmark
Evaluating an acquisition's ultimate success is rarely possible at closing. For Groupe PSA's acquisition of Opel, that moment arrived around 2019, when a business that had lost money for General Motors every year since 1999 began generating cash.12 Retaining the brand and dealer network while migrating vehicles onto shared platforms to lower fixed costs allowed PSA to rapidly recover the €2.2 billion purchase price, establishing the operational template for Stellantis.11
The merger of Fiat Chrysler Automobiles and Groupe PSA applied that operational template at scale, exceeding its initial cash synergy target well ahead of schedule.2 However, a critical distinction exists between financial engineering and commercial performance. Synergy metrics track cost reduction; they do not measure whether a combined automaker develops appealing products, preserves distribution relationships, or maintains brand quality. While Stellantis executed its cost-reduction framework effectively, its commercial strategy in North America proved flawed. The merger's financial integration succeeded, but its commercial execution unravelled.
Against that backdrop, the group's most consequential capital deployment involved an unconventional approach to emerging competition in Asia.
On October 26, 2023, Stellantis announced a €1.5 billion investment to acquire an initial 20% equity stake in Chinese electric vehicle manufacturer Leapmotor (零跑汽车) alongside two board seats.8 The stake eventually settled at 21.26%. Simultaneously, the two companies established Leapmotor International—a joint venture owned 51% by Stellantis and 49% by Leapmotor—with exclusive rights to export, sell, and manufacture Leapmotor vehicles outside Greater China.8
This strategy inverted the traditional response of Western automakers to low-cost Chinese competition. Rather than relying solely on trade protectionism or attempting to match Chinese production costs with European engineering, Stellantis acquired distribution rights to an established low-cost manufacturing architecture. At the time of the announcement, Carlos Tavares stated that Stellantis was taking "a leading role in supporting the global expansion plans of Leapmotor, one of the most impressive new EV players."8 In effect, the arrangement allowed Stellantis to deploy competitive electric vehicles internationally while capturing the majority of export distribution profits.
Initial execution surpassed market expectations. Leapmotor shipped roughly 50,000 units through the partnership during its first full year in 2025,18 followed by 24,000 units in the first quarter of 2026.19 During the first-quarter 2026 earnings call, Chief Executive Antonio Filosa reported that the joint venture was profitable, generating strong per-unit margins on battery-electric models driven by product positioning and technology integration.19 Addressing analyst concerns regarding potential cannibalization of core European brands such as Citroën, Peugeot, and Opel, Filosa cited customer survey data indicating "very, very, very limited" sales overlap, noting that all major European brands expanded volume during the quarter alongside Leapmotor.19 While cannibalization risks may increase as export volumes scale, initial operational data supported management's positioning.
On May 8, 2026, the partnership expanded into localized European manufacturing. Stellantis and Leapmotor announced plans to assemble a Leapmotor C-SUV in Zaragoza, Spain, and allocate an additional model to the Villaverde plant in Madrid, potentially replacing Citroën C4 production starting in 2028.25 The partners also agreed to expand joint procurement to leverage the Chinese electric vehicle supply ecosystem while maintaining regional supply chain resilience.25 Assembling vehicles within the European Union serves a dual purpose: it mitigates potential import tariffs on Chinese-manufactured EVs and absorbs excess capacity at underutilized European assembly plants.
This capacity rationalization aligns with the group's broader capital allocation strategy. At its Investor Day in Auburn Hills on May 21, 2026, Stellantis presented FaSTLAne 2030, a €60 billion, five-year investment framework.9 Of the €36 billion allocated to brand and product development, 60% is directed toward North America to fund eleven new vehicles, target a 35% volume increase, and expand market coverage by 50%.9 Over €24 billion—representing roughly 40% of total R&D and capital expenditure—is designated for platforms, powertrains, and technology, with the objective of consolidating half of global production onto three core architectures by 2030, including a new STLA One platform.9
The updated powertrain roadmap marks a significant shift from prior strategic commitments. The revised portfolio targets 29 battery-electric models, 15 plug-in hybrids and range-extended vehicles, 24 conventional hybrids, and 39 internal-combustion or mild-hybrid offerings.9 By contrast, the Dare Forward 2030 plan introduced in March 2022 targeted a 100% battery-electric sales mix for passenger cars in Europe and 50% in the United States, supported by over 75 BEV nameplates and 400 gigawatt-hours of battery capacity.26 The capital required to write down and retool those aggressive electrification assumptions accounts for the majority of the €14.7 billion product-plan impairment recorded in late 2025.
Simultaneously, Stellantis is restructuring its European operational footprint, aiming to reduce regional assembly capacity by over 800,000 units and raise plant utilization from 60% to 80% by 2030 through site repurposing, such as at Poissy, and strategic industrial partnerships.9 Management also aims to compress vehicle development cycle times from 40 months to 24.9 Beyond Leapmotor, the group's external alliance network has broadened to include a joint venture with Dongfeng producing four models, an exploratory partnership with Tata Motors across Asia-Pacific, the Middle East, Africa, and South America, and a potential product and technology collaboration with Jaguar Land Rover in the United States.9
The revised capital allocation strategy reflects a pragmatic recalibration: directing investment toward proven profit pools, leveraging external partnerships where internal development is cost-prohibitive, and downsizing legacy capacity where structural demand has contracted. Whether executive leadership can execute this strategy while navigating intense competitive pressures across North America and Europe remains the central open question for the group.
VIII. Hidden & Speculative Businesses: Proportional Economic Sizing
Buried inside every large automaker is a portfolio of adjacent businesses that generate more slides than euros. Stellantis is no exception, and rigorous financial analysis requires sizing these operations properly rather than treating each one as an embedded option worth a tech-company multiple.
The most economically significant of these initiatives is Leapmotor International, which differs fundamentally from typical adjacencies by directly addressing a core competitive gap. Stellantis currently cannot produce an entry-level battery-electric vehicle in Europe at costs competitive with Chinese manufacturers—a challenge shared across most Western automakers. The joint venture fills this product gap immediately under a 51% profit share without requiring Stellantis to fund the underlying technology development. The optionality includes European manufacturing beginning in the second half of 2026, followed by South American production at Pernambuco in Brazil.18 However, this structure carries an underappreciated strategic risk: Stellantis is building global distribution scale for an independent partner whose technology remains the primary differentiator. Should the partnership deteriorate or should Leapmotor decide to build direct European distribution, economic value could shift away from Stellantis.
Free2move functions as the group's mobility services division, encompassing car-sharing, subscription services, vehicle rental, and fleet management. Management reported compound annual revenue growth of roughly 99% between 2021 and 2024 alongside positive operating profits, backed by a software-as-a-service platform supporting over 3,600 franchise partners and managing an additional 35,000 vehicles.27 While a near-doubling of annual revenue indicates rapid expansion, this growth originates from a baseline too small relative to the group's €153.5 billion net revenues to materially influence consolidated results. Consequently, its financial performance remains grouped within "Other activities" rather than disclosed as a standalone reportable segment.
Mobilisights, established as a dedicated business unit in January 2023, monetizes connected vehicle data through fleet analytics, insurance telematics, and digital mobility services, drawing from a connected fleet of 13.8 million vehicles.28 Stellantis stated that software and connected services revenue expanded roughly 2.5 times between 2021 and 2024, as global active subscribers reached five million.27 The underlying technology architecture—comprising STLA Brain for centralized computing, STLA SmartCockpit for user interfaces, and STLA AutoDrive for automated driving assistance—is scheduled to launch in 2027, with management targeting implementation across 35% of global vehicle volumes by 2030 and over 70% by 2035.9
Evaluating these ventures requires separating strategic ambition from current financial reality. When presenting its original Dare Forward 2030 roadmap, Stellantis projected €20 billion in incremental annual software-related revenue by 2030.28 Disclosed performance indicates a trajectory far short of that target, and management has largely stepped back from highlighting the original figure. Currently, connected services and vehicle data monetization represent a modest, high-margin revenue stream attached to a low-margin hardware manufacturing base—a line of business worth monitoring, but insufficient to justify premium valuation multiples. Notably, Stellantis did not separately disclose the specific 2025 revenue contributions of Free2move or Mobilisights.
This outcome mirrors a broader trend across the automotive industry. Between 2020 and 2023, legacy automakers widely promoted projections of high-margin software revenues layered onto traditional manufacturing operations, yet virtually none has delivered those economics at scale. For investors, healthy skepticism remains warranted until software operations provide transparent, standalone revenue and margin reporting—a standard particularly relevant for a company that recently recognized €14.7 billion in product plan write-downs following similarly confident long-term forecasts.
This gap between forward projections and operational delivery shifts the focus directly to executive leadership and the credibility of the team tasked with executing the current recovery.
IX. Management Credibility & Conference Call Audit
The most revealing exchange across recent Stellantis earnings calls occurred on April 30, 2026, when analyst Stuart Pearson of Oxcap Analytics challenged management's narrative. Pearson noted that while year-over-year comparison metrics were improving, the baseline had weakened dramatically throughout 2025, making annual comparisons largely mechanical. He pressed management to clarify directly whether it anticipated sequential, quarter-by-quarter gains in North American profitability and cash flow.19
Chief Executive Antonio Filosa offered an explicit response: "I will try to be as clear as you demanded. So, yes, we expect to improve margins quarter-by-quarter sequentially this year in North America," excluding a one-off tariff refund.19 Second-quarter 2026 results delivered a North American adjusted operating income of €284 million at a 1.6% margin, representing a 480-basis-point improvement over the prior year. However, overall group adjusted operating margin dipped to 1.8% from 2.5% in the first quarter, reflecting the absence of a €400 million tariff credit that benefited first-quarter results.119 Filosa's commitment established an explicit, measurable benchmark for management accountability.
This operational pivot operates alongside a concentrated ownership structure. Exor's controlling voting position provides Chairman John Elkann with significant latitude to pursue long-term strategy without the immediate constraints of quarterly market sentiment.4 Exor's historical record—including the spin-off of Ferrari and the restructuring of CNH Industrial—demonstrates a willingness to execute structural portfolio changes. However, concentrated governance presents trade-offs. The same board that dismissed Carlos Tavares in December 2024 had previously authorized the strategy that precipitated the operational downturn, sanctioned substantial capital returns at peak earnings, and reiterated a double-digit margin commitment in February 2024, just seven months before withdrawing that guidance.1421
The operational model under prior executive leadership relied heavily on aggressive cost extraction across suppliers, dealers, and labor—three core constituencies whose operational friction often manifests with a lag. When these stakeholders eventually pushed back, the financial consequences emerged directly in the financial statements through elevated supplier claims, dealer inventory friction, and a substantial warranty reassessment tied directly to deteriorating product quality.161819
A similar pattern of delayed recognition characterized management's public disclosures during the onset of the crisis. Through the first half of 2024, executive commentary attributed softening North American performance primarily to high interest rates and macroeconomic headwinds. However, industry data showed that competing automakers operating under identical macroeconomic conditions were capturing market share. When management lowered financial guidance in September 2024, internal disclosures revealed that approximately two-thirds of the margin compression stemmed directly from North American inventory corrections and reduced vehicle shipments rather than broader market conditions.21
By contrast, the current executive team has adopted a more transparent approach to balance sheet adjustments. The February 2026 financial reset was presented as a discrete event, featuring an itemized breakdown between cash and non-cash items alongside an explicit acknowledgment that the group had over-estimated the pace of the electric vehicle transition.516 During the February 26 earnings call, Chief Financial Officer João Laranjo addressed questions from ODDO BHF analyst Michael Foundoukidis regarding whether the company's historical average of roughly €3 billion in annual unusual items would persist. Laranjo specified that the majority of charges were absorbed in the second half of 2025, that no additional unusual items were anticipated, and that 2026 restructuring expenses would remain "well below €3 billion."18 This commitment provided investors with a clear, verifiable operational target.
Recent earnings calls highlight ongoing analyst scrutiny regarding underlying operational execution. During the full-year 2025 results presentation, J.P. Morgan analyst Jose Asumendi questioned whether European operations required broader structural restructuring and whether recent market share gains depended excessively on retail incentives.18 Similarly, HSBC analyst Michael Tyndall and Jefferies analyst Philippe Houchois questioned why a roughly €7 billion increase in North American revenue generated lower-than-expected operating profit flow-through. Houchois noted that while General Motors discloses volume and product mix separately, Stellantis combines them, adding that typical revenue flow-through should equal at least 20%.18 Management attributed the lower flow-through to product mix constraints on light- and heavy-duty trucks caused by factory launch delays, which it stated had been resolved.18
While this explanation provides a specific mechanical account rather than a broad macroeconomic generalization, it remains difficult for external observers to verify independently, relying primarily on executive statements that operational bottlenecks were "entirely solved."18 Subsequent quarterly reports will determine whether product mix improvements normalize earnings flow-through.
Executive commentary has been less definitive regarding long-term brand portfolio decisions. During the February 2026 call, UBS analyst Patrick Hummel inquired whether incorporating Maserati into regional reporting indicated an intention to retain the brand long term. Filosa detailed the rationale for regional alignment and deferred further specifics to the May Investor Day.18 In April, Barclays analyst Henning Cosman invited management to address media reports concerning potential partnerships with Chinese manufacturers, European plant capacity reductions, and capital concentration across four core brands. Filosa emphasized the value of managing heritage brands, framed the core challenge as balancing market coverage with capital efficiency, and again referenced the upcoming Investor Day.19 At that event, management confirmed the capital focus on four core brands and established a revised brand hierarchy; however, regarding Maserati, the company outlined only a luxury market positioning, two upcoming E-segment models, and a full strategic roadmap scheduled for December 2026.9
By deferring strategic decisions on a brand that generated just 8,000 unit sales and an operating loss of €198 million in 2025 across three public presentations, management underscored the challenges the group faces in executing rapid portfolio rationalization.5
Management is taking steps to rebuild credibility by adopting more transparent reporting tools. Reintroducing quarterly financial reporting in 2026 responded directly to investor requests, while financial targets have become more conservative and operational setbacks are framed through mechanical rather than macroeconomic explanations.18 Nevertheless, re-establishing executive credibility ultimately depends on sustained operational execution against multi-year strategic targets.
X. Skeptical Investor Stress Test & Current Risk Radar
Imagine an activist investor building a Stellantis position in the summer of 2026. The shares sit near multi-year lows, the balance sheet still carries substantial liquidity, and there are at least four presentations' worth of value-destroying complexity to attack. What would the letter say?
It would start with the brands, because that is the easiest target. Fourteen nameplates. Chrysler has been sustained essentially by a single minivan. Lancia sells almost exclusively in Italy. DS has spent a decade failing to establish premium credentials against German incumbents. Alfa Romeo has consumed capital across multiple ownership eras without achieving durable scale. Maserati is now a loss-making eight-thousand-unit business.5 The activist's argument writes itself: each of these brands demands product cycles, dealer support, marketing, homologation and regulatory compliance, and the aggregate overhead is spread across volumes that cannot justify it. The FaSTLAne response — tier them, don't sell them — preserves optionality and heritage. It also preserves the cost.
Management's counter is not trivial: these brands hold dealer relationships and communities of owners, and in Europe they collectively address the largest installed car parc, which matters for parts and service revenue.19 But "we might monetise the heritage later" is a weaker argument in year six of a merger than it was in year one.
The second line of attack is regulation, and here the picture has moved in Stellantis' favour in ways that also indict the prior strategy. The EU's 2025 target required fleet-average emissions of 93.6 g CO2/km for cars, a 15% cut versus 2021.29 Facing an EV market that slowed sharply, the Commission introduced flexibility in 2025 — adopted as Regulation (EU) 2025/1214 — allowing manufacturers to meet 2025–2027 targets on a three-year average rather than annually, so over-emission in one year can be offset by over-compliance in another.29 In December 2025 the Commission went further, proposing to modify the 2035 zero-emission requirement to a 90% tailpipe reduction with the balance offset through low-carbon materials, e-fuels or biofuels — which would permit plug-in hybrids and combustion engines to continue past 2035.29
For a company that had planned for 100% European BEV sales by 2030, that regulatory retreat is simultaneously relief and vindication of the write-down.26 It is also a live risk in the opposite direction: a company that has now bet heavily on hybrids and combustion is exposed if European policy tightens again.
Filosa has been unusually pointed on one specific regulatory front. On both recent calls he argued that the electrification trajectory demanded of light commercial vehicles is "nowhere near real market demand," that the required BEV mix is "proven" unattainable, and that as a consequence the LCV industry is shrinking.1819 This matters more for Stellantis than for peers — the company holds roughly 30% share in European light commercial vehicles, historically one of its most profitable positions.18 Regulation compressing your single strongest European franchise is a genuine, mechanism-level risk, not a generic policy complaint.
The third attack is the hardest to answer: pricing power, once broken, is very difficult to restore. Stellantis cleared its US inventory with discounts and production cuts. Every buyer who purchased at a discount now holds a reference price. Every dealer who watched aged inventory get marked down now negotiates differently on allocation. Management's stated approach is to rebuild mix rather than headline price — pushing HEMI V8 pickups, where roughly 40% of Q1 2026 truck deliveries carried the engine, and where per-unit profitability is materially higher.19 That is a credible mechanism. It is also a bet on a powertrain whose demand is sensitive to fuel prices, a point Bank of America's Horst Schneider raised directly on the Q1 call.19
Now the current risk radar, restricted to what is materially live.
US inventory, again. This is the most uncomfortable fact in the entire story. Management stated on the February 2026 call that US days of supply ended 2025 at 69 days — "a very healthy number."18 By June 2026, HSBC cited dealer inventory back at 93 selling days, an increase of roughly 120,000 units year over year, and downgraded the shares to Reduce with a €4 target.10 Cox Automotive's June data put the industry at 80 days and Jeep at roughly twice that — the highest of any brand on the board — while noting Jeep's incentive spend at 6.7% of average transaction price, below the 7% industry average.30 That last detail is the one to sit with. High inventory plus below-average incentives means the discounting has not happened yet. Either demand improves, or the discount arrives later and lands in margin.
Quality and recall exposure. Through the first half of 2026, Stellantis issued 19 US recalls covering 2.5 million vehicles, roughly 2 million of which required physical inspection or mechanical repair; in Europe it issued 47 recalls in six months against 48 for all of 2025.10 Set against a €4.1 billion warranty provision reassessment and the hiring of over 2,000 quality engineers, the direction of travel on quality remains genuinely unresolved.1618
Chinese competition beyond Europe. The competitive pressure Stellantis faces in Europe is now appearing in South America and the Middle East — the two segments currently carrying group profitability. Asked on the February call whether he would prioritise volume or price under intensifying Chinese pressure, Filosa said the company would "pursue profitability."18 That is the right answer strategically and the same answer that produced 2024.
Input costs and tariffs. Laranjo guided that raw material headwinds net of hedges could approach 1% of revenue in 2026, potentially over €1 billion.19 Net tariff headwind for 2026 was estimated at €1.0–1.2 billion, with €0.3 billion incurred in the first half.1
Balance sheet. This is the reassuring part. Industrial available liquidity stood at €44.1 billion at the end of Q2 2026, 27% of trailing twelve-month revenues, supported by €5 billion of hybrid perpetual notes issued in March 2026.119 Total available liquidity was €49.8 billion at the end of 2025.5 A company burning cash needs runway, and Stellantis has it — but the hybrid issuance and dividend suspension together are the balance sheet telling you the situation was serious.
XI. Playbook: Business & Investing Lessons
Stripping away brand portfolios and regional nuances reveals five core strategic lessons that extend well beyond the automotive sector.
Lesson one: margin percentage is an output, not a strategy. Optimizing for reported operating margins in a business with high fixed costs and franchised distribution creates a clear hazard: raising prices, eliminating entry-level models, squeezing component suppliers, and deferring marketing. While each action improves short-term margin percentages, it simultaneously alienates buyers, strains supply partners, and erodes operational resilience. The mechanism of failure becomes evident when vehicle supply normalizes and priced-out customers migrate to competitors. Stellantis reported a 13.0% operating margin in 2022 and an adjusted operating loss three years later, establishing a direct causal link between peak-margin pricing decisions and the subsequent volume collapse.25 Operational efficiency is vital, but it cannot substitute for commercial execution or customer retention.
Lesson two: consolidation logic works, but only for the specific problems it is designed to solve. Marchionne's consolidation thesis was validated on the cost side: the automotive industry routinely wasted capital duplicating non-differentiating engineering, and Stellantis demonstrated that a multi-brand entity could eliminate that waste—exceeding its €5.0 billion annual synergy target by more than 40% two years ahead of schedule.2 Modular platform sharing offers a genuine, durable cost structure and remains central to the company's FaSTLAne 2030 framework, which aims to consolidate half of global production onto three core architectures by 2030.9 However, cost synergies are strictly an input-side solution. They do not ensure that vehicles appeal to local buyers, that dealer networks remain cooperative, or that product quality holds. Stellantis demonstrates that a merger can deliver on every cost-reduction promise while still faltering commercially. Evaluating consolidation requires looking beyond projected cost synergies to assess whether the combined enterprise delivers superior value to customers.
Lesson three: when a disruptor holds an unmatchable structural cost advantage, securing partnership access beats direct resistance. As Western automakers lobbied for tariffs against Chinese electric vehicles, Chinese manufacturers expanded into hybrid powertrains, capturing a record 10.7% market share in the European Union in May 2026.17 Stellantis responded by acquiring a 21% equity stake in Leapmotor and a 51% controlling interest in Leapmotor International, effectively turning a low-cost competitor into a supply partner and a shared profit pool.8 While expanding global scale for an external technology partner carries long-term strategic risk, funding years of internal development to replicate an existing Chinese cost structure presented a far higher capital burden. In the face of structural disruption, securing an equity stake in the disruptor's distribution model proved more pragmatic than head-to-head competition or regulatory retreat.
Lesson four: cyclical peak earnings must not be mistaken for permanent distributable capital. Stellantis distributed €6.6 billion to shareholders for 2023 and initiated a €3.0 billion share buyback program for 2024, deploying capital at the peak of an earnings cycle driven by temporary semiconductor supply shortages.14 Just eighteen months later, facing severe operational headwinds, management suspended the dividend and issued €5.0 billion in perpetual hybrid bonds to bolster liquidity.1619 In deeply cyclical industries, low price-to-earnings multiples on peak trailing earnings create a value trap, making shares appear underpriced precisely when forward cash flows face the greatest vulnerability. Capital allocation discipline requires normalizing cash flows across an entire industry cycle before identifying excess capital for distribution. Otherwise, companies risk repurchasing equity at cyclical highs only to issue expensive debt or hybrid capital at cyclical troughs.
Lesson five: executive leadership capabilities must align with the operational context. Carlos Tavares demonstrated exceptional skill as an industrial cost engineer, as evidenced by his rapid turnaround of Opel. However, the centralized, aggressive cost extraction that restored distressed assets to profitability ultimately compromised commercial execution when applied to healthy operations without sufficient operational balance. The senior independent director, Henri de Castries, underscored this divergence upon Tavares's departure, citing conflicting strategic perspectives between the board and chief executive.7 Leadership effectiveness depends heavily on corporate context: the executive skills required to restructure an insolvent business during a crisis differ fundamentally from those needed to maintain brand equity, dealer alignment, and product momentum during periods of market expansion.
XII. Key KPIs & Bull vs. Bear Case
Evaluating Stellantis' turnaround trajectory centers on three fundamental performance metrics.
First: adjusted operating income margin, specifically in North America. This metric serves as the primary indicator of group operational efficiency, aggregating pricing power, product mix, volume leverage, and manufacturing costs into a single figure. In the second quarter of 2026, group adjusted operating margin reached 1.8%, with North America recording 1.6%.1 Under the FaSTLAne 2030 framework, management targets a 7% consolidated group margin by 2030, supported by regional targets of 8–10% in North America, 3–5% in Enlarged Europe, 8–10% in South America, 10–12% in the Middle East & Africa, and 4–6% in Asia Pacific.931 Closing the gap between 1.8% and the 7% goal forms the core of the investment thesis. The key operational variable remains revenue flow-through—the proportion of incremental revenue converted to operating profit—which continues to draw intense market scrutiny.
Second: U.S. dealer days of supply. This metric functions as a leading indicator of commercial health, signaling whether the inventory imbalances that precipitated the 2024 crisis are recurring. Management reported U.S. inventory at 69 days of supply at year-end 2025, but independent estimates placed it at 93 days in June 2026, with Jeep carrying roughly twice the industry average of 80 days.181030 Maintaining inventory levels well above industry norms while keeping promotional incentives below peer averages creates commercial tension that typically resolves either through organic demand recovery or margin-dilutive retail discounting.
Third: industrial free cash flow. For a capital-intensive automaker navigating dividend suspensions, perpetual hybrid debt obligations, and €6.5 billion in cash outflows over four years linked to its operational reset, cash generation represents the ultimate measure of financial flexibility and solvency.16 Cash generation has shown initial recovery: industrial free cash flow reached negative €0.9 billion in the first half of 2026—a 69% improvement over the negative €4.5 billion reported in 2025—supported by €1.0 billion generated in the second quarter alone.51 Management targets positive industrial free cash flow in 2027, rising to €6.0 billion by 2030.531
The bull case centers on measurable operational improvements, balance sheet stabilization, and expanding product momentum. First, operational recovery is supported by near-term financial results: revenues grew 10% in the first half of 2026, North American revenue rose 32% in the second quarter, and net profit reached €670 million for the half, reversing a €2.3 billion loss from a year earlier.1 Second, the balance sheet reset is complete and largely non-cash, insulating future earnings from recurring electrification write-downs of similar magnitude.16 Third, product momentum is expanding, featuring ten launches in 2025, the Jeep Cherokee's return to the mid-size SUV segment, 325,000 European orders for Smart Car platform models in 2025 with an order book up 80% year over year, and a 150% increase in North American order portfolios.18 Fourth, the Leapmotor joint venture provides a competitive entry-level electric vehicle offering in Europe that Stellantis' domestic cost base could not produce internally.19 Combined with modular platform scale, procurement leverage, stable governance under Exor, and €44.1 billion in available industrial liquidity, the bull case frames Stellantis as a manageable operational turnaround trading at a distressed valuation.14
The bear case focuses on structural market share loss, persistent inventory imbalances, and execution risks across a capital-intensive turnaround. The primary concern is potential structural market share loss in North America, where dealer statements in September 2024 that combined U.S. brand share had cut in half suggest long-term franchise erosion rather than a transient cyclical dip.20 Independent inventory data from June 2026 indicates that underlying commercial friction—specifically producing high-trim vehicles that consumers absorb slowly—remains uncorrected.30 In Europe, operating margins remain depressed; Enlarged Europe posted a 0.6% adjusted operating loss margin in the second quarter of 2026, even as all other operating regions reported positive margins.1 Simultaneously, Chinese competitors are expanding European market share at a rate that has doubled year over year, while expanding into South America and the Middle East—the group's most reliable profit centers.17
In addition, operational quality challenges persist, highlighted by recall volumes affecting 2.5 million U.S. vehicles over six months following a €4.1 billion upward revision to warranty provisions.1016 Brand complexity across fourteen nameplates remains unaddressed, with portfolio rationalization decisions deferred until December 2026.9 Furthermore, executing the €60 billion FaSTLAne 2030 plan carries significant execution risk for an organization that recently recorded €14.7 billion in write-downs from its prior strategy.916 Finally, capital expenditure running below 7% of revenue must increase in future years to support planned product launches, indicating that recent cash flow gains partially reflect delayed capital spending that must withstand higher capex requirements to achieve positive cash flow in 2027.19
Analyzed through strategic frameworks, Stellantis relies primarily on scale economies—a power shared by larger peers—while its process power has been impaired by quality issues and cost friction. Under industry competitive forces, the group faces elevated buyer power, aggressive discounting, supplier friction, and low-cost entrants across core markets. Compared to Toyota's hybrid leadership, General Motors' North American truck dominance, Volkswagen's European volume, or BYD's vertical integration, Stellantis lacks a singular, uncontested market advantage.
In summary, Stellantis presents an early-stage turnaround marked by initial operational recovery alongside lingering structural uncertainties, reflected in a valuation that discounts future execution. The falsification criteria for both theses are explicit and measurable. The bull case would be invalidated by North American margins failing to expand sequentially through the second half of 2026, U.S. dealer inventory remaining above ninety days of supply, or industrial free cash flow missing its positive 2027 target. Conversely, the bear case would be disproved by sustained sequential margin expansion, normalizing dealer inventories, and positive free cash flow generation occurring alongside rising capital expenditure.
XIII. Epilogue & Outlook
Sergio Marchionne was right about the automotive industry's disease, but his diagnosis left the cure incomplete.
He correctly argued that the sector burned through its enterprise value every four years on customer-invisible engineering, failing to earn its cost of capital across full economic cycles.6 His prescription—consolidate, share platform architectures, and eliminate redundant engineering—proved operationally sound. Stellantis demonstrated that this model could be executed at scale, surpassing its net synergy targets years ahead of schedule and reaching operating margins unprecedented for a volume automaker.2
Yet consolidation logic addresses cost efficiency, creating the capacity to compete rather than competitive success itself. An automaker can lower its breakeven threshold to industry-leading levels and still flounder if leadership uses that structural advantage to extract price rather than win customers. That misstep defined the group's trajectory between 2021 and 2024. The operational efficiency was genuine, but its commercial execution proved flawed, ultimately costing shareholders roughly €22 billion in reported charges, a suspended dividend, and a share price near multi-year lows.51610
That leaves Stellantis in the early, fragile stage of an operational recovery. The February 2026 balance sheet reset cleared the accumulated losses of an overextended electrification strategy in a single accounting event. The FaSTLAne 2030 plan redirected capital toward North American operations and powertrain flexibility, curtailed European assembly capacity by more than 800,000 units, established a clearer brand hierarchy, and set a 7% margin target for 2030 on €190 billion in revenue.931 While the first two quarters of 2026 yielded top-line growth, positive net profit, and improving free cash flow, operating margins remained near breakeven in absolute terms.1
Beyond Stellantis, this trajectory raises a broader strategic question: whether legacy consolidation logic remains sufficient. When Marchionne formulated his thesis in 2015, the primary threat was capital inefficiency among Western peers competing against one another. By 2026, the competitive threat centers on Chinese manufacturers operating with vertically integrated battery supply chains, compressed development cycles, and structurally lower cost bases. Having captured record European market share—pivoting rapidly to hybrid powertrains after tariffs constrained electric vehicle exports—these entrants challenge Western incumbents directly.17 Against rivals with lower cost structures, legacy platform scale is necessary but no longer decisive. Stellantis's own strategy—partnering with Leapmotor (零跑汽车), collaborating with Dongfeng, exploring arrangements with Tata Motors and Jaguar Land Rover, and shortening vehicle development cycles from 40 months to 24—serves as an implicit recognition that the 2015 consolidation playbook requires an updated sequel.9
For long-term investors, navigating this story requires resisting oversimplified narratives. Stellantis is neither beyond repair nor fully restored. It remains an enterprise with significant platform scale, compromised commercial relationships, an executive team that has provided greater transparency than its predecessor without yet proving a multi-year recovery, and a controlling shareholder structure that dictates corporate direction.
The key variables to monitor are straightforward and publicly verifiable: whether North American operating margins expand sequentially as promised, whether U.S. dealer inventory hovering near 90 days clears without destructive retail discounting, and whether industrial cash flow turns positive in 2027 while capital expenditure expands to support planned vehicle launches. Those three metrics will ultimately evaluate the turnaround. Everything else—brand heritage, conference call commentary, and portfolio breadth—remains context.
References
-
Second Quarter 2026 Financial Results — Stellantis, 2026-07-30 ↩↩↩↩↩↩↩↩↩↩↩
-
The merger of FCA and Groupe PSA has been completed — Stellantis, 2021-01-16 ↩↩
-
Stellantis N.V. 2025 Annual Report and Form 20-F — Stellantis, 2026-02-26 ↩↩↩↩↩
-
Full Year 2025 Results — Stellantis, 2026-02-26 ↩↩↩↩↩↩↩↩↩↩↩↩↩↩↩↩↩
-
Confessions of a Capital Junkie — FCA / Stellantis Archive, 2015-04-29 ↩↩↩↩↩
-
Board Accepts Carlos Tavares' Resignation as Chief Executive Officer — Stellantis, 2024-12-01 ↩↩↩↩↩↩
-
Stellantis to Become a Strategic Shareholder of Leapmotor with €1.5 Billion Investment — Stellantis, 2023-10-26 ↩↩↩↩↩
-
Stellantis Unveils €60 Billion Strategic Plan to Accelerate Growth and Profit — Stellantis, 2026-05-21 ↩↩↩↩↩↩↩↩↩↩↩↩↩↩↩↩↩
-
HSBC downgrades Stellantis stock rating on inventory and quality concerns — Investing.com, 2026-07-03 ↩↩↩↩↩↩
-
PSA touts European scale and supply chain synergy in Opel/Vauxhall acquisition — Automotive Logistics, 2017-03 ↩↩↩
-
PSA Group to acquire Opel/Vauxhall from General Motors — DieselNet, 2017-03-06 ↩↩
-
Stellantis (Part 1): FCA-PSA Business Integration Completed in January 2021 — MarkLines, 2021-03 ↩
-
Stellantis N.V. FY2023 Results — Reconciliations and Segment Detail — Stellantis, 2024-02-15 ↩↩↩↩↩
-
Stellantis Resets its Business to Meet Customer Preferences and to Support Profitable Growth — Stellantis, 2026-02-06 ↩↩↩↩↩↩↩↩↩↩↩↩↩↩↩
-
Chinese Cars Hit Record 10.7% EU Share in May 2026 — GoodCarBadCar, 2026 ↩↩↩↩↩↩
-
Stellantis Full Year Results 2025 — Earnings Call Transcript, 2026-02-26 ↩↩↩↩↩↩↩↩↩↩↩↩↩↩↩↩↩↩
-
Stellantis Q1 2026 Financial Results — Earnings Call Transcript, 2026-04-30 ↩↩↩↩↩↩↩↩↩↩↩↩↩↩↩↩↩↩
-
Stellantis Dealers Blast CEO For 'Devastating' Brand Collapse, Company Fires Back — Carscoops, 2024-09-11 ↩↩↩
-
Stellantis Updates 2024 Financial Guidance — Stellantis, 2024-09-30 ↩↩↩↩↩↩
-
Stellantis Announces Antonio Filosa to Be Its New Chief Executive Officer — Stellantis, 2025-05-28 ↩↩
-
Stellantis to Invest $13 Billion to Grow in the United States — Stellantis, 2025-10-14 ↩↩↩
-
Stellantis and Leapmotor Announce Their Intention to Take Their Strategic Partnership to the Next Level — Stellantis, 2026-05-08 ↩↩
-
Dare Forward 2030: Stellantis' Blueprint for Cutting-Edge Freedom of Mobility — Stellantis, 2022-03-01 ↩↩
-
Free2move Drives 99% Revenue Compounded Annual Growth since 2021, Achieves Profitability — Stellantis Media ↩↩
-
New 'Mobilisights' Business Unit Advances Stellantis' Growing Data and Connected Services Offer — Stellantis, 2023-01 ↩↩
-
Cars and vans — CO2 emission performance standards — European Commission, Climate Action ↩↩↩
-
June New-Vehicle Inventory Holds Steady as Sales Pace Cools — Cox Automotive, 2026-07 ↩↩↩
-
Stellantis Presents FaSTLAne 2030 Financial Framework & Targets at Investor Day 2026 — Stellantis, 2026-05-21 ↩↩↩
 LinkedIn
 WhatsApp
 Reddit
 Hacker News
 Email
Email Kindle
 RSS Feed
 Spotify
 Apple Podcasts
 Amazon Music
 Audible
 YouTube