Sika AG: The Invisible Glue of Global Infrastructure
I. Introduction & Episode Roadmap
Stand at the mouth of a rail tunnel bored through the Swiss Alps and nothing appears to indicate a chemical company. One sees rock, concrete, ventilation ducts, and catenary wire. What remains unseen—by design—is the thin chemical membrane preventing groundwater from seeping through the lining and shorting out the electrical systems that keep the tunnel operating.
That invisibility defines the entire business. Sika AG manufactures products that are buried, sandwiched, injected, sprayed, and troweled into structures, with performance measured by the absence of failure: no leaks, no cracks, no delamination, and no callbacks. It represents one of the least glamorous product categories in the industrial economy, yet for most of the past three decades, it has also been among the most reliably profitable.
In 2025, the company generated net sales of CHF 11.2 billion and employed 33,707 people.1 Its shares trade on the SIX Swiss Exchange under the ticker SIKA, with 160,479,293 registered shares outstanding, each carrying exactly one vote—a detail that sounds like boilerplate but represents the hard-won outcome of the most consequential corporate governance battle in modern Swiss history.2 Its market valuation stood at CHF 34.6 billion at the end of 2024 before contracting to roughly CHF 28 billion, a de-rating that sits at the center of its current investment narrative.23
This de-rating highlights the core tension facing the company. Sika spent a century assembling what appears, on paper, to be an exceptionally strong franchise: products that represent a rounding error in a construction budget but carry catastrophic costs if they fail; a sales force that embeds its specifications directly into engineering plans before contracts are tendered; hundreds of small local factories that optimize freight economics; and a serial acquisition strategy that consistently acquired scale below prevailing strategic valuations. Yet in 2025, organic sales contracted slightly, reported return on capital employed fell to 12.3%, net profit declined 16.2%, and management launched a restructuring program that included headcount reductions.1
The central strategic question is not whether Sika built a competitive moat, but what that moat is worth when key end markets slow. The company faces a broader downturn in global construction, the contraction of Chinese residential property—its primary growth driver during the 2010s—a major competitor assembling a rival portfolio through four rapid acquisitions, and persistent strength in the Swiss franc that routinely erodes reported revenue. A moat that protects operating margins during a volume contraction presents a very different investment proposition than the growth compounder the market priced in 2021.
The roadmap for this analysis:
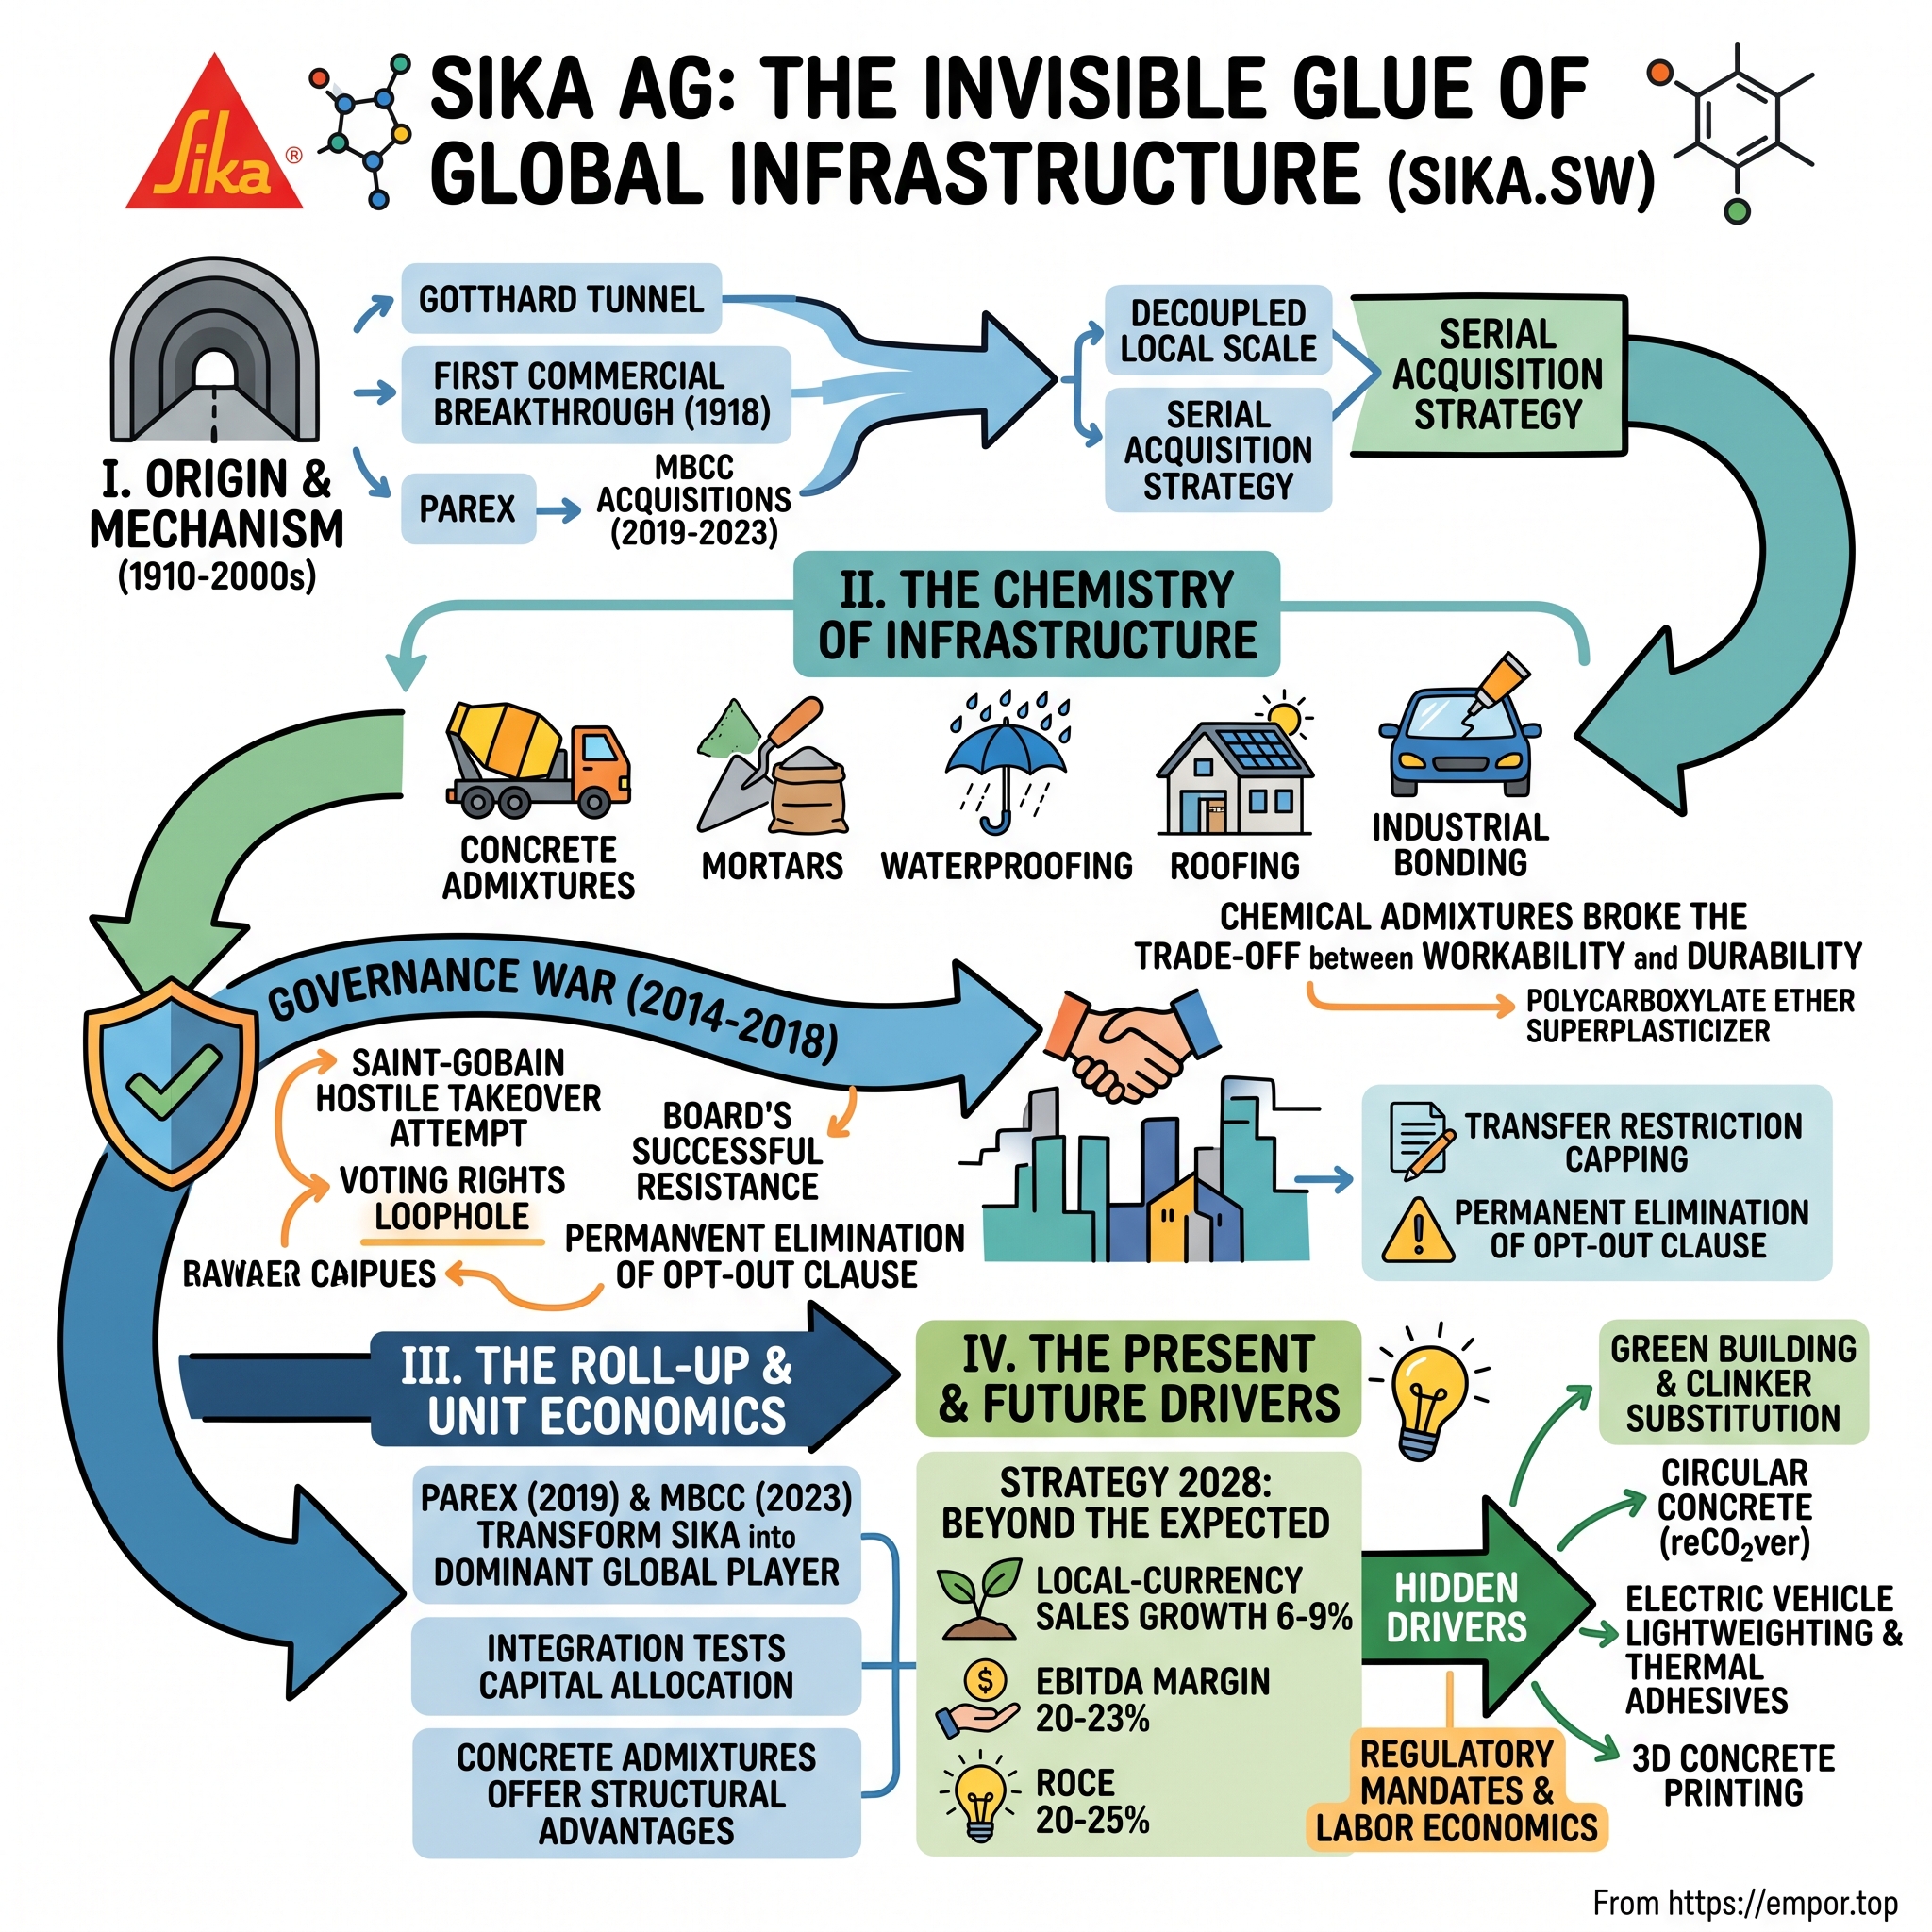
Origin and mechanism. How an Austrian immigrant's waterproofing paste for a Swiss rail tunnel established a global chemical category, and how the physical properties of wet chemistry necessitated a decentralized manufacturing footprint that became an unscripted competitive advantage.
The governance war. The four-year battle from 2014 to 2018, when a French competitor attempted to acquire control of Sika by exploiting a voting-rights loophole—seeking 52.4% of the voting power for just 16% of the equity capital—and the board's successful resistance that led to the permanent elimination of the opt-out clause.4
The roll-up. The acquisitions of Parex in 2019 and MBCC in 2023, which transformed Sika from a specialized leader into the dominant global construction chemicals player, and which now test whether management's capital allocation represented disciplined strategy or cyclical timing.
The unit economics. Why concrete admixtures offer structural advantages, and where that investment thesis encounters operational limits.
The present. An evaluation of Strategy 2028, the Fast Forward restructuring announced in November 2025, and the mixed signals from July 2026 guidance that raised sales growth targets while trimming margin expectations.156
The analysis begins with what the company physically produces, a business model rarely fully understood outside the construction sector.
 Subscribe on LinkedIn
II. The Chemistry of Infrastructure: What Sika Actually Does
Pour a truckload of ordinary concrete and observe what happens. It is a slurry of cement, water, sand, and stone. Add too little water and it will not flow into formwork or around reinforcing steel, creating voids, honeycombing, and structural weak spots. Add enough water to make it flow easily, however, and a weaker, more porous final product is guaranteed. As excess water eventually evaporates, it leaves behind capillaries—tiny channels through which water, chloride, and carbon dioxide migrate for decades, corroding rebar from the inside.
This is the central dilemma of the most widely used man-made material on earth: workability and durability pull in opposite directions. Civil engineers have wrestled with this trade-off since Roman times.
Chemical admixtures broke the trade-off. The workhorse molecule is a superplasticizer—in the modern generation, a polycarboxylate ether. Cement particles act like tiny magnets that clump together in water, trapping liquid inside the clusters where it performs no useful function. A superplasticizer is a comb-shaped polymer that latches onto each particle and extends long side-chains, physically holding the particles apart. The clumps disperse, the trapped water releases, and the mix flows smoothly with far less added water. The result is concrete that can be pumped forty stories up a skyscraper, self-level around dense rebar cages, and cure to higher strength and lower permeability than an untreated mix.
That single insight—that a fraction of a percent of an organic molecule can transform the properties of a material measured in millions of metric tons—is the foundation of the industry Sika leads.
The portfolio spans five main chemical categories. Concrete admixtures manage flow, set time, and strength development in ready-mix and precast concrete. Mortars are factory-blended products for finishing trades: tile adhesives, facade renders, self-leveling floor screeds, and polymer-modified repair mortars used to patch spalling concrete on bridge decks and parking garages. Waterproofing includes systems that protect basements, tunnels, and reservoirs—sheet and liquid membranes, injection resins pumped into live leaks under pressure, and crystalline admixtures that grow inside concrete pores to block water passage. Roofing and building envelope encompasses thermoplastic single-ply membranes and elastic joint sealants sold under the Sikaflex brand, which dates to the company's expansion into vehicle assembly. Industrial bonding represents structural adhesives where polyurethane or epoxy replaces spot welds and rivets—bonding glass windshields directly into vehicle frames as structural components or joining incompatible metals like aluminum and steel.
Two of these categories operate under distinct economics. Roofing membranes are primarily a wear-and-replacement business: a commercial flat roof has a finite service life, and building owners must replace it at maturity regardless of broader construction activity. This gives roofing a maintenance-driven demand profile that partially decouples from new construction cycles. Refurbishment mortars function similarly, as crumbling parking structures require repair regardless of prevailing interest rates.
Industrial bonding follows the opposite pattern: it depends on vehicle and equipment manufacturing schedules, which follow an entirely separate industrial cycle, and serves a small cohort of sophisticated original equipment manufacturers with substantial bargaining power. A single chemical family across one company thus addresses three distinct demand drivers and customer power dynamic levels. Any broad characterization of Sika's business model that treats these end markets as uniform is misleading.
Sika reports financial results geographically rather than by product line: EMEA, Americas, and Asia/Pacific. This structure was streamlined in January 2024 when the company folded its previously separate Global Business unit—the automotive and industrial division—into each geographic region as a dedicated Automotive & Industry area, reasoning that e-mobility and renewable energy trends required faster regional decision-making.7 The analytical consequence is that standalone industrial segment disclosures ended, making the automotive business harder to isolate externally.
In the first half of 2026, regional sales were weighted toward EMEA at CHF 2,626.4 million, followed by the Americas at CHF 1,904.8 million and Asia/Pacific at CHF 1,058.6 million.6 Europe, the Middle East, and Africa serves as the operational anchor—the largest segment and the most exposed to refurbishment, the most stable niche in construction because structures deteriorate independent of interest rate fluctuations. The Americas drives megaproject and industrial reshoring demand, while Asia/Pacific reflects sharp headwinds over the past five years, discussed later in this analysis.
The core unit economics explain the strength of the franchise. On a major infrastructure project, Sika's chemicals represent a small fraction of total capital costs—typically low single-digit percentages. Yet these products govern high-liability failure points: water ingress, structural cracking, adhesive failure, and premature corrosion. A contractor who saves a small sum by substituting an unverified admixture risks basement slab leaks where remediation costs dwarf initial savings and trigger substantial legal liabilities.
Industry commentary frequently attaches precise statistics to this asymmetry, claiming construction chemicals represent 1% to 3% of project costs or cause a vast majority of building warranty claims. Sika does not publish these figures, and no independent body tracks them globally. While the underlying dynamic is supported by industry behavior, specific percentages remain unverified and should be viewed as illustrative rather than empirical. The verifiable proof of pricing leverage sits on the income statement.
That structural asymmetry underpins Sika's pricing power, visible in an unusually resilient gross spread. Sika reports a "material margin"—sales minus raw material costs—that reached 54.9% for full-year 2025, up from 54.5% the prior year, and rose further to 55.7% in the first half of 2026.16 Management attributes this expansion to product innovation, procurement efficiencies, and pricing discipline.6 In an environment where sales volumes were flat to declining, the company expanded its spread over raw material inputs, demonstrating genuine pricing discipline rather than mere strategic claims.
However, a high and rising material margin has clear analytical limits. Expanding spreads over raw materials demonstrate pricing power but do not guarantee sales volume. Between 2024 and 2025, Sika's material margin expanded even as its EBITDA margin contracted, because fixed operating costs—including manufacturing plants, technical sales teams, and the integration of two major acquisitions—do not automatically scale down when volumes plateau.1 The company possesses a margin moat rather than a guaranteed growth engine, a critical distinction that recurs throughout its financial history.
Understanding how this business model took shape requires returning to a tunnel.
III. The Foundation: Gotthard Tunnel, Sika 1, and Decoupled Local Scale (1910–2000s)
The problem that founded Sika was, in the most literal sense, an electrical one.
By the second decade of the twentieth century, the Gotthard rail line served as the vital transportation artery connecting northern and southern Europe through the Swiss Alps, and Swiss Federal Railways sought to electrify the network. Coal was expensive and imported, whereas domestic hydroelectric power was abundant. However, the mountain tunnels leaked. Water seeping through masonry linings onto live electrical equipment presented a fundamental operational barrier to running electric trains.
Kaspar Winkler, an Austrian entrepreneur who had established a chemical business in Switzerland, had been developing a quick-setting waterproofing admixture for mortar named Sika-1. The company traces its founding to 1910, but its defining commercial breakthrough occurred in 1918, when Swiss Federal Railways successfully used Sika-1 to waterproof the Gotthard tunnel—the technical precondition for electrification.8
That project established an operational pattern that endured for the next century. The product was invisible and represented a tiny fraction of total construction costs, yet it was specified directly by an engineer solving a critical structural problem rather than selected by a purchasing manager comparing commodity prices. The Gotthard reference provided an endorsement that outweighed conventional advertising, establishing a direct-specification sales motion that Sika maintains today.
Winkler capitalized quickly on the landmark trial. By the 1930s, he had established 15 subsidiaries across Europe, the United States, South America, and Asia.8 That rapid international build-out was unusual for a small Swiss chemical firm during the interwar period, driven by a physical constraint that continues to shape construction chemistry.
The core constraint stems from freight economics. Liquid admixtures consist primarily of water, while bagged mortars consist mostly of sand and cement. Transporting low-value, heavy material over long distances causes freight costs to exceed product value within a few hundred kilometers. Consequently, the standard chemical industry playbook—building a centralized mega-factory to serve an entire continent—is economically unviable.
Furthermore, product formulations cannot be standardized globally. Cement chemistry varies across manufacturing plants and quarries, while aggregate shapes and mineral content differ by region. Ambient temperature fluctuations dramatically alter setting times—an admixture formulated for a Nordic winter behaves differently in a Middle Eastern summer. Local building codes and testing standards present additional variances. As a result, a formulation designed for Bavaria cannot be used directly in Bangalore, requiring local technical teams, site trials, and regulatory approvals.
Sika addressed these constraints through a network of small production plants located close to end markets, operated with substantial regional autonomy, and supported by central research and development and raw material procurement. This structure runs counter to traditional chemical economies of scale. Rather than manufacturing a single commodity in vast volumes, Sika competes by producing thousands of tailored formulations cost-effectively near the end customer, securing project approvals before competitors can offer alternatives. By the first half of 2026, this network encompassed 103 national subsidiaries, supported by seven new production facilities opened in those six months.6
The strategic implications of this footprint are significant. A local blending plant serving a metropolitan market requires modest capital investment—primarily mixing tanks, quality-control equipment, and warehouse space. The competitive moat derives not from the physical facility, but from the localized ecosystem surrounding it: established relationships with local raw material suppliers, technical teams familiar with regional cement chemistry, historical performance data with local ready-mix producers, and time-consuming certifications from national testing authorities. While a competitor can construct a facility within a year, replicating these local relationships and approvals requires far longer, allowing the incumbent to capture ongoing project tenders.
These dynamics explain why market share in construction chemicals shifts slowly and why industry consolidation occurs primarily through acquisitions. When organic displacement of an incumbent in local markets proves cost-prohibitive, growth requires acquiring established operators.
Sika's second key strategic choice was its direct sales model. Instead of relying solely on third-party distributors, the company deployed technical sales specialists to engage directly with engineering firms, architects, and job sites. These specialists embedded Sika's product specifications into architectural blueprints and structural plans long before contracts went to tender, returning to project sites during application to verify performance. In construction, the project specification serves as the primary choke point. Once a specific product is written into structural drawings, substitution requires formal re-approval by the lead engineer, who faces professional liability for performance failures and thus has strong incentives to reject changes.
This creates a powerful switching cost rooted in liability-driven inertia rather than contractual lock-in or technical incompatibility. This inertia is strongest in complex, high-consequence projects—such as Alpine rail tunnels, dams, structural repairs, and deep subterranean waterproofing—and weakest in commodity applications where products are broadly interchangeable. Evaluating Sika's long-term competitive position requires recognizing that its aggressive acquisition strategy over the past decade has expanded its exposure toward these more commoditized product categories.
Leadership transitioned across generations during the mid-twentieth century. Fritz Schenker, Winkler's son-in-law, joined the executive board in 1928 and directed international expansion until his death in 1971, while Romuald Burkard joined the business in 1953 and progressively took over management.8 Near-insolvency during the construction crisis of the late 1960s challenged the firm's trajectory, and the subsequent operational recovery fostered an internal corporate culture still designated as the "Sika Spirit."8 The 1980s marked the launch of Sikaflex elastic sealants and entry into the automotive assembly market. Global expansion accelerated through the 1990s and 2000s; 16 new subsidiaries were established in the first half of the 1990s alone, and total revenue grew from roughly CHF 2 billion in 1990 to CHF 4.6 billion by 2010.8
By the 2000s, the founding family no longer managed daily operations but retained effective control through Schenker-Winkler Holding, which owned approximately 16% of Sika's share capital but held 52.4% of the votes.9 For decades, this dual-class capital structure functioned without public controversy. In December 2014, however, it became the focal point of a major governance conflict when the family attempted to sell its controlling stake to a foreign competitor without extending the offer to public minority shareholders.
IV. The Governance War: Defending Independence Against Saint-Gobain (2014–2018)
In early December 2014, Sika’s executive leadership learned of a change in corporate control the same way public markets did: after the contract had already been signed.
The founding Burkard family agreed to sell Schenker-Winkler Holding to Compagnie de Saint-Gobain, the French building materials conglomerate, for CHF 2.75 billion.9 The price represented an 80% premium over the market value of Sika’s ordinary shares, reflecting the asset Saint-Gobain was actually buying: not 16% of the equity capital, but 52.4% of the voting power.9
Under standard Swiss takeover regulations, an acquirer crossing a control threshold must extend a mandatory tender offer to all shareholders at a comparable price. Sika’s articles of association, however, contained an opting-out clause that disabled that protection.9 The arrangement created a stark conflict of interest: the controlling family would capture a massive premium for a 16% equity stake, a direct competitor would acquire operational control, and minority investors holding the remaining 84% of equity economics would receive no offer, no premium, and a new controlling owner that competed directly with their company.
The operational implications were immediate. Saint-Gobain sold building materials through identical distribution channels to the same contractors. A controlling shareholder operating as a direct rival faces inherent structural conflicts across market expansion, customer prioritization, product pricing, and research allocations.
Faced with those conflicts, Sika's board refused to support the transaction.
The independent directors, led by Chairman Paul Hälg, alongside the executive team under Chief Executive Officer Jan Jenisch, opposed the sale. Rather than resigning, the board mounted a legal defense using a provision embedded within the company’s own charter.
Sika’s articles of association contained a transfer restriction capping any individual shareholder’s registered voting rights at 5% under specific conditions. The board maintained that this restriction applied to Schenker-Winkler once Saint-Gobain gained effective control. By applying the 5% cap at consecutive annual general meetings, the board restricted the family holding's votes, preventing the appointment of a takeover-friendly board.9
This was an extraordinary exercise of board authority: independent directors effectively disenfranchised their majority-voting shareholder on the grounds that exercising those votes would harm the company. The family and Saint-Gobain challenged the decision, initiating a legal battle that moved through the cantonal courts of Zug and up through the Swiss judicial system over four years.9 The dispute became a landmark case study in European corporate governance, illustrating how dual-class share structures can be used to transfer control without sharing the premium with public shareholders.
The four-year standoff imposed significant operational friction. Sika’s executive team managed the business amid ongoing litigation, intense public scrutiny, and contentious shareholder meetings. The Burkard family held a signed contract it could not close, while Saint-Gobain committed billions to an acquisition it could neither direct nor consolidate. Throughout the conflict, Sika’s core business continued to expand revenue and earnings. Each quarter of solid operational performance strengthened the board’s argument that incumbent management was generating sustainable enterprise value independently.
Institutional investors and governance advisory firms supported the board. As the legal proceedings dragged on, Saint-Gobain’s stranded position grew increasingly costly, demonstrating the operational difficulty of maintaining a hostile controlling stake against an opposing board and management team.
On May 11, 2018, the parties announced a settlement.4
The Burkard family sold Schenker-Winkler Holding to Saint-Gobain for CHF 3.22 billion—more than CHF 500 million above the price agreed in December 2014.4
Sika then repurchased a 6.97% equity stake carrying 23.7% of voting rights from Schenker-Winkler for CHF 2.08 billion, a figure that included a CHF 795 million premium over the market value of those shares as of May 4, 2018.4 Sika drew on its own balance sheet to acquire and retire the voting block that had been used against it, subsequently cancelling the repurchased shares.4
Saint-Gobain retained a 10.75% position in Sika’s capital and voting rights, subject to a two-year lockup, a four-year standstill at that level—extendable two additional years up to 12.875%—and a right of first offer to Sika before any external sale.4 Saint-Gobain booked a positive net result of more than EUR 600 million on the overall transaction before eventually unwinding the stake.4
At an extraordinary general meeting on June 11, 2018, shareholders converted all shares into a single class at a 1:60 ratio and eliminated both the opting-out clause and the transfer restriction.4 Sika became a one-share-one-vote company, accompanied by the departure of board members Urs F. Burkard, Jürgen Tinggren, and Willi Leimer.4
The formal statements following the resolution emphasized mutual consensus. Chairman Paul Hälg and Chief Executive Officer Paul Schuler—who had succeeded Jan Jenisch following his departure for Holcim in 2017—called the outcome "immediately accretive for our shareholders" and a path to "a new chapter."4 Saint-Gobain Chief Executive Officer Pierre-André de Chalendar called it "a very positive settlement for Saint-Gobain, both from a financial and a strategic perspective."4
For investors evaluating Sika's corporate structure, the governance dispute carries three lasting takeaways.
First, the governance outcome created a permanent, unified capital structure. Sika operates without a controlling shareholder, dual-class overhang, or mechanisms allowing single holders to extract private control premiums. Its largest disclosed holders are institutional asset managers, led by BlackRock at 7.7% and UBS Fund Management at 5.649% of voting rights.2
Second, defending independence carried a tangible financial cost. Sika deployed CHF 2.08 billion, including a CHF 795 million control premium, to buy back its own shares from a hostile party—capital that could have funded acquisitions or reduced debt.4 While cancelling the shares eliminated a structural threat, the repurchase was a costly defensive resolution rather than an opportunistic capital allocation.
Third, the episode provides clear empirical evidence of board behavior under extreme stress. When faced with a direct conflict between the controlling family's exit preferences and minority shareholder equity, Sika's independent directors defended minority rights and corporate autonomy. While this history demonstrates governance resolve in a crisis, evaluating Sika's future prospects requires assessing how effectively management allocates capital under standard operating conditions—the exact challenge examined in the subsequent acquisition expansion.
V. The M&A Masterclass: Parex, MBCC, and Sector Consolidation (2019–2023)
Following the governance settlement, Sika shifted aggressively to capital deployment. The strategic rationale rested on industry structure: construction chemicals remains a structurally fragmented market populated by sub-scale regional operators, family-owned businesses, and private equity portfolio companies incapable of funding global research and development. For a global consolidator, acquiring these local positions allows management to integrate them into an existing distribution network and extract cost savings. Beyond immediate cost synergies, denser plant coverage reduces freight costs per metric ton, widening the moat against local entrants.
Parex, 2019. On January 8, 2019, Sika made a binding offer to acquire ParexGroup, a mortar specialist owned by funds managed by CVC Capital Partners, at an enterprise value of CHF 2.5 billion.[^10] Parex brought CHF 1.2 billion in sales at a 16% EBITDA margin, 74 plants across 23 countries, and a distribution-led route to market encompassing more than 90,000 points of sale in China.10
The transaction was priced at 11.3 times pro forma 2019 estimated EBITDA, falling below 8.5 times on full run-rate synergies of CHF 80–100 million per year.[^10] The deal closed on May 23, 2019, doubling Sika's mortar business to roughly CHF 2.3 billion and pushing combined group sales past CHF 8 billion.10
The commercial insight behind Parex was channel arbitrage. Sika's traditional strength was direct technical sales for major capital projects, whereas Parex excelled in trade distribution—selling bagged products through builders' merchants, tile installers, and facade contractors. Combining the two portfolios enabled Sika to distribute its products through Parex's retail shelf space while routing Parex products through its own technical specification pipeline.
However, the transaction carried cyclical vulnerability. Parex's distribution network in China was acquired near the peak of the Chinese residential construction cycle. While the strategic logic remained sound, acquiring assets at peak cyclical earnings tested the entry valuation as end markets subsequently contracted.
MBCC, 2021–2023. Sika executed its largest transaction on November 11, 2021, agreeing to acquire MBCC Group—the former BASF Construction Chemicals business, then owned by Lone Star Funds—at an enterprise value of CHF 5.5 billion, the largest transaction in the company's history.11 MBCC generated CHF 2.1 billion in 2022 sales, employed 6,200 people across more than 60 countries, and operated 95 production facilities.12
Antitrust reviews across multiple jurisdictions prolonged the approval process, as regulators concluded that combining the two leading chemical admixture producers raised competition concerns. To secure approval, Sika divested MBCC's chemical admixture businesses in the United Kingdom, the United States, Canada, Europe, Australia, and New Zealand to private equity firm Cinven.12[^14] That regulatory carve-out removed roughly CHF 920 million in annual sales, over 1,600 employees, 35 manufacturing sites, and the Master Builders Solutions brand.[^14] The consideration paid by Cinven was not disclosed.
The transaction closed on May 2, 2023, roughly eighteen months after announcement.12 Annual synergies were originally guided at CHF 160–180 million by 2026 and were raised within months of closing to CHF 180–200 million, split roughly 65% cost and 35% revenue.12
Evaluating the MBCC transaction reveals distinct strategic trade-offs. On execution, management raised synergy targets early with explicit cost and revenue breakdowns rather than relying on vague operational updates. Executing the regulatory divestments avoided multi-year legal appeals that could have eroded asset value. Furthermore, the post-synergy effective multiple compared favorably with strategic peer transactions; for example, Saint-Gobain's acquisition of Fosroc, completed on February 10, 2025, carried a purchase multiple of approximately 11.3 times 2024 EBITDA before synergies on a business generating about $487 million of revenue.13
Conversely, macroeconomic timing created operational headwinds. Sika committed CHF 5.5 billion in late 2021 near the peak of the post-pandemic construction boom, financing the deal ahead of a sharp rise in interest rates. Integrating an asset of this scale from 2023 through 2025 coincided with widespread market deceleration, including European construction slowdowns, a contraction in Chinese real estate, and softer U.S. commercial building activity. The impact appeared directly in capital efficiency metrics: reported return on capital employed fell from 14.2% in 2024 to 12.3% in 2025, while adjusted ROCE—excluding capital tied up in acquisitions—fell from 22.1% to 17.5%.1 Relative to the Strategy 2028 target range of 20–25%, this performance underscores the cost of cyclical timing.7
Financial performance interpretation remains a subject of analytical debate. Management contends that reported ROCE understates operational efficiency because acquisition goodwill expands the capital base denominator. While analytically valid, capital deployment remains central to corporate strategy, meaning return calculations excluding acquisition costs omit the price paid for growth. Both metrics serve distinct analytical functions: reported figures measure overall capital efficiency, while adjusted figures provide a diagnostic on core operating performance.
The long-term assessment of MBCC depends on Sika's ability to expand the acquired revenue base rather than relying solely on initial cost reduction. While cost synergies represent a one-time operational reset, the 35% revenue synergy target requires sustained cross-selling that remains difficult to verify externally. That execution dynamic represents a central variable for Sika's competitive trajectory.
VI. Core Business Economics, Segments, & Competitive Landscape
For most of the past two decades, the competitive consensus surrounding Sika was straightforward: it was the world's largest dedicated construction chemicals producer—roughly double the size of its nearest pure-play rival—in a market so fragmented that the top players controlled only a small fraction of a multi-billion-dollar industry. The strategic objective was simple: consolidate the long tail of sub-scale operators.
That industry structure has fundamentally shifted.
Between 2021 and 2025, Saint-Gobain—the French conglomerate that lost the governance battle for Sika—assembled a formidable construction chemicals division through serial acquisitions, including Chryso, GCP Applied Technologies, OVNIVER, and Fosroc, which closed on February 10, 2025. Fosroc added roughly $487 million in 2024 revenue, 20 factories, and 3,000 employees, strengthening Saint-Gobain's footprint in India, the Middle East, and Asia-Pacific. On a pro forma basis, Saint-Gobain's construction chemicals unit expanded to approximately EUR 6.5 billion in sales across 76 countries.13
When evaluated alongside Sika's CHF 11.2 billion in net sales, the competitive dynamic looks markedly different.1 The rival Sika turned away in court built a construction chemicals platform more than half Sika's size through targeted acquisitions—focusing precisely on emerging markets in India, the Persian Gulf, and Southeast Asia where infrastructure spending is concentrated. Rather than a solitary market leader operating above a fragmented long tail, the sector is consolidating into a duopoly featuring a well-capitalized challenger backed by a major industrial balance sheet.
Surrounding these two market leaders are several specialized competitors:
Mapei of Italy operates as Sika's primary private counterpart—a family-controlled group competing directly in mortars, tile adhesives, and building chemical systems across Europe. Private ownership grants Mapei structural patience, enabling long-term market share investment free from quarterly reporting pressures, though limited financial disclosures obscure its precise margins.
Henkel generates billions in adhesive revenues, but its core focus remains industrial and consumer bonding rather than heavy civil admixtures, limiting its overlap with Sika to perimeter categories like sealants and light construction adhesives.
RPM International represents the primary North American competitor. In fiscal 2025, RPM generated $7.37 billion in total revenue, up 0.5%, while its Construction Products Group delivered a 6.3% sales gain driven by turnkey roofing systems.14 Operating as a federation of brand names with a focus on roofing and sealants, RPM competes directly with Sika across the U.S. building envelope market.
Beijing Oriental Yuhong leads China's domestic waterproofing market with a localized distribution footprint Sika cannot replicate, though it lacks an international presence. Oriental Yuhong's flat sales and compressed profitability following the distress of Chinese real estate developers illustrate the exact demand pressures that hit Sika's Chinese operations.
Finally, Fosroc, previously the dominant independent player in Gulf and South Asian infrastructure chemicals, now operates inside Saint-Gobain's expanded platform.13
How does Sika maintain its operational edge on the ground, and where do those advantages encounter limits?
The primary competitive mechanism remains localized chemical formulation supported by plant density. A challenger entering a new metropolitan market faces a high barrier: establishing freight-competitive pricing requires a local blending plant, but justifying plant capital requires existing engineering specifications, which in turn require local testing approvals, site trials, and trusted technical relationships. Sika's continuous expansion—exemplified by opening seven new production facilities in the first half of 2026 alone—reinforces this barrier.6
The second advantage is cross-selling scope on complex capital projects. A subway station project requires concrete admixtures, subterranean waterproofing, joint injection resins, fire-rated sealants, structural repair mortars, and protective flooring. Delivering an integrated chemical system reduces job-site coordination risks for contractors and liability risks for lead engineers, allowing Sika to secure higher revenue per project than single-product vendors.
The third mechanism is a specialized technical sales force—a capital-intensive asset that distributor-reliant competitors cannot easily duplicate.
Against these strengths sit three operational counterweights.
First, large acquisitions have altered the product mix. The additions of Parex and MBCC expanded Sika's presence in bagged mortars and trade distribution channels. While profitable, these retail-oriented channels offer weaker specification lock-in than direct civil engineering projects; customers exhibit higher price sensitivity, and competitive protection relies on brand recognition and retail shelf space rather than structural liability inertia.
Second, recent sales volumes highlight market pressure. In full-year 2025, organic growth slipped to negative 0.4%, or positive 1.2% excluding Chinese construction operations.1 For a business targeting market outperformance, an organic revenue contraction indicates volume erosion at the group level. Performance rebounded in the first half of 2026, delivering 2.9% organic growth and a 4.0% gain in local currencies—led by EMEA at 7.7% and the Americas at 2.9%, while Asia/Pacific contracted 2.0%.6 Although this rebound prompted management to raise full-year sales guidance, it represents a short operational window.
Third, foreign exchange fluctuations persistently erode reported financial performance. Sika reports financial results in Swiss francs while generating the vast majority of revenues internationally. In 2025, currency translation reduced reported growth by 5.4 percentage points, converting a 0.6% local-currency gain into a 4.8% reported sales decline.1 In the first quarter of 2026, foreign currency translation generated a 7.9% top-line drag, impacting Asia/Pacific by 10.5% and the Americas by 10%.15 Because Sika generates revenue in U.S. dollars, euros, and Chinese yuan, local currency growth must consistently outpace exchange rate erosion to expand franc-denominated earnings per share—a structural headwind unmitigated by internal operating efficiency.
Myth versus reality
Three common market assumptions regarding Sika warrant examination against financial disclosures.
Myth: Sika holds a global monopoly. Reality: Sika leads the sector, but it faces an aggressive number-two platform operating across 76 countries with roughly EUR 6.5 billion in revenue, alongside a prominent Italian private group and a $7.4 billion U.S. competitor with strong regional positions.1314 Sika remains the market leader, but it does not control pricing across all segments.
Myth: Construction chemical demand is recession-proof due to counter-cyclical public infrastructure spending. Reality: Public infrastructure provides sales stability, but government projects represent only a portion of total demand. Negative organic growth in 2025—a period characterized by active public infrastructure investment in North America and Europe—demonstrated that commercial construction slowdowns and Chinese real estate contractions outweighed public sector tailwinds.1
Myth: Sika's acquisitions represent routine bolt-on transactions. Reality: Parex and MBCC represented a combined enterprise value of approximately CHF 8 billion, compared to Sika's CHF 34.6 billion market capitalization at year-end 2024.2[^10]11 These were large strategic integrations rather than minor additions, and return on capital metrics have not yet recovered to pre-acquisition levels.1
This evolving market structure and competitive environment frame the strategic choices embedded in management's current growth targets.
VII. Hidden & Future Drivers: Green Building, Circular Concrete, & EV Lightweighting
Evaluating Sika's future growth drivers requires an initial analytical clarification. Industry commentary frequently attributes a mid-single-digit share of total revenue to the company's emerging green technologies. However, Sika provides no formal disclosure for these figures. There is no dedicated segment line for circular concrete, no standalone revenue breakdown for its reCO2ver process, and—following the absorption of the automotive and industrial businesses into regional reporting in 2024—no clean method to isolate e-mobility content.7 This disclosure gap means these initiatives must be evaluated based on underlying industrial mechanisms and market logic rather than quantified financial contributions, even as they represent the primary potential replacement for lost momentum in Chinese property.
Cement production represents one of the largest industrial sources of global carbon emissions because the core chemical reaction releases carbon dioxide directly: calcining limestone to produce clinker drives off carbon dioxide from the raw rock before accounting for any kiln fuel. Switching to renewable electricity cannot fully decarbonize cement production because the chemical reaction itself generates emissions.
Consequently, construction chemicals occupy a critical strategic position. The most immediate practical lever for reducing concrete's carbon footprint is clinker substitution—replacing clinker with industrial by-products such as steel slag, calcined clay, fly ash, or ground limestone filler. However, lowering clinker content degrades key material properties, leading to slower strength development, reduced workability, and extended formwork removal times that increase construction schedules and labor costs. Chemical admixtures counteract these trade-offs, enabling low-clinker mixes to match the performance of traditional concrete and making chemical formulation central to industry decarbonization.
This dynamic provides Sika with a structural growth driver that does not depend on increasing total construction volumes. Instead, it relies on changing the chemical intensity of existing construction, adding higher-value chemical content per cubic meter. This creates a volume-neutral, value-additive demand profile—a distinct mechanism in an industrial sector typically tied to physical volume growth.
A more speculative growth driver involves circular concrete technology. Sika's reCO2ver process applies what the company describes as a chemo-mechanical treatment to concrete demolition waste, carbonating the surface of the cement matrix before abrading the softened material away to expose fresh surfaces for additional carbonation.16 The process yields two reusable materials: clean secondary aggregate that functions similarly to natural gravel, and a powdered cement-stone fraction that can be reactivated with additives to substitute for cement. In the five largest European Union countries alone, approximately 300 million metric tons of concrete waste are generated annually; Sika estimates that complete recycling of this volume could sequester up to 15 million metric tons of carbon dioxide.16 Internal claims for the technology include a 25% reduction in cement content, up to 40% less water usage, and primary material substitution rates significantly exceeding the industry average of roughly 30%.16
Despite these technical performance claims, reCO2ver remains an IP-protected technology at the industrial-pilot and proof-of-concept stage.16 Sika discloses no revenue from the process. Consequently, the technology represents long-term optionality rather than a measurable commercial asset. Its ultimate economic viability depends on regulatory pressures—such as carbon pricing, mandatory recycled-content quotas, and embodied-carbon disclosures—raising the cost of virgin aggregates and clinker sufficiently to make large-scale recycling commercially competitive without subsidies.
The second driver involves automotive and industrial bonding. The engineering logic relies on stress distribution: spot-welding two metal panels concentrates structural stress at discrete points, whereas bonding them along a continuous seam with a structural adhesive distributes loads across the entire joint, allowing manufacturers to use thinner, lighter materials without sacrificing structural rigidity. Adhesives also bond dissimilar materials—such as aluminum to steel or composites to metal—that cannot be joined by traditional welding, while providing vibration damping that becomes critical in electric vehicles lacking internal combustion engine noise to mask cabin sound.
Vehicle electrification introduces additional material requirements, including sealing and structurally bonding battery enclosures to withstand impact, manage thermal runaway, and maintain watertight integrity over the vehicle's lifespan. Electric platforms also require thermally conductive adhesives to transfer heat from battery cells to cooling plates, alongside specialized acoustic treatments for quiet vehicle cabins. Chief Executive Officer Thomas Hasler framed digitalization and electrification as global structural trends, stating that the company was "ideally positioned to benefit."5
This assertion requires critical evaluation against reporting changes and market conditions. Sika integrated its previously standalone Global Business unit into its regional reporting structure on January 1, 2024, eliminating standalone disclosures for automotive revenue and operating profitability.7 Concurrently, automotive end markets experienced heightened volatility, marked by sluggish European vehicle production, intense pricing pressure among Chinese electric vehicle suppliers, and slower Western electric vehicle adoption relative to 2021 projections. While structural adhesive content per vehicle increases with electrification, the reduction in financial disclosures prevents external verification of Sika's market share gains or margin realization in this segment.
The third driver stems from construction automation, primarily 3D concrete printing, driven by persistent labor shortages across developed markets. Printing structural elements requires specialized mortars that balance conflicting physical properties: the material must flow smoothly through a printer nozzle, set rapidly to support subsequent layers, and form strong inter-layer bonds as it cures. While formulating these mortars matches Sika's core research capabilities, commercial 3D-printed construction volumes remain negligible compared to traditional building methods, and Sika discloses no revenue from the niche.
These three growth vectors share a distinct underlying mechanism: each depends on regulatory mandates and labor economics rather than underlying construction volume. Low-carbon concrete adoption is driven by updated building codes, public procurement criteria, and mandatory embodied-carbon disclosures. Circular aggregates rely on rising landfill fees, virgin material taxes, or statutory recycled-content quotas. Structural adhesive adoption in manufacturing expands under stringent vehicle emissions standards and efficiency targets. Construction printing relies on the high cost and scarcity of skilled labor.
This creates a risk profile that contrasts sharply with Sika's core business. While traditional construction chemicals depend on macroeconomic construction cycles and remain relatively insulated from political shifts, these emerging drivers are largely insulated from short-term construction cycles but highly sensitive to regulatory changes. A rollback of embodied-carbon mandates or a delay in electric vehicle adoption targets would not erode Sika's baseline revenues, but it would delay the growth trajectory needed to offset structural deceleration in traditional markets like Chinese residential property. Consequently, long-term growth expectations for these technologies remain fundamentally tied to the stability of regional regulatory frameworks.
In summary, these emerging technologies offer long-term strategic potential rather than near-term earnings support for 2026. At Sika's Capital Markets Day in Zurich on March 10, 2024, management centered its strategy on durability and circularity, with Hasler asserting that "climate change and increasing resource scarcity require sustainable solutions" and that enhanced durability yields both environmental and economic gains.17 While the strategic framework is coherent, management has provided no quantified disclosure regarding the current revenue or earnings generated by these initiatives. Until detailed financial tracking is provided, these technologies are best evaluated as unquantified strategic options.
Evaluating whether management can translate these long-term concepts into financial returns requires examining the executive leadership and operational governance driving the company.
VIII. Management, Capital Allocation, & Strategy 2028 Execution
Sika's executive leadership is defined above all by insider continuity. Chief Executive Officer Thomas Hasler assumed the role in 2021 after nearly three decades at the company, having previously directed the Global Business unit and served as Chief Technology Officer.18 A chemist by training and an operator by background, his appointment signaled a deliberate strategic transition: following the aggressive expansion under Jan Jenisch and subsequent operational stabilization under Paul Schuler, the board selected a technologist to oversee an integration-focused decade.
Chief Financial Officer Adrian Widmer has held his role since 2014, serving as the primary anchor of institutional continuity.18 Widmer guided financial operations through the Saint-Gobain takeover defense, the CHF 2.08 billion share repurchase, the financing of the Parex and MBCC acquisitions, and the subsequent balance sheet deleveraging. A twelve-year CFO tenure presents a double-edged dynamic for investors—weighing deep institutional memory against potential inertia regarding past capital decisions—yet Widmer remains the executive tasked with evaluating the returns on transactions he structured.
The broader Group Management team consists of eight executives: regional leaders Mike Campion (Americas), Christoph Ganz (EMEA), and Philippe Jost (Asia/Pacific); Patricia Heidtman as Chief Innovation & Sustainability Officer; Philipp Irniger heading Construction; and Raffaella Marzi overseeing human resources, legal affairs, and compliance.18
The board of directors has undergone significant restructuring toward international industry expertise. Thierry F. J. Vanlancker was appointed Chairman in 2024 after joining the board in 2019, succeeding Paul Hälg, who led the defense against Saint-Gobain.19 Vanlancker previously led AkzoNobel, shifting board leadership from a Swiss industrial perspective to an international chemical executive. The board has refreshed its membership extensively, adding audit committee chair Thomas Aebischer in 2024, Frankie Ng in 2025, and both Barbara Frei and Lukas Gähwiler in 2026, alongside nomination and compensation chair Justin Marshall Howell, who has served since 2018. All nine directors are classified as independent.19
Replacing roughly half the board's membership within three years under an external chairman represents a substantial repositioning. While disclosures do not specify whether this turnover reflects routine succession planning or board dissatisfaction with recent operating performance, the evolving governance structure warrants continued observation alongside financial results.
Management alignment relies heavily on structured incentive programs. Sika's executives are career managers rather than major equity holders, with direct shareholdings representing a minor fraction of the company's total equity. Consequently, executive alignment depends on the design of the long-term incentive plan, including metric weightings, performance periods, and relative peer groups detailed in the annual compensation report.20 Evaluating this structure requires checking whether incentive benchmarks prioritize metrics where execution has lagged—specifically return on capital employed and local-currency organic growth—rather than relying on absolute earnings or share price performance, which can mask underlying capital efficiency in a serial acquirer.
Capital allocation effectiveness faces a crucial test under Strategy 2028, titled "Beyond the Expected." Launched at the Capital Markets Day on October 3, 2023, the plan established four primary financial targets: annual local-currency sales growth of 6% to 9%, an EBITDA margin between 20% and 23%, return on capital employed between 20% and 25%, and operating free cash flow exceeding 10% of net sales. Non-financial goals targeted a 20% absolute reduction in Scope 1 and 2 emissions compared to 2022, a 15% reduction in waste and water per ton sold relative to 2023, and employee engagement above 80%.7
Full-year results for 2025 revealed mixed execution against these targets. Local-currency sales growth registered at 0.6%, well below the 6% to 9% target band. The reported EBITDA margin reached 18.4%—or 19.2% adjusted for restructuring expenses—missing the 20% to 23% goal. Reported return on capital employed stood at 12.3%, significantly below the 20% to 25% target. Operating free cash flow served as the sole financial highlight, reaching CHF 1,356.1 million, or 12.1% of net sales, exceeding the 10% threshold.1
This performance profile reflects strong cash conversion paired with top-line and return pressures. While working capital management and capital intensity remained disciplined, organic growth stagnated, and returns on the capital deployed during recent acquisition sprees trailed target levels.
Management addressed these operational gaps on November 27, 2025, by launching the "Fast Forward" restructuring program. The initiative targeted annual cost savings of CHF 150 million to CHF 200 million by 2028, with approximately CHF 80 million realized in 2026. The program budgeted one-time restructuring costs of CHF 80 million to CHF 100 million in 2025 and allocated CHF 120 million to CHF 150 million for digital investments through 2028—focusing on software platforms, data analytics, automated manufacturing, and supply chain optimization—while initiating structural adjustments in Chinese operations.5
One-time restructuring charges exceeded initial expectations, totaling CHF 108 million, with CHF 86 million impacting EBITDA and reducing the reported 2025 margin to 18.4%, compared to the adjusted 19.2%.1 Total workforce headcount declined 2.2% to 33,707 employees.1
While management provided transparent disclosures regarding restructuring costs and timelines, launching a cost-reduction program indicates that the operating cost structure built for higher expansion rates was misaligned with actual market volume. Consequently, near-term margin support relies heavily on structural cost reductions rather than top-line operating leverage.
Results published for the first half of 2026 highlighted shifting operational dynamics. Net sales reached CHF 5.59 billion, representing a 1.5% decline in Swiss francs but a 4.0% gain in local currency, driven by 2.9% organic growth and 1.1 percentage points from acquisitions. EBITDA reached CHF 1,063.0 million, expanding the margin by 10 basis points year-over-year to 19.0%. Net profit stood at CHF 552.1 million, producing diluted earnings per share of CHF 3.43. Operating free cash flow generated CHF 139.6 million—a typical seasonal pattern for the first half that leaves full-year cash conversion dependent on second-half performance—while employee engagement reached 88 index points, surpassing strategic targets.6
Concurrently, management adjusted full-year 2026 guidance, raising expected local-currency sales growth from a range of 1% to 4% up to 3% to 6%, while reducing EBITDA margin expectations from 19.5% to 20.0% down to 19.0% to 19.5%.16
This dual adjustment marks a tactical shift toward prioritizing sales volume over margin expansion. In contrast to the preceding two years, during which Sika protected operating margins while volumes flattened, the updated guidance indicates that recent volume gains—supported by data center demand, infrastructure contracts, and acquisitions such as Akkim in Turkey, which generates approximately CHF 220 million in annual sales and is expected to close in the third quarter of 2026, and Finja in Sweden—carry a lower average margin profile than the group average.6
The strategic validity of this trade-off depends on the durability of Sika's competitive moat. If specification lock-in remains robust, securing market share at slightly lower initial margins represents a sound long-term trade given the high switching costs in civil construction. Conversely, if volume expansion reflects a permanent mix shift toward commoditized distribution products, the margin adjustment indicates structural pricing pressure rather than a temporary tactical sacrifice.
Management's commentary during 2026 earnings calls reflected a pragmatic approach to operating headwinds. During the first-quarter call in April 2026, executives highlighted North American data center expansion, outlined how seasonal factors temporarily inflated China's relative contribution to regional sales—representing roughly one-third of Asia-Pacific revenue in the first quarter versus a typical half—and declined to quantify tariff or inflation impacts, citing "almost daily, weekly changes" that made estimates "too early."15 On the same call, when asked directly whether the material margin could fall below the 54% to 55% band if input costs spiked, Chief Financial Officer Adrian Widmer acknowledged: "Yes, it is possible."15
While management's direct acknowledgment of downside risks offers operational clarity, the rapid adjustment of guidance—reiterating the 19.5% to 20.0% margin range in April before trimming it in July—underscores ongoing forecasting challenges in a volatile market.615 This forecasting sensitivity emphasizes the need for a measured evaluation of the Strategy 2028 financial targets, which management continues to affirm despite trailing three of the four core metrics.1
IX. The 7 Powers, Porter's 5 Forces, & Strategic Moat Analysis
Evaluating Sika through Hamilton Helmer’s 7 Powers framework reveals a strategic moat with uneven strengths across its product portfolio.
Scale economies — moderate, and more subtle than they appear. Sika's global footprint provides purchasing leverage across polymers, resins, and amines, alongside research and development resources that regional competitors cannot match. However, traditional chemical manufacturing scale curves do not fully apply because freight economics prevent centralized mega-factories. Instead, Sika relies on density economies: a distributed network of small, local facilities positioned near end markets. While this network creates significant freight and service barriers against new local entrants, it protects regional market share rather than establishing a cost advantage that prevents competitor entry—enabling Saint-Gobain to rapidly assemble EUR 6.5 billion in construction chemical sales through acquisitions.13
Process power — high, and the most underrated element. The company's primary intellectual property lies not in patents, but in accumulated, decentralized expertise: knowing how to adapt chemical formulations for specific cements, regional aggregates, fluctuating ambient temperatures, and local regulatory standards within days rather than months. Built across decades of site trials and embedded within thousands of technical service personnel, this institutional knowledge represents classic process power that improves with scale and cannot be easily purchased or replicated.
Cornered resource — medium, and eroding at the margin. Deep integration into engineering practice, municipal building codes, and architectural specification databases functions as a valuable institutional resource. However, that advantage is eroding as specification systems digitize and open up. Major contractors and building owners increasingly specify materials by performance criteria rather than proprietary brand names, lowering the barrier for qualified rivals to submit alternative bids.
Switching costs — high on complex work, weak on simple work. Switching costs vary widely across the portfolio. For subterranean waterproofing in a rail tunnel, switching costs are near-prohibitive because the engineer of record assumes professional liability for any product substitution. For trade distribution items like bagged tile adhesive, switching costs depend primarily on price lists and distributor shelf space. Sika's serial acquisitions have expanded its exposure to these trade channels, shifting its overall product mix toward categories with lower customer switching costs.
Counter-positioning — low. Sika's direct technical sales model offers distinct advantages over reliance on third-party distributors, but it does not constitute counter-positioning. Main competitors like Mapei and Saint-Gobain maintain their own technical sales teams. Because rivals can replicate the model without damaging their existing businesses, Sika's sales model reflects operational excellence rather than structural counter-positioning.
Network effects — essentially absent. Network effects remain virtually absent. While multinational contractors develop familiarity with Sika systems across international projects, this multi-project preference reflects brand trust rather than a true network effect.
Branding — high, and of an unusual type. Sika's brand strength does not rely on consumer recognition; it commands professional permission. Specifying Sika on a high-liability structural application provides engineers and contractors with a defensible, industry-standard choice. In liability-sensitive civil engineering, this risk-mitigation dynamic creates a durable brand moat akin to historical enterprise technology standards.
Applying Porter's Five Forces provides additional clarity on current industry dynamics.
Threat of new entrants — low in engineered specifications, moderate in trade distribution. While blending mortar requires minimal capital, duplicating the local certifications, performance trial data, technical field staff, and engineering specification history required for major civil infrastructure represents a high barrier to entry. Conversely, barriers are significantly lower in trade mortar and retail distribution channels, where new entrants primarily require local mixing facilities, brand marketing, and distributor shelf access.
Buyer power — low to moderate, but rising among large contractors. Historically, contractor fragmentation and the low cost of chemical admixtures relative to total project budgets limited buyer bargaining power. However, consolidation among major global construction firms and infrastructure developers has led to centralized framework agreements across multiple projects, concentrating purchasing power and increasing price pressure on large tenders.
Supplier power — moderate and cyclical. Raw material inputs—primarily petrochemical derivatives including epoxy resins, polyurethane precursors, acrylic acid, and polymers—are sourced from competitive commodity markets but remain subject to rapid price volatility. Sika's chief financial officer noted on the first-quarter 2026 earnings call that the company's material margin could temporarily fall below the 54% to 55% range if raw material costs spiked abruptly.15 While Sika maintains pricing power, passing cost increases through to customers involves a lag of several quarters.
Threat of substitutes — very low. No viable non-chemical alternatives exist for core applications such as subterranean tunnel waterproofing, high-rise concrete pumping, or structural automotive bonding. Threat of substitution remains a competitive dynamic between rival chemical formulations rather than a technology replacement threat.
Competitive rivalry — moderate and intensifying. Industry consolidation has transformed the competitive landscape. Sika now competes against an expanded Saint-Gobain platform operating across 76 countries, a family-owned Mapei, a consolidated RPM International in North America, and Cinven-owned Master Builders Solutions operating the divestment assets required from the MBCC transaction.[^14]13 While competition remains disciplined due to liability considerations, the number of capable global bidders on major infrastructure projects has increased substantially.
Sika retains a formidable competitive moat concentrated in high-consequence, engineered applications where process power, liability-driven switching costs, and plant density converge. However, that moat is narrower in retail trade mortar and distribution channels, which represent a growing share of overall group revenue following major acquisitions. While Sika's moat effectively protects unit profitability and gross margins, it has not insulated sales volumes during broader construction downturns—leaving market volume recovery as the central variable in its valuation narrative.
X. Bear vs. Bull Stress Test & Material Risk Radar
A stress test of Sika's investment thesis pits the bear case against the bull narrative across four primary operational challenges.
Challenge one: growth was bought, not earned. The central bear argument begins with arithmetic. Sika deployed CHF 2.5 billion for Parex and CHF 5.5 billion for MBCC—representing CHF 8 billion in combined enterprise value—yet full-year 2025 organic growth contracted by 0.4%.1[^10]11 Group net sales of CHF 11.2 billion in 2025 compare to approximately CHF 8 billion on a pro forma basis around the time of the Parex closing, indicating that the bulk of top-line expansion over the past seven years stemmed from dealmaking rather than organic volume generation.110 Excluding acquisitions, the underlying business remained largely stagnant during a period that coincided with significant federal infrastructure spending in the United States.
Management's response centers on geographical concentration: a severe downturn in Chinese residential construction accounted for the majority of top-line drag. Excluding Chinese construction operations, 2025 organic growth reached positive 1.2%, while the broader Asia/Pacific region ex-China expanded 2.5% in local currency.1 Performance rebounded further in the first half of 2026, delivering 2.9% organic growth group-wide, led by a 7.7% local-currency gain in EMEA.6 Sika contends that a single regional market shifted from its primary growth driver to its main headwind, and that current footprint adjustments in China leave the broader business positioned for acceleration.
The counter-argument highlights capital allocation discipline. China shifted from a growth driver to a structural drag partly because Sika acquired Parex and its extensive Chinese distribution footprint near the peak of the local property cycle. Buying into a market peak represents a capital allocation outcome rather than an unpredictable external shock. Moreover, stripping out underperforming units offers limited analytical utility when evaluating consolidated returns.
Challenge two: balance sheet leverage and integration fatigue. Critics point to CHF 8 billion in combined transactions, an interest rate environment that tightened significantly during integration, and a reported return on capital employed that fell to 12.3%.1 In response, Sika points to solid cash generation: operating free cash flow reached CHF 1,356.1 million in 2025, or 12.1% of net sales—up from 11.9% the prior year and above the 10% Strategy 2028 threshold—enabling management to reduce net debt and preserve its investment-grade credit rating.1 Converting over one-tenth of revenue into free cash flow while absorbing CHF 108 million in one-time restructuring costs demonstrates significant financial resilience.
Challenge three: declining segment transparency. Absorbing the standalone Global Business unit into regional reporting in January 2024 eliminated external visibility into automotive and industrial financial performance, precisely as leadership designated vehicle electrification a strategic growth engine.57 Similarly, technologies like reCO2ver and circular concrete are highlighted as long-term growth pillars despite a complete lack of dedicated revenue disclosures.16 Expecting investors to price in long-term structural trends without granular disclosures creates analytical friction.
Challenge four: medium-term financial target credibility. Strategy 2028 establishes annual targets of 6% to 9% local-currency sales growth, a 20% to 23% EBITDA margin, and a 20% to 25% return on capital employed.7 Actual performance in 2025 landed at 0.6% local-currency growth, an 18.4% reported EBITDA margin, and a 12.3% reported return on capital employed.1 Although management continues to affirm these multi-year targets, doing so after delivering 0.6% growth creates a noticeable divergence.1 Furthermore, the updated full-year 2026 sales growth guidance of 3% to 6% remains below the low end of the Strategy 2028 target band.6 This gap between medium-term ambitions and near-term operating reality underscores the execution hurdle ahead.
Conversely, the bull case rests on tangible operating evidence.
Sika expanded its material margin across consecutive periods despite volume contraction—rising from 54.5% to 54.9% in 2025, and climbing further from 55.1% to 55.7% in the first half of 2026.16 This margin trajectory provides empirical proof that pricing power remains intact. Operating cash conversion continues to top strategic targets amid ongoing restructuring. Furthermore, internal employee engagement reached 88 index points—a relevant indicator for a direct-specification sales force working directly on job sites.6 Regional organic momentum returned in the first half of 2026, headlined by 7.7% local-currency growth in EMEA.6 Finally, raising full-year top-line growth guidance while completing bolt-on acquisitions in Sweden and Turkey indicates accelerating commercial activity in key end markets.6
The synthesis reveals a high-quality franchise traversing a difficult cyclical trough. Management is responding through cost rationalization and disciplined bolt-on consolidation, though the ultimate returns on capital committed between 2019 and 2023 remain to be fully demonstrated. Both bull and bear arguments derive from the same underlying operational facts: robust pricing power and cash generation paired with muted volume growth and expanded capital bases.
The Material Risk Radar focuses on factors capable of altering the long-term investment thesis:
Construction cyclicality. Civil infrastructure and building refurbishment offer partial ballast—structures age regardless of prevailing interest rates, and public spending follows political rather than commercial cycles. However, a synchronized slowdown across European residential, U.S. commercial, and Chinese property directly tests group volume stability.
Foreign exchange translation. Currency translation represents a persistent headwind for a Swiss-domiciled global producer. A 5.4 percentage-point translation drag in 2025 and a 7.9 percentage-point hit in the first quarter of 2026 illustrate how local-currency gains can be erased when reported in Swiss francs.115
Input cost volatility. Petrochemical price spikes compress material margins with a one-to-two quarter lag, as leadership explicitly acknowledged during 2026 earnings updates.15
Integration and synergy execution. Realizing MBCC revenue synergies—targeted at 35% of the CHF 180 million to CHF 200 million total—requires cross-selling acquired lines across Sika's global network and retaining key technical personnel.12 While cost rationalization is largely straightforward, commercial revenue synergies represent a higher execution threshold across large-scale corporate integrations.
Chinese market reset. Operational adjustments remain underway after Chinese revenues contracted by double digits in 2025.1 The primary uncertainty is whether Chinese operations will stabilize as a smaller, infrastructure-focused growth business or remain permanently subdued.
Competitive consolidation. Saint-Gobain's rapid assembly of a EUR 6.5 billion rival platform represents the most significant shift in industry structure in two decades, with long-term implications for global project pricing.13
Governance and leadership transition. Sika maintains a clean capital structure and a fully independent board of directors.219 The primary governance consideration centers on managing recent board turnover while aligning medium-term financial targets with evolving market conditions.
XI. The Playbook: Business & Investing Lessons
Stripping Sika down to core monitoring metrics yields a concise list.
KPI one: organic sales growth in local currencies, tracked against construction market growth. This primary metric must be evaluated in local currency to eliminate foreign exchange distortion from the Swiss franc, and organically to exclude acquisition contributions. It serves as the single metric distinguishing two competing investment narratives: a high-quality compounder navigating a cyclical trough, or an acquisition roll-up whose core business has stalled. Full-year 2025 organic growth fell 0.4%, whereas the first half of 2026 rebounded to positive 2.9%.16 Sustaining that first-half recovery across subsequent periods would materially alter the investment thesis, while a return to 2025 levels would confirm underlying stagnation.
KPI two: EBITDA margin, evaluated alongside the material margin. Examined together, these metrics reveal the drivers of profitability. If the material margin holds or expands while the EBITDA margin rises, profitability gains reflect pricing power and favorable product mix—a high-quality, repeatable combination. Conversely, if the EBITDA margin rises solely through cost reductions under the Fast Forward restructuring while the material margin stalls, the gain represents a one-time operational reset. Updated 2026 guidance trimming the EBITDA margin target to between 19.0% and 19.5%—down from the earlier 19.5% to 20.0% range—highlights the remaining gap to the Strategy 2028 target of 20% to 23%.167
KPI three: reported return on capital employed. Rather than relying on acquisition-adjusted figures, reported ROCE directly evaluates capital efficiency. The reported figure of 12.3% against the Strategy 2028 target range of 20% to 25% serves as the baseline measure of whether CHF 8 billion in acquisitions is earning its cost of capital.17 This metric will ultimately define management's capital allocation legacy over the past seven years, and it currently exhibits the largest performance gap.
The broader strategic lessons extend beyond Sika:
The most defensible B2B positions involve low-cost inputs with catastrophic failure risks. Sika's underlying economics stem from a structural asymmetry: the buyer's financial downside from product failure dwarfs any cost savings from choosing a cheaper alternative. This dynamic occurs across testing and certification, aerospace fasteners, and medical device components. However, this advantage must be evaluated application by application, as a company may hold a dominant specification lock-in in one product line while competing on price in another. Sika's subterranean tunnel waterproofing and its bagged retail tile adhesive represent fundamentally different business models; treating them as identical represents a frequent analytical misstep.
Physical constraints create durable moats but also limit scale economies. The freight economics and regional formulation requirements that protect Sika within a given metropolitan market also prevent it from achieving the centralized cost efficiencies of a global chemical major. As a result, the construction chemicals sector consolidates primarily through acquisitions rather than organic displacement—enabling a well-capitalized challenger to build market scale faster than an incumbent can expand organically.
Governance defense creates shareholder value but carries a direct financial cost. The 2018 settlement permanently eliminated a dual-class share structure that would have transferred corporate control—and a premium—to a single family and a direct competitor at the expense of public investors.4 Sika's independent directors successfully defended minority shareholder equity through four years of litigation, demonstrating governance resolve under pressure. However, resolving the dispute required deploying CHF 2.08 billion from the company's balance sheet, including a CHF 795 million control premium, to repurchase its own shares.4 Effective corporate governance produces lasting structural benefits, but evaluating capital efficiency requires factoring in the cost of defense.
Diminishing disclosure often signals emerging operational friction. Segment consolidations, retired metrics, and the substitution of qualitative narrative for quantitative detail are typically framed as operational simplifications. While some adjustments reflect genuine streamlining, absorbing the standalone automotive and industrial unit into regional reporting reduced external transparency at the exact juncture when management positioned vehicle electrification as a central growth pillar.57
More than a century after its founding on a waterproofing admixture for an Alpine rail tunnel, Sika continues to sell the same core value proposition: that the lowest-cost insurance for a high-liability structure is its unseen chemical foundation. That proposition has navigated major global conflicts, mid-century financial distress, a four-year governance conflict, and the severe contraction of Chinese residential property.
Whether Sika can compound capital at the rate implied by past premium valuations remains an open question. Over the coming quarters, organic sales growth and reported returns on capital will provide the definitive test.
References
-
Sika reports full-year 2025 results – Executing plan to accelerate growth — Sika AG, 2026-02-20 ↩↩↩↩↩↩↩↩↩↩↩↩↩↩↩↩↩↩↩↩↩↩↩↩↩↩↩↩↩
-
Sika, Burkard Family and Saint-Gobain Find Overall Agreement — Sika AG, 2018-05-11 ↩↩↩↩↩↩↩↩↩↩↩↩↩↩
-
Sika presents strategic "Fast Forward" program for profitable growth and digital leadership — Sika AG, 2025-11-27 ↩↩↩↩↩
-
Sika delivers 4.0% local currency revenue growth and upgrades full-year growth expectations — Sika AG / GlobeNewswire, 2026-07-28 ↩↩↩↩↩↩↩↩↩↩↩↩↩↩↩↩↩↩↩
-
"Beyond the Expected": Sika launches new growth strategy 2028 with more ambitious targets — Sika AG / GlobeNewswire, 2023-10-03 ↩↩↩↩↩↩↩↩↩↩
-
Sika, Saint-Gobain End Bitter 4-Year Takeover Battle — Reuters, 2018-05-11 ↩↩↩↩↩↩
-
Sika Completes Acquisition of Parex — Sika AG, 2019-05-23 ↩↩↩
-
Sika Agrees to Buy MBCC Group in $6 Billion Deal — Reuters, 2021-11-11 ↩↩↩
-
Sika Successfully Closes MBCC Acquisition and Strengthens Position as Sustainability Champion in the Global Construction Industry — Sika AG, 2023-05-02 ↩↩↩↩↩
-
Saint-Gobain completes the acquisition of Fosroc — Fosroc / Saint-Gobain, 2025-02-10 ↩↩↩↩↩↩↩
-
RPM International Inc. Reports Record Fiscal 2025 Results — TradingView News, 2025-07-24 ↩↩
-
Earnings call transcript: Sika AG exceeds revenue forecast in Q1 2026 — Investing.com, 2026-04-14 ↩↩↩↩↩↩↩
-
Sika Capital Markets Day: Unlock Growth – Durability and Circularity in Construction and Industry — Sika AG, 2024-03-10 ↩
 LinkedIn
 WhatsApp
 Reddit
 Hacker News
 Email
Email Kindle
 RSS Feed
 Spotify
 Apple Podcasts
 Amazon Music
 Audible
 YouTube