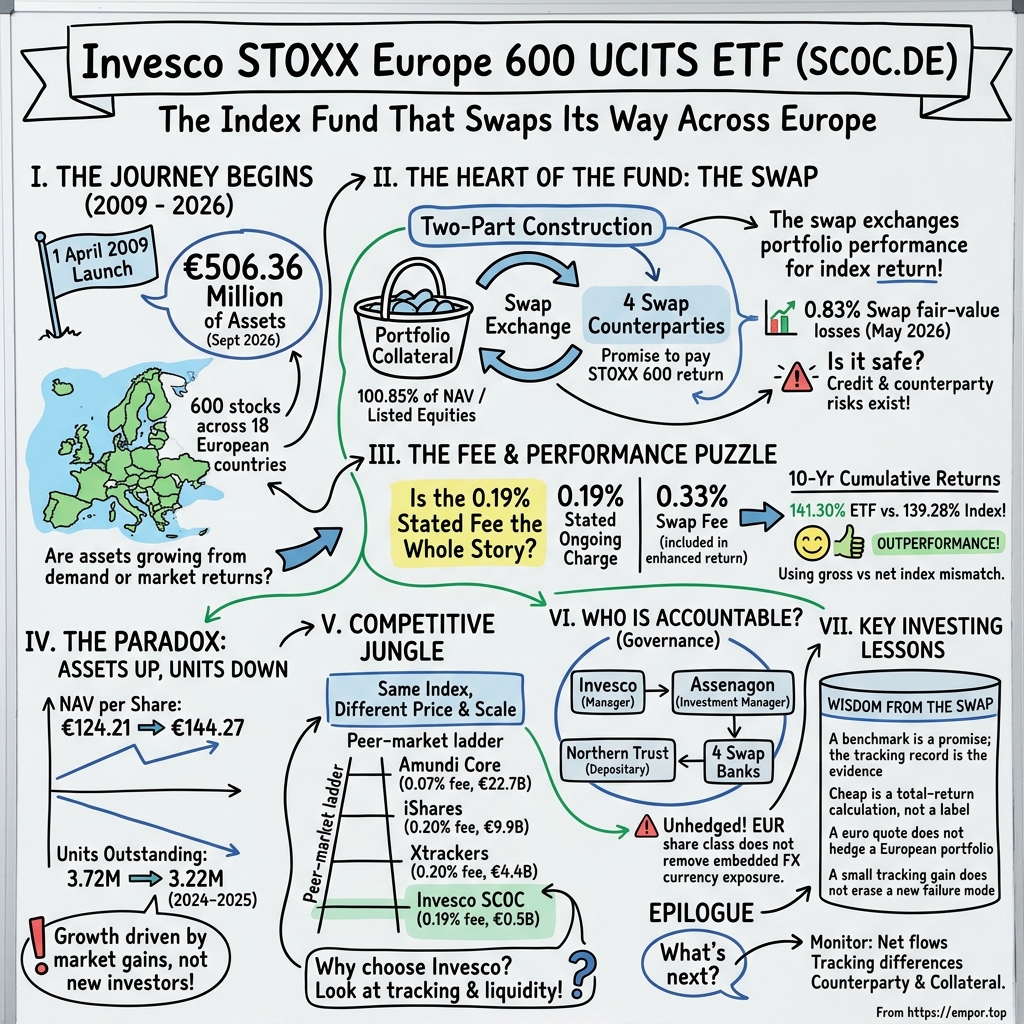
Invesco STOXX Europe 600 UCITS ETF: The Index Fund That Swaps Its Way Across Europe
I. The €506 Million Fund With Four Swap Counterparties
On the last day of May 2026, an accountant in Dublin closed the books on a fund that looked, at first glance, like it had made a small arithmetic mistake. The listed shares it owned were worth more than the whole fund. Add up every equity in the portfolio and the total came to a little over 100.85% of net asset value, about €562.6 million against net assets of roughly €557.8 million.3 The gap was not an error. Sitting beside the shares was a set of derivative contracts with four banks, and on that day those contracts were worth a negative 0.83% of the fund, a loss of about €4.6 million.3 Shares worth slightly too much, contracts worth slightly too little, and between them, almost to the euro, the value of a fund designed to deliver the return of six hundred European companies.
There was one more number in that schedule that would make any corporate treasurer blink. The fund's reported cash balance was €143.3 Not €143 million, not €143 thousand. One hundred and forty-three euros, held with The Northern Trust Company, in a vehicle with more than half a billion euros of assets.3 For an operating company that would be a crisis. For this fund it was simply a sign of how fully invested the machine was, and of where its real liquidity lived: not in a bank account, but in the shares it held and the contracts it had signed.
This is the Invesco STOXX Europe 600 UCITS ETF, and specifically its euro-denominated accumulating share class, ISIN IE00B60SWW18, which trades on Deutsche Börse's Xetra market under the symbol SC0C.1 At the end of September 2026 the share class held about €506 million of assets.2 It sits inside Invesco Markets plc, an Irish umbrella company that houses many separate sub-funds, each with its own portfolio and its own investors.4 The fund tracks the STOXX Europe 600, an index of six hundred large, mid-sized and smaller companies across Europe.2 And it does so in a way that surprises many of the people who buy it: it does not simply hold those six hundred companies. It holds a basket of shares, and it relies on swap contracts to turn that basket's return into the index's return.
That distinction is the whole story. Most investors who buy a European index fund imagine a neat miniature of the market: a sliver of Nestlé, a sliver of ASML, a sliver of every bank and brewer and utility on the continent, weighted exactly as the index weights them. A physically replicated fund works roughly like that. A synthetically replicated fund like this one works differently. Think of it as two promises stacked on top of each other. The first is the portfolio, a real collection of real shares the fund owns outright. The second is the swap, a contract in which a bank agrees to pay the fund whatever the index earns, in exchange for receiving whatever the portfolio earns. If the bank honours the contract, the investor gets the index. If the portfolio and the index happen to diverge, the swap's value moves to bridge the difference, and that is exactly what the May 2026 numbers show: a portfolio running a little ahead of the index, and a swap marked a little below zero to pull the total back into line.
Before going further, it is worth being blunt about what this story is not. This is not a story about Invesco Limited, the Atlanta-headquartered asset manager whose name is on the label. The fund's net asset value, its returns and its growth belong to the sub-fund's investors. They are not Invesco's revenue, Invesco's profit or Invesco's growth.4 The manager earns a fee from the fund, but the half-billion euros in the fund are not on Invesco's balance sheet, and a strong year for European equities does not show up as a strong year in Invesco's income statement except through the fee. Readers used to company stories will find no chief executive to profile, no factory to visit, no product roadmap to debate. What they will find is an implementation: a set of legal, contractual and financial choices about how to deliver a benchmark. The story turns on whether those choices hold up.
Four questions frame that test, and they will run through everything that follows. The first is about demand. The fund has grown in total assets over the past few years, but is that because investors are choosing it, or because European stocks have gone up and dragged the fund's value along with them? The second is about the swap itself. Synthetic replication is supposed to deliver tighter tracking, sometimes even a small return advantage, in exchange for taking on counterparty risk. Does the evidence show the benefit is real, and is it large enough to justify the risk and the complexity? The third is competition. The STOXX Europe 600 is not a secret. Several far larger funds offer the same index, at least one of them at a fraction of this fund's stated charge. Why would anyone choose this one? The fourth is currency. The share class is quoted and settled in euros, which leads many investors to assume they carry no foreign-exchange risk. Is that assumption right?
None of these questions can be answered with a single number, and some of them cannot be fully answered with the information the fund publishes. But each has a body of evidence behind it, in the fund's audited annual report, its half-year interim report, its factsheet, its key information document and its offering papers. The aim here is to read that evidence the way a careful long-term investor would: to separate what the fund claims from what its record shows, and to say plainly where the record runs out.
The answers matter more than the modest size of the fund might suggest. Exchange-traded funds have become the default way millions of Europeans own their own stock market. Most of those investors choose by headline fee and by brand. This fund is a test case for whether those are the right things to look at. Its headline fee is higher than its cheapest competitor's. Its structure involves risks that a physical fund does not carry in the same form. And yet, over the decade to September 2026, its return slightly beat the index comparator printed on its own factsheet.2 Explaining how all three of those things can be true at once requires going back to the beginning, to a spring in 2009 when Europe's markets were still reeling and a young ETF provider decided to build its funds out of contracts.
 Subscribe on LinkedIn
II. A 2009 Launch Built for One Job
The fund opened for business on 1 April 2009, and its accumulating euro share class opened the same day.2 It is hard to overstate how strange a moment that was to launch a European equity product. Global markets had hit their post-crisis lows only weeks earlier. Banks across the continent were still being propped up by governments. The idea that an investor would want to pay a bank to deliver the return of European stocks, in the middle of a banking crisis, sounds almost perverse in hindsight. Yet that is what this fund was built to do, and it was built that way on purpose.
The fund began life under the brand of Source, a European ETF provider that specialised in exactly this kind of swap-based product.7 Source's pitch was simple and, for its time, provocative. If an investment bank's trading desk could deliver an index return more precisely and more cheaply than a fund could by buying and rebalancing hundreds of stocks itself, why not let the bank do it? The fund would hold collateral, the bank would deliver the index, and the investor would get a cleaner result. Source built a range of funds on that model, and in August 2017 Invesco completed its acquisition of the whole business, adding roughly $18 billion of Source-managed assets to its European lineup.8 The name on the door changed, and the STOXX Europe 600 fund became an Invesco fund. The machinery underneath, swap-based replication run through an Irish umbrella, did not.
What the fund was meant to deliver is defined with unusual precision. Its objective is to provide the performance of the STOXX Europe 600 Net Total Return Index, less fees.5 That is all. It does not try to beat the market, pick sectors or avoid bad companies. It promises a benchmark and nothing else. This narrowness is a feature, and it shapes how the fund should be judged. A stock-picker can be forgiven a bad year if the thesis is sound. An index fund has no thesis to hide behind. Every basis point of difference between what it returns and what the index returns is either a cost the investor bore or a benefit the implementation produced.
The index itself deserves a moment, because it is the raw material of the whole product. The STOXX Europe 600 is a rules-based list of six hundred companies drawn from eighteen European countries, spanning large, mid and small capitalisations.2 Its constituents are weighted by free-float market capitalisation, which means each company counts in proportion to the value of its shares that are actually available to trade, not the shares locked up with founding families or governments.9 No single constituent may exceed 20% of the index.2 In practice, that cap rarely binds, because the index is broad. What it does is reach well beyond the familiar household names. A listener who owns this index owns Europe's giant pharmaceutical and luxury groups, but also hundreds of mid-sized industrial firms, regional banks and smaller listed companies that rarely make headlines. That breadth is the reason many investors choose the STOXX 600 over narrower benchmarks such as the Euro Stoxx 50. It is also the reason physical replication is harder than it sounds: buying, holding and rebalancing six hundred stocks across a dozen and a half markets, each with its own settlement rules, trading costs and dividend taxes, is real work.
It helps to see the fund's mechanics through the eyes of the people who actually create and redeem its shares. Ordinary investors buy and sell SC0C on Xetra, trading with each other and with market makers at whatever price the market sets.1 Behind that trading sits a primary market. Large financial firms, known as authorised participants, can ask the fund to create new shares by delivering cash or securities, or to redeem existing shares by handing them back. When demand for the fund rises, they create shares and the unit count goes up. When investors leave, they redeem and the unit count goes down.6 This is not the same thing as a company issuing equity or buying back stock. Nobody is raising capital to build anything. The fund simply expands and contracts like an accordion, holding more or fewer assets in proportion to the number of units investors want to own. That accordion motion, as the story will show, is one of the most revealing clues about whether investors actually want this particular fund.
Because there is no operating business, the fund's history has none of the drama of a typical corporate story. No acquisitions to integrate, no product launches to bet on, no founders feuding in the boardroom. Its only real strategic decision was made at birth: to deliver the index synthetically rather than physically. Everything else, the fee, the swap fee, the counterparties, the collateral rules, flows from that choice. And that choice looks different in 2026 than it did in 2009.
In 2009, the argument for synthetic replication was strong. Physical index funds of the era often lagged their benchmarks by visible margins, held back by trading costs, cash drag and dividend withholding taxes that they could not reclaim. Swap-based funds could promise to deliver the index almost exactly, because the bank absorbed those frictions. Over the following decade, however, the industry changed. Physical funds grew enormous, and with scale came cheaper trading, securities lending revenue to offset costs, and fees that fell toward zero. Regulators and investors, chastened by 2008, grew wary of counterparty risk. Many European investors came to prefer physical funds on principle, even when synthetic ones tracked better. By the mid-2020s the STOXX Europe 600 had become one of the most commoditised exposures on the continent, available from several providers at a fraction of the costs that prevailed when this fund was born.
So the relevant history for an investor today is not the 2009 launch. It is what happened after the advantages that justified that launch began to erode. Does the synthetic structure still earn its keep when physical rivals have become cheaper and bigger? To answer that, it is necessary to open the machine and look at how the portfolio and the swap actually fit together.
III. The Portfolio Is the Collateral; the Swap Is the Promise
Picture the fund's holdings schedule at the end of May 2026, and then imagine showing it to an investor who believes they own a slice of the European stock market. Near the top of the list of largest positions sits Micron Technology, the American memory-chip maker, at about 4.66% of net assets.3 Micron is not European. It is not in the STOXX Europe 600. It never has been. A little further on sits the Swiss luxury group Richemont at about 5.56% of the fund and the Swiss drug maker Roche at about 4.34%.3 Both are genuine index members, but at those weights they loom far larger in this portfolio than they do in the index, where even Europe's biggest companies typically account for a few percent. Look at the country breakdown and the surprises multiply. In the sections of the interim schedule that set out holdings by country, Switzerland accounted for about 21.9% of the fund, Sweden about 13.1%, and the United States, a country with no place in a European index, about 17.5%.3
To an investor expecting a mirror image of Europe, this looks alarming. It is, in fact, exactly how the fund is supposed to work. The holdings schedule describes what the fund owns. It does not describe what the fund earns. That distinction was established by the swap.
Under the swap agreements, the fund exchanges the basket's return for the index's return with its bank counterparties.5 If the basket goes up 10% and the index goes up 8%, the fund owes the banks the difference, and the swap is marked at a loss. If the basket goes up 6% and the index goes up 8%, the banks owe the fund the difference, and the swap is marked at a gain. Either way, once the swap is settled, the fund ends up with the index return. The basket remains the fund's property, giving it assets to fall back on if a bank fails.
This is what the industry calls an unfunded swap structure. The fund does not hand its cash to the bank; it keeps the assets and swaps only the performance. That is an important protection. If a counterparty collapsed tomorrow, the fund would not be left holding an empty IOU. It would still own the basket. What it would lose is the bank's promise to convert that basket's return into the index's return, along with whatever the swap was worth at the time.
Why would the basket contain American chip makers at all? Because the basket's job is not to resemble the index. Its job is to be valuable, liquid and acceptable under the fund's rules, and the offering documents allow the fund to hold securities that are not index constituents.6 The banks that act as counterparties often want to swap out the return of shares they already hold or can finance efficiently, and the fund can accept those shares as long as they meet the eligibility criteria. Think of the basket as a pantry and the swap as a catering contract. The pantry needs to be stocked with good food that could be sold in an emergency. It does not need to contain the exact dishes on tonight's menu, because the caterer has promised to deliver those regardless. What matters is that the pantry is worth enough, and that the caterer shows up.
This is also why the country weights in the holdings schedule can mislead. A reader who sees 17.5% American exposure might conclude the fund is betting on the United States. It is not, at least not economically. As long as the swaps perform, the fund's return is the European index's return, and the American shares in the basket are there to be held, not to drive results. The holdings tell you where the basket sits. The index tells you where the return comes from.
Now return to that small negative number. At the end of May 2026, the swaps carried a combined fair-value loss of about 0.83% of net assets, spread across four counterparties, with the largest single unrealised loss, about 0.48% of net assets, owed to Société Générale.3 What does that mean? It means that on that date the basket had done slightly better than the index since the swaps were last reset, so the fund owed the banks a little money to hand back the excess. A negative swap value, in this structure, is a sign that the fund is in debt to its counterparties, not the other way round. On that particular day, if any one of the four banks had failed, the fund would not have been owed money by it. In the narrow sense, the fund's exposure to its counterparties was the reverse of a credit risk.
That observation is true and also dangerous if taken too far, which is why it is worth being precise. A swap mark is a snapshot. It tells you what the contract was worth at one moment, under one set of prices. It says nothing about what the contract could be worth a week later if European markets rallied hard while the basket lagged, and the banks suddenly owed the fund a large sum. It says nothing about what would happen if a bank failed at exactly that moment, or about how quickly the fund could replace a failed counterparty with a new one, or about what that replacement would cost in a stressed market when every bank is nervous. The key information document is explicit on this point: because the fund relies on counterparties to deliver index performance, it is exposed to loss if one of them becomes insolvent.10 A reported mark-to-market loss of 0.83% is a reassuring data point about May 2026. It is not a ceiling on what could go wrong.
UCITS rules, the European regulatory framework under which the fund operates, cap how much exposure a fund can have to any single derivative counterparty, generally at 10% of net assets for a credit institution, and swap-based funds manage that limit by resetting their swaps when gains accumulate.6 In practice, that means counterparty exposure is designed to stay small relative to the fund and to be wiped back toward zero regularly. That is a meaningful safeguard. It is not a guarantee. Resets happen on schedules and triggers, markets can move fast between them, and the protection ultimately rests on the quality and liquidity of the basket the fund owns.
The fund's cash balance of €143, as noted, measures almost nothing here. The schedule also showed about €137,500 of other net liabilities, the small settlement and accrual items that flow through any fund.3 The real liquidity question, then, is not how much cash sits in the account. It is whether the basket's securities can be sold quickly at fair prices when needed, and whether the swap settlements and the basket move in step. On the evidence of May 2026, the machine was tightly balanced: securities slightly above net assets, swaps slightly below, almost nothing idle. That is efficient. It also leaves little slack for error.
So the portfolio is the basket and the swap is the promise. The investor owns the first and relies on the second. And that reliance has a price, one that does not appear in the place most investors look for it.
IV. The Fee That Looks Higher Until You Follow the Return
Open the September 2026 factsheet and two numbers sit close together in the fees section, and they seem to tell a worrying story. The first is the ongoing charge: 0.19% a year.2 The second, a line below, is a swap fee: 0.33% a year.2 Add them up and the fund appears to cost more than half a percent annually, which in the world of European index funds, where the cheapest rivals charge a fraction of a tenth of a percent, would look close to absurd. Then turn to the performance table and the story flips. Over the ten years to the end of September 2026, the fund returned about 141.30% cumulatively. The index comparator printed beside it returned 139.28%.2 Over the most recent year, the fund returned 16.68% against the comparator's 16.56%.2 A fund that appears to charge more than half a percent a year somehow beat its own benchmark. How?
The answer lives in a single sentence of fine print. The swap fee, the factsheet explains, is included in the enhanced swap return and is not charged separately.2 In other words, the 0.33% is not a bill the fund pays out of its assets on top of the 0.19%. It is a cost the banks build into the return they deliver through the swap. What the fund receives from its counterparties is already net of that fee. To understand why that can still leave the investor ahead, it is necessary to look closely at what, exactly, the banks are promising to pay.
Start with the ongoing charge, because it is the simpler of the two. The 0.19% covers the fund's management, custody and administration, the ordinary costs of running a regulated investment vehicle, and it is deducted from the fund's assets over the year.2 It excludes portfolio transaction costs.10 It is the number most investors compare when they shop for an ETF, and on that comparison alone this fund looks expensive next to its cheapest rival, as the competition makes clear.
The swap fee is subtler, and it sits inside a distinction that most investors never think about: the difference between a gross and a net index. Every total-return index assumes that dividends are reinvested. The question is how much of each dividend an investor actually gets to keep. When a German company pays a dividend to a foreign investor, Germany withholds tax at source. Some of that tax can be reclaimed under treaties; some of it cannot. A gross total-return index assumes the investor keeps every euro of every dividend, as if no withholding tax existed. A net total-return index assumes the investor suffers withholding tax at a standard rate, the kind of rate a typical international investor cannot avoid. The difference between the two is the tax drag on European dividends, and for a dividend-rich market like Europe's it is not trivial.
Here is the crucial detail. The fund's stated objective is to track the net total-return version of the STOXX Europe 600, less fees.5 But its swap arrangements are referenced to the gross total-return version of the index.5 The banks, in effect, promise to pay the fund something close to the return an investor would earn if no dividend tax were withheld, minus their swap fee. Because a bank's trading desk can often hold shares and manage dividend taxes more efficiently than a fund could, using its tax position and hedging activity, it can afford to make that promise and still earn a margin. The fund then measures itself against the net index, which assumes the higher tax drag. If the gap between gross and net exceeds the swap fee plus the ongoing charge, the fund comes out ahead of its stated comparator. That is how a fund can appear to charge more than half a percent and still beat its benchmark.
It is worth pausing on what that means, because it is easy to misread. The outperformance is not a gift. It is the visible residue of a tax and financing arrangement inside the swap. Part of what the investor gains is withholding tax that the banks, rather than the fund, deal with. Part of what the investor gives up is the swap fee the banks keep for doing so. The net result, over the ten years to September 2026, was a cumulative return about two percentage points above the comparator.2 Spread across a decade of compounding, that is roughly nine hundredths of a percentage point a year: the fund compounded at a little over 9.2% annually against a little over 9.1% for the comparator. Not a fortune. Not nothing, either. On €10,000 invested at the start of the decade, the gap amounted to about €200 by the end.
There are three reasons to hold that number lightly. The first is that it is a cumulative observation over one particular decade, not a promise. Nothing in the fund's documents guarantees that the gross-to-net advantage will continue, that the banks will keep pricing the swap fee at the same level, or that tax treaties and dividend practices will stay the same. The swap fee itself can change. Tax rules can change. A decade in which European dividends were generous and swap pricing was favourable may not repeat.
The second reason is benchmark choice. The fund compares itself with the net index, and against that comparator it looks good. Against the gross index, which is closer to what the banks actually promise to pay before their fee, the picture would almost certainly look less flattering, because the gross index includes the very dividend tax advantage that drives the outperformance. A fair test of implementation quality would examine both. A fund that beats the net index by nine basis points a year but trails the gross index by a wider margin is telling an investor two things at once: that the investor is better off than with a fund that suffers full withholding tax, and that the banks are keeping a meaningful slice of the tax benefit for themselves.
The third reason is that factsheet performance is calculated on net asset value. An investor buying and selling SC0C on Xetra does not transact at net asset value. They pay the bid-offer spread on the exchange, and they may pay brokerage commissions on top. For a small fund, spreads can matter, and the published ongoing charge excludes them entirely. Nor does the ongoing charge capture the transaction costs the fund incurs inside its portfolio.10 The investor's true all-in cost is the difference between what the index returned and what actually landed in their account, after every layer: the ongoing charge, the swap economics, the trading costs inside the fund, and the spread paid to get in and out.
So the right question about cost is not whether 0.19% is higher than a competitor's headline charge. It is whether this fund's realised tracking difference, measured on a consistent basis against both the net and gross index, over a long enough period, and adjusted for what it costs to trade, is better or worse than the alternatives. The ten-year record suggests the synthetic structure has delivered a small, real edge against the net comparator. It does not, on its own, establish that the edge is durable, nor that it is large enough to offset what an investor gives up in scale and simplicity by choosing this fund over its larger rivals.
A careful comparison would line up this fund and its peers on the same index version, the same date range, the same currency and the same net asset value basis, and then compare the annualised gaps. The headline fee comparison, which most investors use, gets the answer close to backwards. The tracking comparison gets it right, but it requires patience and data. And it leaves open a question the performance table cannot answer on its own: if the fund has beaten its benchmark, are investors actually rewarding it with their money?
V. Assets Rose While the Unit Count Fell
Imagine a restaurant whose takings rise year after year, and whose owner proudly tells everyone business is booming. Then someone counts the diners. There are fewer of them each year. The takings are up only because the menu prices have gone up. That restaurant is not attracting new customers. It is charging its remaining ones more.
The fund's recent history has a similar shape, and it is easy to miss. At 30 November 2023 the fund held about €382 million in net assets. A year later it held about €463 million. A year after that, at 30 November 2025, it held about €465 million.4 By the end of May 2026 total net assets had climbed to about €558 million, before settling back to about €506 million at the end of September 2026.32 Read as a series of totals, that looks like a fund on a gentle upward path, a small product steadily gathering assets.
Now count the diners. Over the same period, the net asset value of each share rose from about €109 at the end of November 2023 to about €124 a year later and about €144 at the end of November 2025.4 That is the menu price: the value of one unit, driven by how European stocks performed. Meanwhile the number of units outstanding moved in a different direction. It rose from about 3.49 million to about 3.72 million in the year to November 2024, then fell to about 3.22 million in the year to November 2025.4 By the end of September 2026 it had slipped to about 3.11 million.2
Put those two series side by side and the story becomes clear. In the year to November 2024, both the price per unit and the number of units rose. Investors were adding money and the market was rising, so total assets grew from both directions. In the year to November 2025, the picture split. Each unit was worth about 16% more by the end of the year, but there were about 13% fewer units. Total assets barely moved, because a strong market was almost exactly offset by investors leaving.
A rough reckoning shows how large that exit was. If no investor had bought or sold units during the year to November 2025, the fund's €463 million would have grown with the market to something in the region of €537 million. Instead, it ended the year at about €465 million. The difference, on the order of €70 million, approximates the net money that left. That estimate is crude, because flows happen throughout the year at different prices, but it is enough to establish the direction. In that year, this fund lost investors, and only the strength of European equities disguised it.
The pattern continued into 2026. From the end of November 2025 to the end of September 2026, total assets rose by about 9%, from roughly €465 million to roughly €506 million, while units fell by about 3.5%.42 Dividing assets by units, each share was worth roughly €163 by September 2026, up about 13% from its November 2025 level. Again, market gains did the heavy lifting; investor flows subtracted, though less sharply than the year before. The spike to about €558 million at the end of May 2026 and the retreat to about €506 million four months later show how quickly the total can move, but without a unit count at May, it is impossible to say from the published figures how much of that swing was market movement and how much was money coming and going.3
What should an investor make of this? The first lesson is that total net assets is a poor measure of a fund's success with investors. It mixes two very different forces: the return on the assets already in the fund, which reflects the market, and the net creations and redemptions, which reflect whether investors are choosing the product. A fund manager can point to rising assets as evidence of a winning strategy, but unless those assets are rising faster than the market, the manager has won nothing. In this case, the evidence over the most recent two reporting years points the other way. Market performance, not net creations, drove the fund's asset growth. The fund does not publish a dated series of net flows that would let an investor split the total precisely, and anyone claiming that the fund's distribution is succeeding would need exactly that series to prove it.
The second lesson is about what the outflows might mean, and here humility is warranted. Outflows from a single ETF share class can have many causes. A large institutional holder may have rebalanced. A platform may have switched its default European fund to a cheaper rival. A wealth manager may have moved clients from synthetic to physical funds on policy grounds. The fund does not disclose who its unit-holders are, so there is no way to know whether the decline came from many small investors or a handful of large ones.4 What can be said is that during a period when European equities performed well and the fund tracked its benchmark closely, investors on balance withdrew more than they added. That is not the behaviour of a market that has decided this product is the best way to own European stocks.
The third lesson is more practical. Size matters for ETFs in ways that go beyond prestige. A fund with more assets can spread its fixed costs more thinly, can attract more market makers to quote tight spreads, and can negotiate more effectively with its counterparties. A fund that is shrinking in units faces the opposite pressure. At around half a billion euros, this share class is not in any danger of closure, but it is not gathering the momentum that would make it cheaper to run or easier to trade.
For an investor following this fund, three indicators carry most of the signal, and it helps to name them now. The first is assets and net flows, read together: the unit count is the cleaner measure of investor demand, and its latest reading, about 3.11 million units in September 2026, continued a decline from about 3.72 million two years earlier.24 The second is tracking difference, the gap between the fund's return and the index's, which over the decade to September 2026 ran slightly in the fund's favour against the net comparator.2 The third is counterparty exposure after collateral, which stood as a small net amount owed to the banks at the end of May 2026.3 Those three numbers, more than the fee table or the total asset figure, will reveal whether the fund's implementation is winning or losing.
And the second of them, tracking difference, invites the obvious comparison. If this fund's edge comes from how it implements the index, how does that implementation stack up against the rivals offering the very same benchmark?
VI. Same Index, Different Price and Plumbing
Picture the European market for STOXX Europe 600 exposure as a high street in October 2026, with four shops selling exactly the same product. At one end stands a superstore: the Amundi Core STOXX Europe 600 fund, with roughly €22.7 billion in assets.11 Next to it is an iShares fund with about €9.9 billion and an Xtrackers fund with about €4.4 billion.11 And at the far end, a smaller shopfront with about half a billion euros of assets: the Invesco fund.112 All four offer exposure to the same six hundred companies, defined by the same index provider, under the same set of rules. The only differences are how they deliver it, what they charge and how easily a customer can walk in and out.
The price tags tell their own story. Invesco's ongoing charge is 0.19%.2 Amundi's is 0.07%.12 Xtrackers' 1C share class charges about 0.20%, and the iShares fund in the comparison also sits around 0.20%.1311 On the headline price alone, Invesco is roughly in line with two of its large rivals and about 2.7 times as expensive as the market leader. For an investor shopping by sticker, Amundi is the obvious choice, and the asset totals suggest many investors have shopped exactly that way.
Invesco's synthetic structure has delivered a small cumulative advantage against the net comparator over a decade. A physical fund cannot replicate that advantage directly, because it holds the shares itself and suffers whatever withholding tax applies to its domicile and tax position. Physical funds have their own offsets, chiefly securities lending, in which a fund lends its shares to borrowers for a fee, and the scale that lets them trade the index cheaply. So the real competition is not between fee tables. It is between realised tracking records, after everything.
Like-for-like comparison requires care, because the four shops are not quite as identical as they look. Some share classes accumulate dividends, others distribute them. Domicile varies between Ireland, Luxembourg and Germany, which affects withholding tax on dividends inside the fund and the investor's own tax treatment. Listings differ, as do trading currencies and the depth of market-maker support on each exchange. Replication differs: iShares' Germany-domiciled STOXX Europe 600 fund holds the index's shares physically, while Invesco relies on swaps.11 An investor comparing these funds properly needs to line up the same share-class type, the same currency and the same benchmark version, and then measure what each actually delivered.
Doing that comparison rigorously is beyond what any single factsheet allows, but the shape of the contest is clear enough to war-game. Suppose an investor is choosing between Invesco at 0.19% and Amundi at 0.07%. The fee gap is twelve hundredths of a percentage point a year. For Invesco to win, its implementation advantage, the net effect of its swap arrangements, must exceed that gap after spreads and trading costs. Its ten-year record shows it beating the net comparator by roughly nine hundredths of a point a year. If Amundi tracks its own benchmark closely, with its lower fee partly offset by securities lending or helped by efficient dividend handling, then Invesco's synthetic edge may be fully consumed by the fee difference. If Amundi's tracking has lagged by more than its fee, the contest tilts the other way. The answer lies in the tracking data, not the brochure. What can be said with confidence is that Amundi's lower charge sets a high bar, and that Invesco has to keep proving it can clear it.
Against the rivals priced around 0.20%, the arithmetic shifts. With a broadly similar headline cost, Invesco's synthetic advantage, if it persists, would give it a modest edge in delivered return over a physical fund that suffers more withholding tax. That is a real argument for the product. It is also a narrow one, resting on swap pricing and tax treatment that can change, and offset by the fact that the larger funds may offer tighter trading spreads and deeper liquidity.
It is worth thinking through the competitive forces on this high street, because they explain why the business of selling index exposure has become so brutal. Buyers hold most of the power. An investor can switch from one STOXX 600 fund to another with a single sell order and a single buy order, at the cost of a spread and perhaps a tax event. There are no contracts, no lock-ins, no loyalty schemes. That is why fees across the industry have been driven relentlessly downward, and why a 0.07% competitor can attract tens of billions of euros.
Suppliers matter too, and here this fund has a distinctive exposure. The index provider, STOXX, licenses the benchmark to every competitor, so no fund owns the index; it is rented, on terms the fund does not control.9 For a synthetic fund, the swap counterparties are equally important suppliers. They set the swap fee, they decide how much of the gross-to-net advantage to share, and they must remain willing to deal. If the banks' appetite for this kind of business cooled, or if they repriced the swap fee upwards, the fund's main competitive argument would weaken overnight. The threat of substitutes is everywhere: other STOXX 600 funds, funds tracking other broad European indices, futures, and direct share ownership for larger investors. The threat of new entrants is real but muted by scale economics, since a newcomer needs billions to compete on cost.
Scale is the force that most clearly favours the rivals. A fund with €22.7 billion can spread its fixed costs across more than forty times the assets of a fund with half a billion. It can attract more market makers, quote tighter spreads and negotiate more favourable terms with its service providers. Whether that scale advantage actually reaches investors, rather than being kept by the provider, is a question each fund's tracking record must answer. The decade of slight outperformance against its net comparator shows that a smaller fund can compete on delivered return. It does not show that the fund's scale disadvantage is irrelevant to trading costs or future pricing.
So what is the moat? The honest answer is that broad index exposure is a commodity. The STOXX Europe 600 is available from several providers, and there is nothing proprietary about owning it. Invesco's fund has no exclusive access to the index, no switching costs to hold investors in place, no network effects, no brand that would make an investor pay more for the same exposure. Its only claim to an edge is execution: the synthetic structure, the swap terms, the resulting tracking. That is an edge that has to be measured continuously, not presumed. The ten-year record says it has existed. The unit-count decline says investors have not been rewarding it with net new money. And the gap between Invesco's charge and Amundi's says that any edge has a competitor actively trying to erase it.
Execution, though, is not the work of a single company. It is the work of a chain of institutions, each responsible for a different link. When that chain works, the investor gets the index. When it breaks, the question of who answers for it becomes urgent.
VII. Who Is Accountable When the Tracking Works—or Breaks?
Read two of the fund's own documents side by side and a small puzzle appears. The September 2026 factsheet names Assenagon Asset Management S.A., a Luxembourg firm, as the fund's investment manager.2 The umbrella company's annual report names Invesco Investment Management Limited, part of the Invesco group, as manager.4 Neither document is wrong. They are describing different links in the same chain. And that chain, rather than any single executive, is what an investor in this fund is really trusting.
It helps to lay the chain out in order, from the legal shell to the banks. At the top sits Invesco Markets plc, the Irish umbrella company, with its own board of directors. The annual report for the year to November 2025 names Lisa Martensson and Deirdre Gormley among its directors, and records the board's assessment that the company remained a going concern.4 The board does not pick stocks or negotiate swaps. Its job is oversight: making sure the fund is run according to its prospectus and the rules of the Central Bank of Ireland, which authorises and supervises it.6
Below the board sits the manager, Invesco Investment Management Limited, the entity legally responsible for managing the umbrella's funds.4 The manager can delegate investment management, and for this fund that day-to-day work, including the management of the basket and the swaps, is carried out by Assenagon as delegated investment manager.2 Then comes the depositary, Northern Trust, which holds the fund's assets in safekeeping and oversees certain of its operations; the fund's cash is held with The Northern Trust Company.36 And finally there are the swap counterparties, the four banks that at the end of May 2026 had contracted to deliver the index return.3
This is the right map for thinking about accountability. If the fund's basket were mispriced, the question would run to the valuation process, the investment manager and the depositary. If a bank failed to pay what it owed under a swap, the question would run to the counterparty-selection and collateral controls overseen by the manager and the board. If the fund drifted away from its benchmark, the question would run to the investment manager and the swap terms. No single person carries the whole of it. That diffusion is not a scandal; it is how regulated funds are built. But it means an investor's due diligence looks very different from the due diligence on a company. There is no chief executive whose track record can be studied, no pay packet to compare with performance, no insider shareholding to signal alignment. Those measures simply do not apply. The relevant evidence is the published fee terms, the counterparty schedule and the controls that sit around them.
The money flowing to the group-affiliated manager is the first place to look, because it is the main related-party relationship in the fund. At 30 November 2025, management fees payable by this fund stood at about €14,748.4 That is a balance owed at a moment in time, accumulated over a short period, not the year's total fees. It would be a mistake to multiply it into an annual figure, and equally a mistake to pin the umbrella company's much larger aggregate management fees on this one sub-fund, because those aggregates cover many funds.4 What the investor can rely on is the published rate: 0.19% a year of net assets.2 On roughly half a billion euros of assets, that ongoing charge implies something in the region of a million euros a year flowing out of the fund to cover management, custody and administration. That is the scale of the commercial relationship between investors and the Invesco group in this product. The 2025 annual report disclosed no separate royalty, brand fee, intercompany loan or guarantee involving this fund.4
The auditor's view is the second piece of evidence. KPMG issued an unmodified opinion on the umbrella's financial statements for the year to November 2025, and it identified two key audit matters: the valuation of financial assets and their existence and ownership.4 Those are exactly the right things for an auditor to worry about in a fund like this. Valuation matters because the basket and the swaps must be priced correctly every day for the net asset value to be accurate. Existence and ownership matter because the whole protective logic of an unfunded swap structure depends on the fund actually owning the basket it claims to own. A clean opinion on both is meaningful. It is not a guarantee against future operational or counterparty losses, because an audit tests the books at a point in time, not the resilience of a contract under stress. The directors also stated that the umbrella company had no material borrowings and that its investments were materially liquid.4
The counterparty schedule is the third piece of evidence, and the most specific to this fund.3 The May snapshot is a point-in-time measure, not a stress test. A skeptical investor would want to know how often the swaps are reset, what collateral the counterparties post when the fund is in the money, how quickly a failed counterparty could be replaced and at what cost, and how concentrated the exposure could become if one bank took a larger share of the swap book. The fund's periodic reports give snapshots; they do not provide a stress scenario.
A fourth question sits slightly apart from the others, and it is the one most investors get wrong. Because the share class is denominated in euros and its swaps settle in euros, many assume it carries no currency risk. It does. The share class is not currency hedged.2 The STOXX Europe 600 includes companies listed in Switzerland, the United Kingdom, Sweden, Denmark, Norway and other countries whose currencies are not the euro, and the index return in euros includes the movement of those currencies against the euro.2 When the Swiss franc strengthens, a euro investor in this fund gains, and when sterling weakens, the investor loses. The annual report notes that monetary currency risk at the fund level is limited and that swaps settle in the base currency.4 That reduces settlement mismatch. It does not remove the foreign-currency effect embedded in the index itself. And the collateral basket's country mix, with its heavy Swiss and American weights, is a separate matter again: as long as the swaps perform, that basket's currency exposure is swapped away, leaving the investor with the index's currency mix, not the basket's.
What about the governance record beyond the audit? The fund publishes its annual general meeting materials on its product page, alongside its reports and notices.14 The fund does not disclose who its unit-holders are or how concentrated they are, so there is no way to assess whether a handful of large investors could move the fund's assets dramatically by leaving. There is also no earnings call to parse, no management commentary to test against past promises, because funds of this kind do not hold them. The governance story here is institutional and contractual. It turns on whether the manager, the delegated investment manager, the depositary and the board keep doing the unglamorous work of pricing, collateral management and counterparty oversight, and on whether the investor can see enough to judge that they are.
Which leaves the question every investor must ultimately answer for themselves. Given everything this machine does and every risk it carries, is there a convincing case for choosing it?
VIII. Analysis & Bear vs. Bull Case
Lay two images side by side. The first is the ten-year performance chart from the factsheet, two lines rising almost on top of each other across a decade of European markets, the fund's line finishing a hair above the index's: about 141.30% cumulative against 139.28%.2 The second is the high street from October 2026, with Amundi's superstore holding roughly forty-five times the assets of Invesco's shopfront and charging little more than a third of its fee.1112 The bull case lives in the first image. The bear case lives in the second. The question is which one tells an investor more about the future.
The bull case begins with the record. Over ten years, and again over the most recent year, the fund's net asset value return slightly exceeded the index comparator printed on its factsheet, after its ongoing charge and after its portfolio transaction costs.2 That is not a trivial achievement for an index fund. Most physical index funds trail their benchmarks by something close to their fees, because fees, trading costs and taxes all subtract. A fund that ends a decade ahead of its stated benchmark is doing something right, and the something is visible in its structure: a swap referenced to the gross index, a swap fee embedded in the enhanced return, and banks able to handle dividend taxes more efficiently than a fund could on its own.5 On this reading, the synthetic structure is not a quaint relic of 2009 but a working machine for harvesting a tax and financing advantage that physical funds cannot easily match.
The bear case begins with the competition. A fee gap of twelve hundredths of a percentage point against the cheapest rival is larger than the fund's annualised outperformance against its comparator of roughly nine hundredths. If the Amundi fund tracks its own benchmark tightly, an investor choosing Invesco may be paying more for a result that is, at best, about the same. The rivals are also vastly larger, which tends to mean deeper liquidity and tighter trading spreads, so the investor's cost of getting in and out may be lower elsewhere. And the unit count tells its own story. During a strong period for European equities, investors on balance left this fund. Whatever its tracking record, the market has not been voting for it with fresh money.
Then there is the structure itself. The bull reads synthetic replication as a source of edge. The bear reads it as a source of risk. Four counterparties and the need to replace any one of them on short notice create a failure mode that a physically replicated rival does not share in the same form. The protective logic is sound: the fund owns its basket, so a counterparty failure would not leave it with nothing. But the investor would then own a basket of collateral, heavy in Swiss, Swedish and American shares, rather than the index, until new swaps could be put in place. In a crisis, that replacement could be slow or expensive, and the gap between basket and index could be uncomfortable. A swap mark of minus 0.83% at the end of May 2026 is reassuring about that particular day.3 It is not a stress test.
Currency adds a quieter test. A euro-denominated share class does not mean a euro-hedged portfolio. Anyone buying this fund to avoid currency risk has misunderstood what they own, because the index's non-euro companies carry their currencies with them.2 That is true of every unhedged STOXX 600 fund, so it is not a competitive disadvantage. But it matters for an investor who holds the fund as a euro-only allocation.
Now step back and run the classic frameworks, because they sharpen the picture. Porter's five forces describe an industry where almost every force favours the customer. Buyer power is overwhelming, because switching between STOXX 600 funds costs little more than a pair of trades. The threat of substitutes is high, with several identical funds and countless near-substitutes. Supplier power is real and specific: STOXX licenses the index to everyone, and the swap counterparties set the terms of the very advantage this fund relies on. Rivalry is intense and conducted largely on price. Only the threat of new entrants is restrained, because a newcomer would need billions in assets to compete on cost. This is an industry in which profits flow to scale, and in which a small fund must justify itself on something other than cost.
Hamilton Helmer's seven powers are even more revealing, because almost all of them are missing. There is no network effect: one investor's ownership does not make the fund more valuable to another. There are no meaningful switching costs. There is no counter-positioning, because the incumbents can, and do, offer synthetic and physical products alike. There is no cornered resource: the index is licensed to all, and swap counterparties deal with many providers. Brand power is weak in a product where the label is barely noticed. Process power is the only candidate. If Invesco and its delegated investment manager have built a superior process for negotiating swaps, managing collateral and capturing the gross-to-net advantage, that process could produce a persistent edge. The ten-year record is consistent with that claim. But process power is the hardest of the seven to verify from outside, and it erodes the moment counterparties reprice or rivals catch up. Scale economies, meanwhile, belong to the competitors, not to this fund.
Weighing that evidence leads to a narrow conclusion. History does not reject the claim that this fund's synthetic implementation delivers a tracking advantage; it narrows it. The advantage is real against the net comparator, small in annual terms, dependent on swap pricing and tax treatment that the fund does not control, and not obviously large enough to beat a rival charging about a third of the fee. The claim survives as a smaller version of itself: a modest, measurable execution edge, not a moat.
A skeptical investor, the kind who reads every footnote before committing money, would push further. Why pay the same as, or more than, physical peers for this particular product? What does the fund earn for the banks, and how much of the gross-to-net advantage do they keep? How quickly could a failed counterparty be replaced, and at what cost? Is the trading spread on Xetra competitive with the larger funds? Without satisfying answers to those questions, a fund cannot simply point to a ten-year chart and claim victory. And an investor convinced by the chart should note that it measures the past, under one set of swap terms and one set of tax arrangements.
So the investment case depends on what happens next, not on what happened before. Continued tracking against both net and gross benchmarks, a reversal in the decline of units outstanding, competitive spreads, and stable, well-collateralised counterparty exposure would strengthen it. Repriced swaps, a widening gap with the cheapest rival, continuing outflows or a counterparty scare would weaken it. Nothing in the record yet shows the fund has a durable winning position. What it shows is a well-functioning machine competing in a market that is very hard on small machines. And that tension between a mechanical promise and a contested implementation is the lesson this fund teaches best.
IX. Business & Investing Lessons
Go back to the factsheet one last time and look at its two tables together. On one side, a layered set of costs: an ongoing charge of 0.19%, a swap fee of 0.33% folded into the return, and transaction costs left out entirely.2 On the other, a decade in which the fund nonetheless finished about two percentage points ahead of its index comparator.2 A reader who looked at only the first table would have concluded the fund was expensive. A reader who looked at only the second would have concluded it was brilliant. Both would have been wrong in the same way: by trusting one number to tell a story that needs several.
The first lesson is the simplest and the most often ignored. A benchmark is a promise; the tracking record is the evidence. Every index fund in Europe promises to deliver its benchmark. This one has a decade of results showing how closely it kept that promise, and the answer, slightly better than its stated comparator, is more informative than any marketing line. For investors, the lesson reaches well beyond this fund. Judge an index product the way a lender judges a borrower: by what it has actually repaid, over years, rather than by what it says it will.
The second lesson is about the word cheap. Cheap is a total-return calculation, not a label. This fund's headline charge looks expensive next to the cheapest rival, and its swap fee, read in isolation, looks alarming. Yet the delivered return tells a different story, because the swap fee is embedded in a return referenced to a gross index. The true cost of owning an index is the gap between what the index earned and what reached the investor's account, after every layer: management charges, swap economics, transaction costs inside the fund and the spread paid on the exchange. Investors who compare only headline fees are using the wrong instrument to measure the right thing.
The third lesson concerns a mistake that costs real money. A euro quote does not hedge a European portfolio. The fund trades in euros, settles its swaps in euros, and reports its value in euros. And still, every move in the Swiss franc, the pound and the Nordic currencies flows straight into its return, because the index it delivers is full of companies whose shares are priced in those currencies. The lesson for any investor building a portfolio is to look through the currency of the wrapper to the currencies of the assets beneath it.
The fourth lesson is the one that should be printed on every synthetic ETF's factsheet. A small tracking gain does not erase a new failure mode. The fund's slight outperformance comes from an arrangement with four banks, and that arrangement introduces a risk a physical fund does not carry in the same form: the chance that a counterparty fails at the wrong moment and must be replaced in a hurry. The May 2026 snapshot showed the fund owing its banks a little money, a comfortable position on that day. The lesson is not to fear the structure but to price it honestly: any edge bought with a new risk must be weighed against that risk, not against nothing.
Put the four together and the larger point emerges. A mechanical promise, deliver this index, is only as good as the implementation behind it. And implementation is never mechanical. It is contracts, counterparties, tax treaties, collateral rules and trading spreads, each of which can change. The investor's job is to judge the delivered outcome and the risks required to produce it, not a single headline fee or a single line on a chart.
X. Epilogue
Tonight the fund stands where it has stood for most of its recent history: tracking its index closely, holding about half a billion euros of investors' money, and slowly losing units even as each unit grows more valuable. Its most recent audited year ended with fewer units than the year before, and its September 2026 factsheet showed the decline continuing.42 Its swaps, at the last published snapshot, were marked slightly in the banks' favour. Its headline charge remains well above that of the market's cheapest STOXX 600 fund. None of that is a crisis. All of it is a question.
The answers will arrive on a predictable calendar. The fund's financial year ends on 30 November, which means the umbrella's next annual report will refresh the units outstanding, net asset value per share and audited holdings as of the end of this month.4 Its next interim report will do the same at the end of May 2027. Monthly factsheets will update performance, fees and assets in between. Each of those documents will add a data point to three running tests, and how those tests resolve will decide whether this implementation earns its place.
The first test is investor demand. If units outstanding turn upward, it would be the first clear sign since 2024 that investors are choosing the fund rather than merely holding it while markets rise. If units keep falling, the gap between rising asset totals and shrinking investor interest will keep widening, and the fund's small scale relative to its rivals will become harder to dismiss.
The second test is tracking. The decade to September 2026 showed a small cumulative edge against the net comparator. The real question is whether that edge persists, and how it looks against the gross index and against the realised records of Amundi, iShares and Xtrackers on a consistent basis, after the spreads investors actually pay to trade. If the edge narrows while the cheapest rival keeps its fee low, the fund's central argument fades. If it holds or widens, the synthetic structure continues to justify itself.
The third test is the plumbing. The next reports will show which banks stand behind the swaps, how much each owes or is owed, and whether the number or mix of counterparties has changed. Any change to the replication method, the swap fee or the fee structure would deserve close attention, because those are the levers that drive the fund's results. A counterparty event, however unlikely, would be the moment the fund's protective design faced its first real test.
A few strong return periods cannot establish a durable advantage, and a small current swap mark cannot settle the question of risk under stress. The fund's case will be won or lost slowly, report by report, as each new set of numbers either confirms that the machine works better than its rivals or shows that it is simply working.
XI. Outro
On the last day of May 2026, the fund’s portfolio and swaps together delivered the return of six hundred European companies, with four banks standing in the gap and €143 in the till.3 It is a strange and elegant arrangement, and most of the people who own it have never looked inside.
That is what makes this fund worth knowing. It is a reminder that owning an index’s return and owning its securities are not always the same thing. Every investor in it is trusting the implementation. The question worth asking, every reporting period, is the one the fund cannot answer for them: what did it cost, and what risk came with the return?
References
-
Invesco STOXX Europe 600 UCITS ETF Acc — Deutsche Börse Xetra ↩↩
-
Invesco STOXX Europe 600 UCITS ETF Acc factsheet — Invesco, 2026-09-30 ↩↩↩↩↩↩↩↩↩↩↩↩↩↩↩↩↩↩↩↩↩↩↩↩↩↩↩↩↩↩↩
-
Interim Report and Unaudited Financial Statements — Invesco Markets plc, 2026-05-31 ↩↩↩↩↩↩↩↩↩↩↩↩↩↩↩↩↩
-
Annual Report and Audited Financial Statements, year ended 30 November 2025 — Invesco Markets plc, 2026-03-30 ↩↩↩↩↩↩↩↩↩↩↩↩↩↩↩↩↩↩↩
-
Product Supplement — Invesco STOXX Europe 600 UCITS ETF — Invesco ↩↩↩↩↩
-
Invesco completes acquisition of Source, Exhibit 99.1 to Form 8-K — Invesco Ltd., 2017-08-18 ↩
-
Key Information Document, Invesco STOXX Europe 600 UCITS ETF Acc — Invesco, 2026-08-21 ↩↩↩
-
Amundi Core STOXX Europe 600 UCITS ETF Acc Key Investor Information — Amundi, 2025-09-11 ↩↩
-
Invesco STOXX Europe 600 UCITS ETF Acc product page — Invesco ↩
 LinkedIn
 WhatsApp
 Reddit
 Hacker News
 Email
 Kindle
 RSS Feed
 Spotify
 Apple Podcasts
 Amazon Music
 Audible
 YouTube