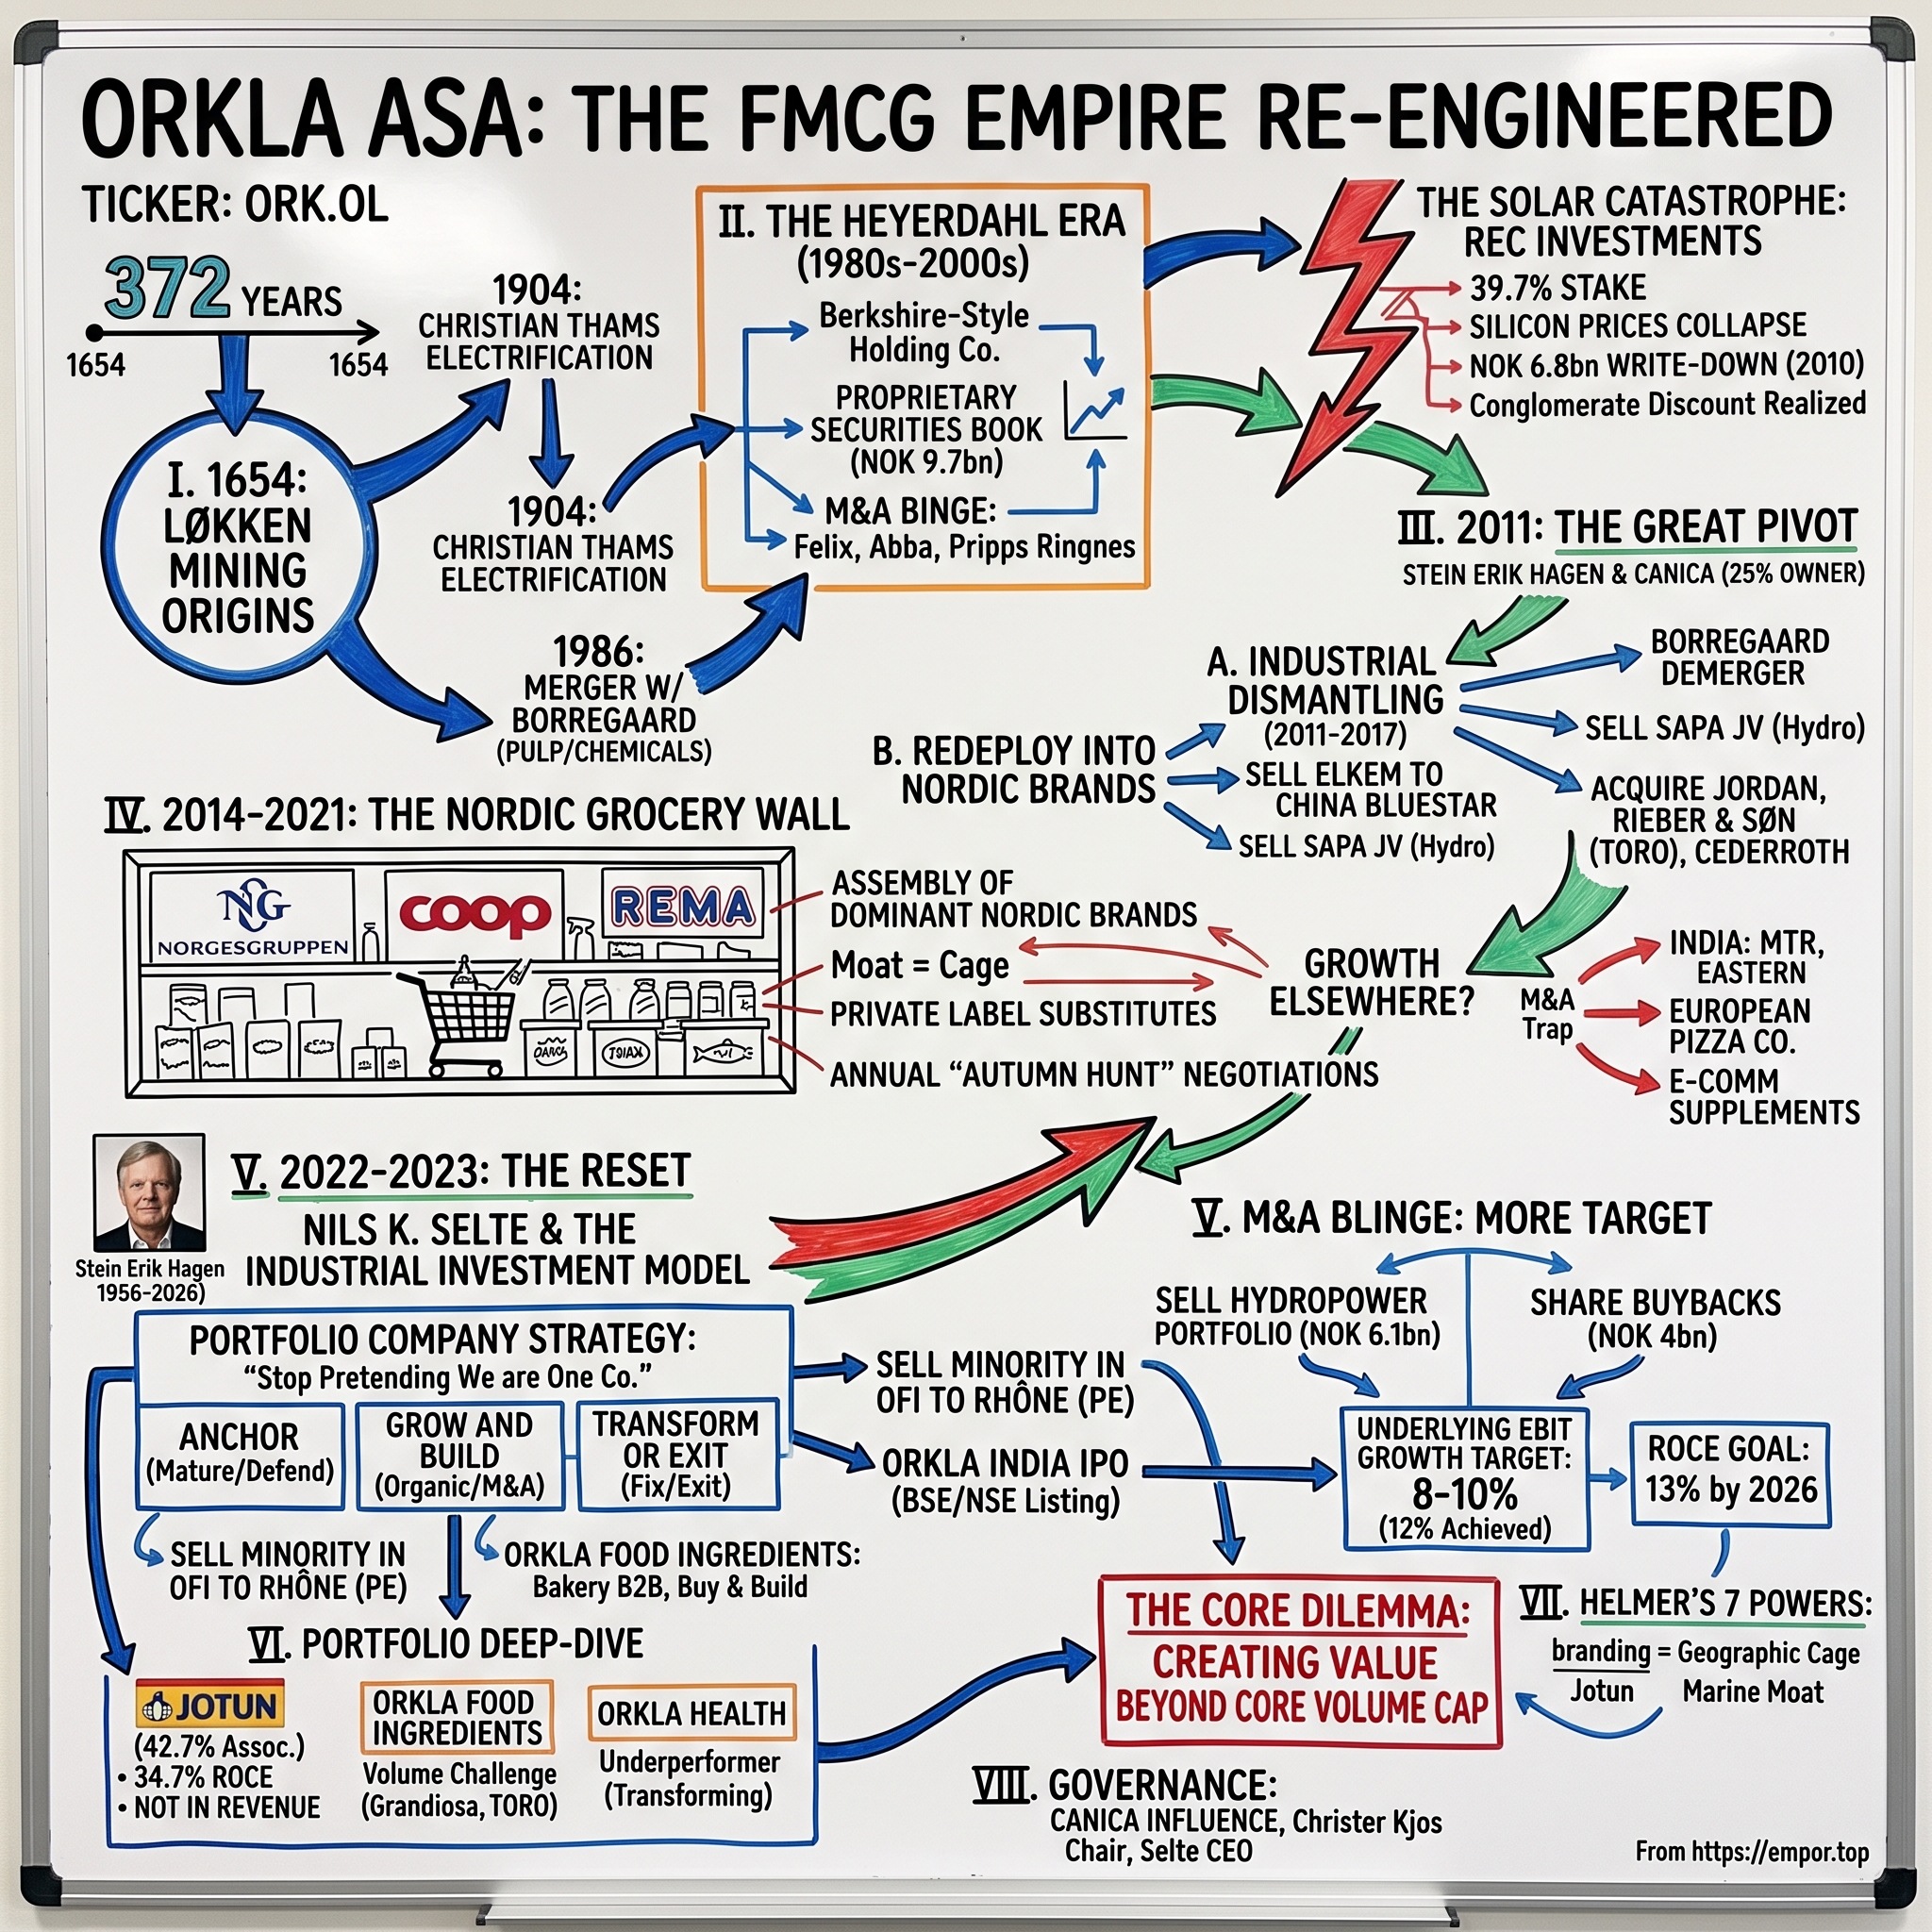
Orkla ASA: The FMCG Empire Re-Engineered
I. Introduction & Episode Roadmap
On the morning of 20 May 2026, Orkla's quarterly results presentation opened not with a revenue slide but with a photograph. A man in a dark suit, half-smiling, and beneath it two dates: 1956 – 2026. Stein Erik Hagen, the retail billionaire who had controlled Orkla's destiny for two decades, had died of a heart attack at his Oslo home sixteen days earlier, aged 69.1 The company he had spent twenty years bending to his will then did what he had trained it to do: it moved on to the numbers. Organic growth of 4.9%. Adjusted earnings per share of NOK 1.75. Volume and mix contributing 3.2 percentage points of the growth — the metric management had spent three years insisting was the only kind of growth that counts.2
That juxtaposition — a founder-figure's death and an unbroken operating cadence — is the essence of the Orkla story in 2026. This is a company that turns 372 years old this year, and it has spent most of the last fifteen deliberately dismantling the thing it used to be.
Orkla ASA trades on the Oslo Børs under the ticker ORK.OL, with a market capitalisation in the region of NOK 105 billion.3 In 2025 it booked operating revenues of NOK 71.5 billion — up 3.3% — and adjusted EBIT of NOK 7.6 billion.4 Those are the numbers of a mid-sized European consumer goods group. What they conceal is stranger and more interesting: Orkla is no longer really an operating company at all. It calls itself an industrial investment company, and it runs ten portfolio companies, each with its own board, its own targets, its own balance sheet discipline, and — in three cases — its own outside shareholders.5
The core strategic dilemma. Orkla owns brands that are close to civic institutions in their home markets. Grandiosa frozen pizza in Norway. TORO soups. Möller's cod liver oil. Nidar and OLW and KiMs in the snack aisle. Jordan toothbrushes in the bathroom cabinet. That density is a genuine asset. It is also a cage. The Nordic grocery market is one of the most concentrated in Europe — in Norway, three chains control roughly 95% of retail grocery sales.6 A supplier with dominant brands and three possible customers has a very specific problem: its moat protects it from competitors but not from its own distributors. Add slowing organic volume growth, a decade of scattershot international M&A, and the classic conglomerate discount, and you get the question that has animated Orkla's board since 2022: how does a company like this create value that the market will actually pay for?
The new playbook. The answer, engineered by CEO Nils K. Selte and backed by Hagen's family holding company Canica AS, has been to stop pretending Orkla is a single company. Since 2022, Orkla has been re-architected to behave like a listed private equity fund with permanent capital: portfolio companies are classified as Anchor, Grow and Build, or Transform or Exit; each carries public financial targets; and the centre's job is capital allocation, not category management. In the three years since, Orkla has sold its entire hydropower portfolio, sold a minority of its largest revenue-generating business to a New York private equity firm, listed its Indian subsidiary on the Bombay and National stock exchanges, exited textiles, and bought back NOK 4 billion of its own stock.
What this article covers. We start with 370 years of skin-shedding — mining, pulp, media, beverages, aluminium, and one catastrophic bet on solar silicon that cost shareholders billions and triggered a governance revolt. We then follow Hagen's 2011 pivot into pure-play consumer goods, the wall Orkla hit in Nordic grocery, the M&A binge that followed, and the 2022 reset. We dissect the portfolio piece by piece — including the 42.7% stake in the paint company Jotun that quietly generates a large share of Orkla's economic earnings without appearing in a single line of its revenue.4 We run the business through Hamilton Helmer's 7 Powers and Porter's Five Forces, stress-test management's record against what they actually promised, and lay out where the bull and bear cases genuinely diverge. Along the way we will try to keep one question in front of us at all times: which parts of this story are proven, and which parts are still management telling us what they intend to do?
Three myths worth dismantling up front. The first is that Orkla is a Norwegian food company. Its largest business by revenue sells bakery ingredients to industrial customers across Europe, and a substantial share of its economic earnings comes from ship paint. The second is that the conglomerate discount is irrational — that the market simply fails to see the parts. Some of the discount has always been a rational charge for real problems: businesses earning below the cost of capital, a corporate centre without an obvious function, and a controlling shareholder whose preferences minority investors could not override. The third is that the 2022 reorganisation was a strategic pivot. It was closer to an admission — that organic growth in the core was structurally capped, and that the only lever left with real torque was what the company chose to own.
The place to begin is a hole in the ground in central Norway.
 Subscribe on LinkedIn
II. The 370-Year Backstory: From Løkken Mining to Jens P.'s Empire (1654–2010)
The Løkken mine sits in the Orkla river valley in Trøndelag, about eighty kilometres southwest of Trondheim. Miners first pulled pyrite out of it in 1654 — sulphur ore, useful for gunpowder and later for sulphuric acid — and the operation limped through centuries of Danish-Norwegian industrial history before a Swiss-educated Norwegian entrepreneur named Christian Thams reorganised it in 1904 as Orkla Grube-Aktiebolag.7 Thams did something unusual for a mining promoter: he electrified. The Thamshavn railway he built to move ore to the fjord was the first electric railway in Norway. For a while, Orkla was among the largest pyrite producers on earth.
That is the origin myth, and it matters less for its detail than for the pattern it establishes. Orkla has never been defined by a product. It has been defined by a willingness to abandon products.
From ore to industry. The mines at Løkken finally closed in 1987. By then the company had already become something else. In 1986 Orkla merged with Borregaard, a chemicals and pulp business dating to 1918 that had itself pivoted from paper into fine chemicals — vanillin, ethanol, lignin derivatives.7 Five years later came the merger with Nora Industrier that produced the modern Orkla A/S, and with it a consumer goods business with real Norwegian brand equity.
The Heyerdahl era. The architect of what followed was Jens P. Heyerdahl d.y., who ran Orkla for over two decades and became, in the Norwegian business imagination, something between a national industrialist and a shadow finance minister. His strategy was Berkshire-adjacent in structure if not in philosophy: use the cash flows of dull, dominant businesses to buy more businesses, and run a proprietary securities book on the side.
The scale of that securities book is the detail most people forget. By August 1996, Orkla's financial investment portfolio was valued at around NOK 9.7 billion — roughly a quarter of the company's entire balance sheet.7 Orkla was, in effect, one of the largest active investors in Norwegian equities, operating out of the treasury department of a food company. Meanwhile Heyerdahl bought aggressively: Procordia Foods and Abba Seafood from Volvo in 1995 for roughly $578 million, bringing Felix and Abba into the group, and a beverage joint venture with Volvo that created Pripps Ringnes, the leading Nordic brewer.7 By 1996 more than half of revenues came from outside Norway.
What Heyerdahl built was genuinely valuable and genuinely incoherent. Orkla at its peak spanned newspapers, beer, chocolate, detergent, aluminium profiles, speciality chemicals, hydroelectric dams, and a hedge fund. The bull case was that the cash flows were uncorrelated and the management talent was fungible. The bear case — which turned out to be right — was that no board on earth can allocate capital competently across nine unrelated industries at once, and that a conglomerate this shape eventually mistakes optionality for strategy.
There is a second, subtler problem with the Heyerdahl model that is worth naming because it recurs throughout this story. When a company owns a large securities portfolio alongside its operating businesses, the reported group return on capital becomes almost impossible to interpret. Good years in the equity book can mask mediocre years in the factories, and vice versa. Investors lose the ability to answer the only question that matters — is the operating business actually earning its cost of capital? — and management loses the internal signal that would tell it to stop doing something. Orkla's current insistence on per-company return on capital employed targets is, read historically, a direct repudiation of that opacity.
By the turn of the millennium the Nordic industrial landscape had also changed underneath the model. Media consolidation went pan-European, beverages consolidated globally, and the scale required to compete in each of Orkla's verticals rose faster than Orkla's ability to fund all of them simultaneously. Orkla Media was eventually sold. The beverage interests were rationalised into the Carlsberg orbit. Each disposal was individually sensible. Collectively they left a company that still described itself as a diversified industrial group while steadily losing the diversification that had justified the description.
The solar catastrophe. The proof arrived in the form of Renewable Energy Corporation. In the mid-2000s, polysilicon was the hottest industrial commodity in Europe. Solar demand was compounding, silicon was scarce, and REC — a Norwegian company with wafer, cell and silicon operations — looked like a generational asset. Orkla built a position that reached 39.7% of REC, making it the dominant shareholder.8
Then the physics of commodity manufacturing asserted itself. Chinese producers, financed by provincial governments and indifferent to returns on capital, flooded the market after 2008. Polysilicon spot prices, which had spiked above $400 per kilogram at the mania's peak, collapsed toward the cost of production and then below it. Orkla wrote down its REC holding by NOK 6.8 billion during 2010 alone, on top of NOK 3.1 billion the year before.8 The stake was carried at market price precisely because the market price kept falling below anything Orkla's own models could justify.
Nearly NOK 10 billion of shareholder capital had been vapourised in a business Orkla had no operational competence in, no cost advantage in, and no ability to influence. It was not a food company's mistake. It was a conglomerate's mistake — the kind that only happens when a balance sheet is large enough to make a bad idea look survivable.
The Norwegian financial press was merciless, and inside the shareholder register, a former grocer had been quietly accumulating stock and waiting for exactly this moment.
III. The 2011 Great Pivot: Stein Erik Hagen & The FMCG Pure-Play Bet
Stein Erik Hagen understood retail from the wrong side of the counter. He started his first business in 1976, and with his father built RIMI into a Norwegian discount grocery chain, later selling out to Nordic and Dutch retail groups and converting the proceeds into Canica, a family investment office.1 He had spent his career squeezing suppliers. He knew exactly how much margin a strong brand could defend against a determined buyer — and exactly how little a weak one could.
Hagen joined Orkla's board in 2004 and became Chair in 2006.1 By the time the REC write-downs landed, Canica and related parties held roughly a quarter of the company's shares — a position that eventually settled at 250,387,581 shares, or 25.003% of Orkla.9 That is the number that explains everything about Orkla's governance for the next twenty years. Hagen was not an activist making noise from outside. He was, functionally, the owner.
His diagnosis was blunt: Orkla was an industrial museum attached to a very good consumer goods company, and the museum was destroying value.
The great industrial sell-off. What followed between 2011 and 2017 was one of the more disciplined dismantlings in European corporate history.
The first move was the biggest. In January 2011 Orkla agreed to sell Elkem — silicon metal, carbon, and the solar silicon operation — to 中国蓝星 China National Bluestar for approximately USD 2 billion before closing and capital structure adjustments, with the deal completing that April.10 Selling a Norwegian industrial crown jewel to a Chinese state-linked buyer was politically awkward. Financially it was the correct trade: Orkla was exiting a capital-intensive, cyclical, commodity business at a moment when the buyer's strategic logic was stronger than the seller's.
Borregaard was demerged and separately listed on the Oslo Børs in 2012 — a decision that turned out well for Borregaard's shareholders and, more importantly, removed a chemicals business from Orkla's capital allocation queue. The aluminium business went into a 50/50 joint venture with Norsk Hydro under the Sapa name, and in 2017 Orkla sold its half to Hydro at a total enterprise value of NOK 27 billion for the whole company.11 Orkla Media had already gone. So had the securities portfolio.
The Borregaard demerger deserves a moment of its own, because it demonstrates a technique Orkla has returned to repeatedly. Rather than auction a speciality chemicals business into a market that would have valued it as an industrial commodity, Orkla handed it directly to its own shareholders as a separately listed company and let the public market re-rate it on its own merits. Demergers do not raise cash, which is why boards that need money rarely choose them. What they do is remove an asset from the conglomerate discount and give it a management team whose incentives are tied to that asset alone. The Indian listing in 2025 is the same instinct expressed differently.
Across roughly six years, Orkla converted a sprawling industrial and financial conglomerate into cash. That is the part of the story management is entitled to be proud of, and it deserves a specific analytical point: the sell-off worked because Orkla sold assets other people wanted more than it did, at multiples set by strategic buyers rather than by public market sentiment. That is a repeatable skill, and it is the same skill the current management team claims to be exercising today.
Redeploying into Nordic brands. The proceeds went into buying kitchen cupboards and bathroom cabinets.
In June 2012 Orkla acquired Jordan — oral hygiene, cleaning and painting tools — for NOK 1,180 million on a cash and debt-free basis.12 Two months later it agreed to buy Rieber & Søn from the Rieber family in a transaction valuing the Bergen-based food group at NOK 6.1 billion, completing in April 2013.13 Rieber brought TORO, the soup and sauce brand that occupies roughly the position in Norwegian kitchens that Campbell's does in American ones, plus Vitana in the Czech Republic, K-Salat and Bähncke in Denmark, and Frödinge in Sweden. In January 2015 Orkla agreed to acquire Cederroth, the Swedish personal care and first aid group, at an enterprise value of SEK 2,015 million.14 Baltic confectionery came in through NP Foods, adding Laima to the portfolio.
The strategic rationale — and its hidden flaw. The thesis was a brand shield: assemble such density of trusted local brands across Nordic food, snacks, health and hygiene that Nestlé, Unilever and Procter & Gamble would find the region structurally unattractive to attack. Local taste preferences, local language, local heritage, and a shelf already full.
The thesis was largely correct about the global giants. Orkla's Nordic positions have not been meaningfully eroded by multinational competition. What the thesis did not account for was that the most dangerous competitor was not going to be another brand owner. It was going to be the customer.
IV. The Nordic Grocery Wall & The M&A Trap (2014–2021)
Every autumn, in conference rooms in Oslo, Stockholm and Helsinki, the annual grocery negotiations begin. Suppliers arrive with cost documentation, innovation pipelines and marketing commitments. Buyers arrive with a simple and devastating alternative: we can delist you, or we can make it ourselves.
The Norwegian version of this ritual has a name — the autumn hunt — and it functions as an annual repricing of the entire supplier base. What makes it structurally different from grocery negotiation elsewhere in Europe is not the aggression but the arithmetic. In a fragmented retail market, losing one customer costs a branded supplier a slice of distribution. In Norway, losing one of three customers can cost close to a third of a category's national volume in a single decision. That asymmetry is not something a supplier negotiates away with a better slide deck.
The buyer-power problem, quantified. Norway is the extreme case. The Norwegian Competition Authority's margin study, published in January 2025 covering 2017–2022, records that the three largest grocery chains — NorgesGruppen, Coop and Rema — hold a combined market share of around 95% of the retail market.6 All three operate at both wholesale and retail level. All three own supplier-level companies that manufacture their private label ranges. They are simultaneously Orkla's customer, its distributor, and its competitor.
The Authority's conclusion is worth reading carefully, because it cuts both ways. It found little evidence of opportunistic "greedflation" during the 2021–2022 price surge, but it also found that operating profitability for several players at both supplier and retail level was "significantly higher than one would expect to find in a market with strong competition."15 Translation: the Nordic grocery value chain is structurally profitable for everyone inside it, and structurally hostile to anyone trying to enter it. Orkla is a beneficiary of that structure as much as a victim of it — but its share of the surplus is negotiated annually, by people who have alternatives.
Sweden, Denmark and Finland are less extreme but structurally similar: each is a national market of modest population served by a handful of chains and cooperatives, several of which are member-owned and therefore explicitly organised around delivering low prices to their owners rather than margin to their suppliers. The practical effect for a supplier like Orkla is that there is no Nordic market — there are four or five national negotiations, each with its own concentrated counterparty, each conducted in a different language with a different retail culture. Orkla's own quarterly disclosures track market share separately in the Norwegian, Swedish and Finnish grocery sectors precisely because they behave as separate battlegrounds.4 This is why "Nordic scale" is a more limited advantage than it sounds: manufacturing and procurement scale is genuinely regional, but commercial leverage is stubbornly national.
The mechanism that keeps that negotiation honest is private label — egne merkevarer in Norwegian. When a retailer's own-brand tomato soup sits at 70% of the branded price on the shelf directly beneath TORO, the branded product's pricing power is bounded not by consumer willingness to pay but by the retailer's willingness to walk. During inflationary periods, when consumers actively trade down, that boundary tightens.
The visible consequence is in Orkla's own volume data. Look at Orkla Foods, the group's Nordic ambient and frozen food business and the single largest branded operation. In full-year 2025 it reported organic revenue growth of negative 0.2%, comprising positive price of 0.9% and negative volume/mix of 1.1%.4 In a category where the brands are as strong as any in Europe, the company could raise prices and hold margin — the adjusted EBIT margin still improved to 12.6% — but it could not sell more units.4 That is the signature of pricing power exercised into a shrinking basket, and it is the single most important structural fact about Orkla's core.
Stagnation and the search for growth elsewhere. Faced with a mature, oligopsonistic home market, Orkla's management in the mid-2010s did the thing almost every branded consumer goods company does: it bought growth somewhere else.
India. MTR Foods, the Bangalore-based packaged food company, had been acquired back in 2007, and in 2020 Orkla added Eastern Condiments, a Kerala spice business. Combined, they gave Orkla a genuine South Indian food platform — spices, masalas, ready-to-eat meals, breakfast mixes — in a market growing at multiples of Nordic rates.
Out-of-home food. Orkla assembled The European Pizza Company from Kotipizza in Finland, New York Pizza in the Netherlands and Da Grasso in Poland — a franchised quick-service pizza roll-up bolted onto a branded food group.
Sports nutrition and e-commerce. The Health and Sports Nutrition Group brought Gymgrossisten and Bodystore, a direct-to-consumer supplements retailer, into a company whose core competence was selling to supermarket buyers.
The verdict, delivered by the numbers years later. It is easy to be glib about diversification, so let us be specific about what the current disclosures reveal.
By 2025, Health and Sports Nutrition Group generated NOK 1,288 million of revenue and NOK 54 million of adjusted EBIT — a 4.2% margin — on a return on capital employed of 8.2%.4 The European Pizza Company generated NOK 3,145 million of revenue at a 12.1% adjusted EBIT margin, but a return on capital employed of only 8.6%, and in 2025 Orkla recorded write-downs totalling NOK 484 million, the largest of which related to goodwill in the German pizza chains inside that business.4 Compare those returns with Orkla Home & Personal Care, a small, unglamorous Nordic business that in the same year earned a 24.5% return on capital employed.4
There is a second-order problem underneath the returns, and it is about capability rather than price. Selling branded groceries to three professional buyers is a fundamentally different business from operating a franchised restaurant network, which is different again from running a direct-to-consumer e-commerce supplements retailer with paid acquisition costs and repeat-purchase economics. Each requires distinct management instincts, distinct KPIs, and distinct capital intensity. Orkla acquired all three within a few years while its core competence — Nordic branded goods manufacturing and retail negotiation — remained unchanged. Diversification of business model without diversification of managerial capability is how conglomerates reliably destroy value, and it is precisely the failure mode Orkla had already lived through with solar silicon a decade earlier.
That contrast is the entire indictment. Orkla bought international growth at prices that produced returns on capital roughly a third of what its boring domestic assets were already generating. Every krone that went into an out-of-home pizza franchise or a supplements webshop was a krone not returned to shareholders or invested behind Grandiosa. The market noticed. Orkla traded for years at a substantial discount to any reasonable sum-of-the-parts valuation — a discount that is not a mystery when the parts include businesses earning below the group's own cost of capital, wrapped in a corporate centre whose function was hard to describe.
By 2021, with input costs exploding and a central matrix organisation that could not re-price fast enough, the model had run out of road. What happened next was not a strategy refresh. It was the owner taking direct control.
V. The 2022–2023 Transformation: Nils K. Selte & The Industrial Investment Model
On 11 April 2022, Orkla announced that Jaan Ivar Semlitsch, CEO since 2019, was leaving, and that Nils K. Selte would take over as President and CEO.16 Hagen's public framing was diplomatic and unmistakable: Semlitsch had steered the company competently through the pandemic, and Orkla was "now entering a phase that calls for a new form of leadership."16
Who Selte is, and why it matters. Selte was not a consumer goods executive. He had been employed at Canica — Hagen's family office — since 2001, serving as both CFO and CEO of that vehicle, and had sat on Orkla's own board since 2014, chairing the audit committee.16 He also sat on the board of Jotun.
Read that CV honestly and two things follow. First, this was the controlling shareholder installing his own investment manager to run the operating company — a governance arrangement that concentrates accountability but also concentrates risk. Second, the appointment was a statement about what skill Orkla now believed mattered most. It was not marketing. It was not category innovation. It was capital allocation.
The architecture. At its Capital Markets Day on 29 November 2023, Orkla laid out both a structure and a scoreboard.
The structure: Orkla would operate as an industrial investment company overseeing autonomous portfolio companies. Each would get its own board, its own strategy, its own capital structure discipline, and — crucially — its own published financial targets. The corporate centre would shrink. Portfolio companies would be sorted into three buckets. Anchor companies were mature, cash-generative and expected to defend position and fund the dividend. Grow and Build companies were platforms for organic expansion and bolt-on M&A. Transform or Exit companies were businesses that had to fix their economics or leave.
The scoreboard, covering 2024–2026 for the consolidated portfolio companies including Orkla ASA: underlying adjusted EBIT growth of 8–10% compounded annually; adjusted EBIT margin improvement of 1.5 to 2.0 percentage points; and return on capital employed rising from 10% in 2023 to 13% by 2026. Together these were meant to underpin a total shareholder return of 12–14% per year across the strategy period.4
Publishing per-company targets is a genuinely unusual disclosure choice for a European consumer group, and it is worth pausing on why it is strategically significant rather than merely tidy. Once Orkla Foods has a public 2–3% organic growth target and a public 13–14% margin target, the group can no longer hide a weak business inside a strong average. It also means analysts can score management without waiting for management's own framing. That is a real transfer of power to outside investors — and management chose to make it.
The scoreboard so far. Two years into the three-year period, Orkla's own reporting shows underlying adjusted EBIT growth compounding at 12% against the 8–10% target; adjusted EBIT margin up 1.6 percentage points from 9.0% to 10.6% on a rolling twelve-month basis, reaching the target band during Q4 2025; and ROCE at 12.4% against the 13% goal.4 The company's characterisation — ahead on growth and margin, on track on ROCE — is supported by its own disclosed figures.
Two caveats belong here. The margin expansion has been achieved in an environment where Orkla was passing through very large input cost increases, which mechanically inflates revenue and can flatter percentage growth. And the portfolio has been actively reshaped during the measurement period, with low-return businesses exiting the denominator. Neither invalidates the improvement; both mean the underlying operating gain is smaller than the headline delta.
Proof point one: Rhône and Orkla Food Ingredients. On 26 October 2023, Orkla announced that investment funds affiliated with the private equity firm Rhône would acquire 40% of Orkla Food Ingredients at an implied enterprise value of NOK 15.5 billion, with an option for Rhône to acquire a further 9% at the same price per share exercisable through 31 March 2027.17 The transaction completed in 2024.18
OFI is a B2B business — bakery ingredients, sweet inclusions, plant-based solutions — that Orkla founded in 1999 and grew roughly nine-fold to NOK 18.1 billion of sales in the twelve months to September 2023.17 It is Orkla's largest business by revenue and among its least visible.
The strategic meaning is layered. Orkla crystallised a private-market valuation for an asset the public market was almost certainly not valuing separately, kept control, and brought in a partner with buy-and-build experience and capital to fund European bakery consolidation. It also, less comfortably, introduced a minority shareholder with a put-adjacent economic interest and a defined option window — meaning OFI's ownership structure has a scheduled decision point in early 2027 that Orkla does not fully control. As of Q1 2026, Orkla's stake stood at 59.4%.2
Proof point two: selling the water. For over a century Orkla owned hydroelectric assets — the kind of infinite-duration, inflation-linked, near-zero-marginal-cost cash flow that most industrial companies would never voluntarily sell. On 24 January 2025, Orkla announced it was selling its entire hydropower portfolio in two transactions at a combined value of NOK 6.1 billion on a cash and debt-free basis, with Hafslund and Svartisen Holding acquiring Sarpsfoss Limited and Å Energi acquiring Orkla Energi and Trælandsfos Holding.19 The accounting gain was around NOK 5 billion, and the cash proceeds recorded in 2025 were NOK 5.5 billion.4
This is the decision that most clearly tests whether the "industrial investment company" label means anything. Selling a beloved, low-risk, low-return asset to fund higher-return deployment is textbook capital discipline — and it is exactly the sort of thing sentimental industrial groups never do. It also removed a genuinely diversifying cash flow from a company whose remaining earnings are correlated to Nordic grocery and global paint. Whether it was right depends entirely on what the proceeds ultimately earn, which is a question the next three years will answer, not this one.
The commitments. Selte now closes investor presentations with three lines: drive organic value in the existing portfolio; reduce the complexity of the existing portfolio; perform value-adding structural transactions.2 It is a private equity mandate written on a consumer goods letterhead.
It is worth noting what is not in that mandate. There is no revenue target. There is no market share ambition. There is no aspiration to become a European rather than a Nordic company. For a business that spent the 2010s buying growth in unfamiliar geographies and channels, the absence is deliberate and, on the evidence of the acquisition returns, appropriate. The risk on the other side is that a company organised entirely around capital discipline eventually under-invests in the thing that made it valuable — brand building, innovation, and category creation — and harvests its way to a smaller, more efficient, slowly shrinking business. Orkla's own disclosures show advertising spend being maintained at high levels in Orkla Health specifically to protect selective brand positions, which suggests management is aware of the trap.4 Whether it is avoided is a judgement that takes five years to make, not five quarters. The next section examines what is actually inside the portfolio those commitments are being applied to.
VI. Portfolio Segment Deep-Dive: Materiality, Scale, & Hidden Jewels
If you want to understand where Orkla's economic value actually sits, the group income statement will actively mislead you. The largest business by revenue is one almost no consumer has heard of. The most valuable single asset does not appear in revenue at all. And the segment with the best return on capital is a business that sells laundry detergent and toothbrushes to five million Scandinavians.
Let us go through them.
Orkla Foods — the anchor that cannot grow volume
Orkla Foods generated NOK 20,864 million of operating revenue in 2025 with adjusted EBIT of NOK 2,621 million, a 12.6% margin, and a return on capital employed of 14.9%.4 This is the Grandiosa business — Norway's frozen pizza institution — plus Stabburet, TORO, Felix, Abba, Den Gamle Fabrik and the Czech and Baltic food operations.
The economics are genuinely good. A contribution ratio around 40% means roughly forty øre of every krone of sales survives variable costs, which is the arithmetic signature of real brand pricing power in a manufacturing business.4 The problem, as established, is volume. Full-year organic growth was slightly negative, with volume/mix down 1.1%, driven substantially by Norway, where reduced promotional activity depressed units.4
The response has been a portfolio strategy of deliberate simplification — cutting SKUs, concentrating investment into selected growth categories — and Orkla reports that the prioritised platforms grew faster than the portfolio as a whole.4 Q1 2026 showed the first real evidence this might be working: organic growth of 3.5% with growth in both Sweden and Norway, and underlying adjusted EBIT growth of 5.1%.2 One quarter is not a trend, and management flagged that input costs — meat, marine, berries — would keep rising into 2026.4 But the direction changed, which after two years of volume decline is the thing to watch.
Jotun — the asset hiding in the equity method
Orkla owns 42.7% of Jotun A/S, the Sandefjord-based paint and coatings company, and accounts for it using the equity method.4 This means Jotun contributes nothing to Orkla's NOK 71.5 billion of revenue and appears only as a single line: profit from associates.
That line is large. In 2025, profit from associates and joint ventures was NOK 2,181 million, up 17%, overwhelmingly attributable to Jotun.4 Jotun's board proposed lifting the ordinary dividend from NOK 6,500 to NOK 7,000 per share for 2025, of which Orkla's share would be about NOK 1.0 billion — and Orkla received NOK 1.4 billion of dividends from Jotun during 2025, against NOK 948 million the prior year.4 This is not a passive minority stake gathering dust. It is a cash-generating engine attached to Orkla's dividend capacity.
What Jotun actually is. Two businesses share a brand. The decorative segment sells architectural paint, and its strongholds are the Middle East, Southeast Asia and Scandinavia rather than the mature Western European markets where AkzoNobel and PPG concentrate. The performance coatings segment — marine and protective — is where the real moat sits.
The marine coatings business is worth explaining in plain terms, because it is genuinely technical. A ship's hull accumulates barnacles, algae and slime. Fouling increases drag; drag increases fuel burn; fuel is the largest operating cost of a commercial vessel. Antifouling coatings are engineered surfaces designed to release biocide or shed fouling at a controlled rate over a multi-year docking cycle. Get the chemistry wrong and a shipowner burns millions of dollars in extra bunker fuel and loses schedule reliability. Get it right and you save them more than the paint costs.
This produces two durable advantages. First, the buying decision is high-consequence and low-price-sensitivity relative to the value at stake, which is the classic setup for pricing power. Second, hull coating must be applied wherever the vessel happens to dry-dock, which means a supplier needs a physical service and technical support network spanning every major shipyard cluster on earth. Building that network is a decade-long capital and organisational commitment. It is a genuine barrier, and it explains why marine coatings globally is an oligopoly rather than a fragmented commodity market.
The performance. In Q1 2026 Jotun reported revenue of NOK 8,581 million, an EBIT margin of 23.2%, and a rolling twelve-month return on capital employed of 34.7%.2 Underlying revenue growth was 9.4% and underlying operating profit growth 16%.2 A business earning mid-thirties returns on capital while growing high single digits is, on any reasonable framework, a very high quality asset.
The risks, stated plainly. Three of them are live. Currency: Jotun reports in Norwegian kroner while earning across emerging markets, and a stronger krone translated a 6.0% currency-adjusted full-year 2025 revenue gain into roughly flat reported revenue.4 Geopolitics: on the Q1 2026 call, management noted the Middle East conflict affects around 8% of Jotun's revenues and is disrupting raw material prices, supply chains and logistics.20 Competition: Jotun's own guidance flags that intensified competitive pressure on selling prices will weigh on margins going forward even as raw material costs stay stable.4 Note also that Orkla's Q1 2026 reported profit contribution from Jotun of NOK 617 million was actually down 5.8% year on year despite the strong underlying performance — a reminder that translation effects can overwhelm operations in reported figures.2
Finally, the governance point that a sceptic should raise: Orkla does not control Jotun. It holds a large minority beside the founding Gleditsch family interests. It cannot force a sale, a listing, or a change in dividend policy. An asset you cannot control is worth less than one you can, and any sum-of-the-parts valuation that applies a full listed-peer multiple to Orkla's Jotun stake is implicitly assuming a liquidity event that no one has announced.
Orkla Food Ingredients — the biggest business nobody discusses
OFI recorded NOK 21,257 million of revenue in 2025 — more than Orkla Foods — at an adjusted EBIT margin of 7.1% and a return on capital employed of 12.4%.4 It sells bakery ingredients, sweet inclusions and plant-based solutions to industrial and craft bakeries across Europe and increasingly the US.
The margin looks thin next to Orkla's branded businesses, and it should: this is B2B distribution and manufacturing, not consumer branding. The relevant question is not margin but return on capital and growth, and on both counts OFI has been performing. Full-year organic growth was 7.7%, of which volume/mix contributed 3.6% — meaningfully better volume performance than the branded Nordic businesses achieved.4 Q1 2026 delivered 9.2% organic growth with underlying adjusted EBIT growth of 10.4%.2
OFI's model is buy-and-build: acquire regional ingredient specialists, integrate procurement and logistics, keep the customer relationships local. In 2025 it purchased Eurohansa Toruń, Le Vesuve and Decorgel, while divesting two Icelandic businesses at a NOK 184 million accounting gain.4 That two-way activity — buying in core geographies, selling sub-scale positions — is the behaviour you want to see from a platform that claims to be disciplined rather than merely acquisitive.
Orkla Snacks — good brands, bad beans
Orkla Snacks — KiMs, OLW, Nidar, Panda, Kalev, and the Swedish candy brand BUBS — produced NOK 10,481 million of revenue in 2025 at a 12.7% adjusted EBIT margin.4
The story here for two years has been cocoa. Cocoa prices rose to levels that broke the historical relationship between chocolate input costs and shelf prices, and Orkla's response was to raise prices hard: full-year organic growth of 5.2% comprised 6.6% price and negative 1.3% volume/mix.4 That is the mechanical trade-off every confectioner faced, and it is honest of the company to disclose the split so clearly.
What makes Snacks interesting in 2026 is that the trade appears to be reversing. Q4 2025 volume/mix turned positive at 1.7%, Q1 2026 organic growth reached 7.5% and management described "recovery in chocolate volumes and margins," with underlying adjusted EBIT growth of 19%.42 Return on capital employed rose to 12.1% in 2025.4
The other thing worth watching is BUBS. Orkla is pushing a Swedish sweets brand into the United States with the partner Mount Franklin Foods, and on the Q1 2026 call management said distribution had reached more than 40,000 stores, though profitability remains constrained by brand-building investment.20 This is a small, cheap, genuinely optionality-shaped bet: if a niche Nordic candy brand can build a US following, it costs little and could matter; if it fails, the write-off is immaterial. More consumer companies should structure international expansion this way.
Orkla India — from subsidiary to listed company
On 6 November 2025, Orkla India Limited completed its initial public offering and listed on BSE and the National Stock Exchange of India. Orkla Asia Pacific sold 20.6 million shares, representing 15% of the share capital, at INR 730 per share — approximately NOK 84 — generating net proceeds after tax and transaction costs of NOK 1.5 billion and leaving Orkla with 75% ownership.4 The IPO was structured entirely as an offer for sale, raising roughly ₹1,667 crore, and the shares listed at a modest premium to the issue price.21
The business itself — MTR Foods, Eastern Condiments, Rasoi Magic — generated NOK 2,981 million of revenue in 2025 at a 16.3% adjusted EBIT margin, the highest margin of any Orkla portfolio company.4 Full-year organic growth was 3.4% with underlying adjusted EBIT growth of 13.1%; Q4 was stronger, with 8.1% organic growth led by 10% tonnage volume growth.4
Q1 2026 was softer: organic growth of 4.3% but underlying adjusted EBIT down 7.8%, distorted by government grants received in the prior-year quarter.2 Reported figures were also depressed by a stronger krone.
Strategically, the listing is the most interesting thing Orkla has done in years, and not because of the NOK 1.5 billion. Selte's own framing in the Q4 2025 report was that the listing "demonstrates Orkla's flexible approach to ownership structures and finding the right growth platform for our companies."4 What Orkla has actually created is a mechanism: an Indian consumer business now carries a daily, independent, rupee-denominated public valuation set by a market that habitually pays high multiples for packaged food. That valuation is visible to every Orkla shareholder and every analyst building a sum-of-the-parts model. Orkla no longer has to argue that its Indian business is worth something; the market prints the number every day. It also retains 75%, giving it flexibility to sell down further if the multiple justifies it.
The sceptical counterpoint: a 15% free float in a company controlled 75% by a foreign parent is a thin market, and the price it produces may not survive a larger sell-down.
The rest of the portfolio
Orkla Health (Möller's, food supplements, wound care) generated NOK 7,656 million of revenue in 2025 at an 11.9% margin but a return on capital employed of just 9.2% — the weakest of the significant branded businesses.4 It is also the most troubled: Q1 2026 underlying adjusted EBIT fell 29%, and the company has announced the closure of three factories.2 Management was direct about the near-term pain on the Q1 call, describing a period of "double cost" during wind-down.20 Rising cod liver oil prices, driven by tighter fishing quotas, add an input constraint that no amount of restructuring solves.4
Orkla Home & Personal Care is the quiet outperformer: NOK 2,821 million of revenue, a 12.4% margin, cash conversion of 112%, and that 24.5% return on capital employed.4 It gained share in Norwegian, Swedish and Finnish grocery in Q4 2025.4 Small, capital-light, share-gaining — the profile most conglomerates systematically under-invest in because it is unexciting.
Orkla Health is the clearest current test of whether the "transform" half of "transform or exit" is a real capability. The business owns Möller's, a cod liver oil brand with the sort of multi-generational Norwegian household penetration that money cannot buy, and it still cannot convert that into an adequate return on capital. The plan — consolidate manufacturing from a fragmented factory footprint into fewer sites — is the correct textbook answer, and the disclosed cost is a period of carrying duplicate overhead while the transition runs. Investors should hold management to a specific standard here: the closures were announced with an end-2027 completion horizon, and the return on capital employed should be visibly rising by the time that horizon arrives. If it is not, the classification should change from transform to exit.
Orkla House Care (painting tools) delivered NOK 1,656 million of revenue and a 14.1% return on capital employed after a sharp profitability recovery.4 The European Pizza Company grew consumer sales 9.7% in Q4 2025 with positive same-store sales at all businesses and 37% adjusted EBIT growth, but still earns only 8.6% on capital and carried the year's largest goodwill write-down.4 Health and Sports Nutrition Group improved — underlying adjusted EBIT up 56% for the year, cash conversion of 158% — from a very low base.4 Orkla Real Estate is a run-off: ten apartments delivered in Q4 2025 versus fifty-three a year earlier.4
The asset that is no longer here
The outline of Orkla's portfolio as recently as 2024 would have included hydropower — roughly 2.5 TWh of clean generation, minimal capex, near-perfect cash conversion. It is gone, and its absence is itself analytically important. Orkla's 2024 figures were restated to reclassify hydropower as discontinued operations, and the NOK 5,120 million reported under discontinued operations in 2025 is almost entirely that sale.4
Without it, Orkla's earnings are more concentrated in two exposures: Nordic branded food sold through a three-buyer oligopsony, and a 42.7% minority in a global paint company. That is a more focused company. It is also a less diversified one, and investors should price it accordingly.
VII. Strategic Frameworks: Helmer's 7 Powers & Porter's 5 Forces
Frameworks are only useful if you let them return uncomfortable answers. Applied honestly to Orkla, they return a split verdict: the company has real, durable power in specific places, and almost none in others.
Hamilton Helmer's 7 Powers
Branding — high, but geographically imprisoned. Helmer's definition of branding power is narrow: a durable attribution of higher value to an objectively identical offering. Grandiosa, TORO and Möller's clear that bar in Norway. Consumers pay a premium over private-label equivalents for reasons that are affective and habitual rather than functional, and they have been doing so across generations. The evidence is in Orkla Foods' contribution ratio holding around 40% while volumes decline — the company chose price over units and the brands absorbed it.4
But branding power is bounded by the geography in which the brand means something. Grandiosa has no equity in Germany. TORO has none in France. This is why Orkla's international expansion has repeatedly required buying brands rather than exporting them.
Cornered resource — real in two places. Jotun's marine coatings formulations and global drydock service network qualify. So, arguably, does Orkla's shelf position itself: in a market where three buyers control 95% of distribution, incumbent listings across thousands of SKUs are an asset a new entrant cannot replicate by spending money.6
Scale economies — moderate, and regionally specific. Orkla is small globally. Its NOK 71.5 billion of revenue is a fraction of Nestlé's or Unilever's. But scale power operates within relevant markets, and inside the Nordics, Orkla's manufacturing density, distribution network and share of national advertising inventory create genuine unit-cost advantages against any sub-scale local challenger. Against a global giant that chooses to attack, the advantage is narrower.
Process power — modest. Decades of Nordic-specific product development and shelf optimisation constitute accumulated know-how. It is real, but it is the kind of advantage that erodes when a competitor hires the right twenty people.
Switching costs, network economies, counter-positioning — largely absent. A consumer switches soup brands at zero cost. There is no network effect in frozen pizza. And on counter-positioning, Orkla is on the wrong side: it is the incumbent branded manufacturer being counter-positioned against by retailer private label, which offers a structurally similar product at a structurally lower cost because it carries no brand-building expense and no listing fee.
That last point deserves emphasis, because it is the most important competitive fact about this business and it is not one that management can strategise away.
Porter's Five Forces
Buyer power — extreme. Already established: three chains, 95%, vertically integrated into supply, annual negotiations. This is as adverse a buyer structure as exists in European consumer goods.
Threat of substitutes — high and structural. Private label is not a cyclical phenomenon that recedes when inflation ends. It is the retailer's permanent strategy for capturing supplier margin, and the retailer controls the shelf on which the comparison is made.
Supplier power — moderate but volatile. Cocoa, cod liver oil, meat, marine proteins, berries, vegetable oils, energy, packaging and freight all move independently of Orkla's pricing calendar. The 2024–2025 cocoa episode showed the mechanism precisely: input costs moved faster than the annual retail negotiation cycle allowed prices to move, compressing margin and destroying volume simultaneously. On the Q1 2026 call, management flagged fresh upward pressure on energy, freight and packaging.20
Competitive rivalry — high but stable. The global majors compete in Orkla's categories without dominating them, and local challengers appear constantly. What is notable is that rivalry has not been the main source of Orkla's problems. Buyer power and substitution have been.
Threat of new entry — low in branded food, higher in adjacent channels. Building a new Nordic food brand from scratch and winning national listings is close to impossible. But direct-to-consumer channels, discounters and food-service formats create entry paths around the traditional shelf — which is part of why Orkla owns a pizza chain and a supplements webshop, with mixed results.
How Orkla compares
Set against the global branded food majors, Orkla screens as a smaller company with a mid-pack margin structure and an unusually high proportion of earnings coming from non-consolidated and non-branded sources. A group adjusted EBIT margin of 10.6% on a rolling basis sits below the mid-to-high teens that the largest global packaged food companies typically report, and that gap is mostly structural rather than managerial: Orkla's revenue mix includes a NOK 21 billion B2B ingredients business running at a 7.1% margin and a franchised restaurant operation, neither of which carries branded-food economics.4 Stripping to the branded Nordic core — Orkla Foods at 12.6%, Orkla Snacks at 12.7%, Home & Personal Care at 12.4% — the margins are respectable for regional players without global procurement scale.4
Against European peers with similar regional-champion profiles, the differentiating feature is not the operating business at all. It is the equity-accounted coatings stake and the disclosure regime around it. Very few listed consumer groups derive a comparable share of economic earnings from a minority holding in an unrelated, unlisted industrial company. That is simultaneously Orkla's most attractive asset and the main reason a screen-based investor will misprice the company in both directions.
The synthesis. Orkla's competitive position is strong in defence and weak in offence. It can hold what it has almost indefinitely; the brands are not going to be displaced. What it cannot easily do is grow units in its core markets, because growth requires either taking share from a customer that owns the shelf, or exporting brand equity that does not travel. Everything about the current strategy — the portfolio company structure, the ROCE targets, the divestments, the India listing, the OFI partnership — is an admission of that constraint and an attempt to create value through capital allocation instead of organic expansion.
Which puts the entire investment case on the shoulders of the people doing the allocating.
VIII. Current Management, Governance, & Capital Allocation Record
Orkla's governance in 2026 is in the middle of the most consequential transition it has faced since 2004, and it happened without warning.
Nils K. Selte. Four years in, a record exists. The three-commitment framing — organic value, reduced complexity, value-adding structural transactions — has stayed verbatim across presentations, which is a low bar but one many management teams fail. More substantively, the targets set in November 2023 have been reported against consistently and specifically every quarter, including the components where performance lags. When ROCE ran behind the trajectory, the reports said so.4 When Orkla Health deteriorated, the Q1 2026 presentation put a minus 29% underlying EBIT figure on the slide and management explained the restructuring cost mechanics under direct questioning from DNB Carnegie's Ole Martin Westgaard, who pressed on whether the problem was demand or restructuring expense.220
That last detail is the kind of thing worth weighting. On the Q1 2026 call, analysts from DNB Carnegie, UBS and ABG Sundal Collier pushed on cost timing, the 2026 outlook and Jotun's contribution amid geopolitical uncertainty, and the answers were specific about which quarters cost pressure would land in rather than deflecting into generalities.20 Management also declined to pre-announce anything about the 2027–2030 strategy, deferring it to a Capital Markets Day later in 2026.20 Discipline about not front-running your own strategy process is a mild positive signal.
The behavioural record is what matters most, though, and it is genuinely unusual for a European consumer group: Orkla sold a century-old hydropower franchise, exited textiles at an accounting loss of NOK 47 million on Pierre Robert Group rather than nurse it, listed 15% of its Indian business, sold 40% of its largest revenue generator, and divested sub-scale Icelandic ingredient businesses.4 These are not the actions of a management team optimising for the size of the empire it runs.
The counter-evidence is also real. The Transform-or-Exit bucket still contains businesses. The European Pizza Company earns 8.6% on capital and required a goodwill write-down in 2025; Health and Sports Nutrition Group earns 8.2%.4 Both were classified for transformation or exit years ago and both remain consolidated. Management would say — reasonably — that selling into a weak bid destroys value and that both businesses are improving. A sceptic would say that "transform or exit" without a deadline is just "hold."
Stein Erik Hagen and what his death changes. Hagen sat on Orkla's board from 2004 and chaired it from 2006, and was re-elected as Chair at the annual general meeting on 23 April 2026 — eleven days before he died.221 Selte's tribute described "more than 30 years of collaboration in various roles."1
The immediate governance response was orderly. Liselott Kilaas stepped in as acting Chair.1 Orkla called an extraordinary general meeting for 10 July 2026, at which Christer Kjos was elected Chair of the Board along with an additional shareholder-elected director, leaving a board of seven shareholder-elected members.23 Kjos is the CEO of Canica Holding AG and is married to Caroline Hagen Kjos, Stein Erik Hagen's daughter.
Investors should be clear-eyed about what this arrangement is. Canica and related parties hold 25.003% of Orkla.9 The Chair of the Board runs Canica. The CEO spent twenty-one years at Canica. Orkla's own related-party disclosure notes annual group sales of around NOK 20 million to companies in the Canica system, while stating there were no special transactions as at 31 December 2025.4 The related-party flows are trivially small. The concentration of influence is not.
There is a defensible case for this structure: a controlling family with a multi-generational horizon is a natural counterweight to quarterly-earnings short-termism, and Hagen's own record of forcing the 2011 restructuring is the best possible evidence for it. There is also an obvious risk: a board chaired by the controlling shareholder's chief executive, overseeing a CEO drawn from the same office, has limited structural capacity to challenge that shareholder's preferences. Minority investors are, in practice, trusting the Hagen family's judgement — and the family member whose judgement was actually tested over twenty years is no longer there. Christer Kjos's tenure as Chair began three weeks ago. There is no record to assess.
Incentives and capital returns. Management compensation is anchored to the published ROCE and total shareholder return framework, which at least aligns pay with the metric the strategy claims to optimise. The capital return record is concrete. Orkla paid a dividend of NOK 10.00 per share in May 2025, of which NOK 6.00 was additional to the ordinary dividend, and total dividends paid in 2025 reached NOK 10.2 billion.4 The board proposed NOK 6.00 per share for the 2025 financial year — NOK 4.00 ordinary plus NOK 2.00 additional.4 A buyback programme of up to NOK 4 billion was initiated on 17 November 2025, running to end-2026 at the latest, with shares to be cancelled.4 Orkla repurchased NOK 1 billion of stock in Q1 2026 alone, and announced completion of the programme on 23 July 2026 — well ahead of the deadline.2024
Meanwhile the balance sheet has been getting stronger, not weaker: net interest-bearing liabilities including leases fell to NOK 14.2 billion at end-2025, equal to 1.4 times EBITDA, then to NOK 13.6 billion and 1.3 times at the end of Q1 2026, with an equity ratio of 58.8%.42 Average interest cost fell to 4.3% in Q4 2025 from 5.0%.4 Returning over NOK 11 billion to shareholders in one year while reducing leverage is only possible because of asset sales — but it is the correct use of asset sale proceeds when the alternative is another 8%-return acquisition.
The honest summary: on the evidence available, this management team has done what it said it would do, disclosed against its own targets in unusual detail, and returned the proceeds of divestment rather than redeploying them into empire. The unresolved questions are whether the remaining low-return assets ever actually exit, and whether a newly reconstituted board maintains the discipline.
IX. Investor Stress Test: Bull vs. Bear Case & Key KPIs
Imagine an activist with a 3% stake and a slide deck, presenting at a Nordic investor conference. What would they say?
The holding company challenge. "You are asking me to pay for a corporate centre. If I want Nordic branded food, I can buy a pure-play. If I want global coatings, I can buy AkzoNobel or PPG or Nippon Paint. If I want Indian packaged food, I can now buy Orkla India directly on the NSE — you listed it yourself. What does Orkla ASA add that I cannot assemble more cheaply, with more control, and without a 25% shareholder whose family runs the board?"
That is the strongest bear argument, and it has force. The corporate centre's answer must be that it allocates capital better than the market would — that Orkla can buy a Danish bakery business or a Polish ingredient specialist at private multiples and integrate them into a platform earning above its cost of capital. Orkla Food Ingredients' 12.4% ROCE and Orkla Foods' 14.9% suggest the platforms do earn adequate returns.4 The Transform-or-Exit businesses at 8–9% suggest the centre has also destroyed capital, and recently.4
The value-unlock question. "You have crystallised value in OFI, hydropower and India. Fine. But the discount persists. What is the plan for the rest — and what is the deadline?" Management's answer is the 2026 Capital Markets Day and the 2027–2030 strategy period.420 Investors should treat that event as the real test of whether complexity reduction continues or plateaus.
The bull case
Sum-of-the-parts arithmetic that the market has been forced to confront. Every structural transaction of the past three years has replaced a management assertion with a market price. Rhône's transaction implies an enterprise value for OFI; the Indian listing prints a daily equity value for that business; the hydropower sale converted an unlisted asset into NOK 6.1 billion of cash. What remains unpriced is Jotun — an unlisted paint company earning a 34.7% rolling return on capital employed with 16% underlying operating profit growth.2 If Orkla continues converting opaque assets into observable prices, the discount has fewer places to hide.
Jotun as a compounding cash machine. The dividend from Jotun rose from NOK 948 million in 2024 to NOK 1.4 billion in 2025, with roughly NOK 1.0 billion proposed for the 2025 financial year, and the associate profit line grew 17%.4 This is an independently managed, high-return business whose contribution to Orkla is growing and requires no capital from Orkla.
Margin and volume recovery in the core. The 2024–2026 targets are being hit or beaten on growth and margin.4 More importantly, the composition of growth improved: Q1 2026 organic growth of 4.9% included 3.2 percentage points of volume and mix, versus a period in 2024–2025 when volume was frequently negative.2 If volume-led growth is genuinely returning after the inflation shock, the earnings quality improves materially.
Optionality that costs nothing to hold. A further sell-down of Orkla India. Rhône's 9% option resolving. BUBS in the US. Continued bolt-ons at OFI, including the Danish bakery platform acquisition in June 2026.24 None of these require Orkla to be right about all of them.
The bear case
Retailer squeeze is permanent, not cyclical. Nothing in the 2024–2026 plan changes the fact that three Norwegian chains control 95% of distribution and manufacture competing products.6 Orkla Foods' 2025 organic revenue decline happened during a period of successful margin expansion — which is precisely the pattern of a business monetising an eroding volume base.4
Input costs will spike again. Cocoa did it in 2024–2025; cod liver oil quotas are doing it to Orkla Health now.4 Because retail prices in the Nordics reset on an annual negotiation cycle, Orkla structurally absorbs the first several months of any input shock. This is not a management failing; it is a feature of the industry structure, and it will recur.
The restructuring is not free. Ten portfolio companies with independent boards, independent finance functions and independent strategy processes carry duplicated overhead. The model only pays if the decentralisation gains exceed those costs. Orkla ASA and Business Services reported adjusted EBIT of negative NOK 84 million in Q4 2025, improved from negative NOK 103 million, which suggests centre costs are being managed — but a fully decentralised group is a bet that ten management teams allocate better than one.4
Concentration risk after diversification loss. With hydropower gone, a bad year in Nordic grocery and a bad year for Jotun would coincide. Jotun's own guidance warns of competitive price pressure on margins and Middle East disruption affecting 8% of revenues.420
Governance transition risk. A new Chair with three weeks in the role, drawn from the controlling shareholder's own executive team, taking over from a figure who had shaped the company for two decades. The structure that produced the good decisions of 2011 and 2022 was, in large part, one person's conviction. That person is gone.
Second-layer diligence: accounting, disclosure and the things that do not appear in the headline
A few items belong in any serious file on this company, none of them alarming in isolation, all of them worth monitoring.
Accounting judgements. Orkla's reported earnings are heavily shaped by two line items that require management discretion. The first is "Other income and expenses," which sat at net costs of NOK 561 million for 2025 and is where restructuring charges, M&A costs and disposal gains are collected — including the NOK 184 million gain on the Icelandic ingredient disposals sitting alongside NOK 338 million of restructuring costs in the fourth quarter.4 Because adjusted EBIT sits above this line, the gap between EBIT (adj.) of NOK 7,647 million and reported operating profit of NOK 7,086 million is the measure of how much "adjustment" is happening.4 It is disclosed, it is reconciled, and it is not egregious — but the two numbers should be tracked together rather than separately.
The second is impairment testing on goodwill, where Orkla recorded write-downs of NOK 484 million in 2025, largest of which related to goodwill in the German pizza chains inside The European Pizza Company.4 Goodwill impairment is a lagging indicator of acquisition quality, and it is worth noting that the impairment landed in exactly the business the market would have flagged as the weakest acquisition.
The reclassification effect. Orkla restated its 2024 figures to move hydropower into discontinued operations following the sale.4 This is standard IFRS treatment and correctly disclosed. It does mean that year-on-year comparisons drawn from older presentations will not tie to current ones, and that the NOK 12,057 million of total 2025 profit is not a like-for-like earnings figure — the NOK 6,937 million from continuing operations is the number that matters for run-rate purposes.4
Contingent items. Part of the hydropower consideration remains unsettled: an additional NOK 301 million was recognised in Q4 2025 relating to an estimated purchase price adjustment following a favourable outcome in a tax dispute involving one of the sold companies, with cash settlement expected during 2026.4 Small in the context of the group, but a reminder that disposal proceeds are not always final at signing.
Credit and funding. The balance sheet is conservatively positioned. At the end of Q1 2026 the average debt maturity was 2.7 years, funding was split across bonds, commercial paper and bank facilities, and Orkla held substantial undrawn credit lines.2 A relatively short maturity profile is a mild sensitivity to refinancing rates, but leverage of 1.3 times EBITDA and an equity ratio near 59% leaves considerable headroom.24
Ownership and personnel. The dominant shareholder position is unchanged in size but transformed in character following the founder's death, and Orkla holds treasury shares that rose to 11,597,392 at the end of 2025 as the buyback progressed — shares the company intends to cancel, which mechanically supports per-share metrics.4 The other governance point worth flagging is that Orkla's CEO also sits on Jotun's board, which is efficient for information flow and simultaneously means the same individual is on both sides of Orkla's most valuable relationship.
Regulatory and political context. No material litigation or regulatory action against Orkla is currently disclosed as an overhang. The relevant regulatory exposure is indirect and sits one level up the value chain: Norwegian grocery competition has been under sustained political and regulatory scrutiny, including the Competition Authority's margin work and periodic parliamentary attention to supplier pricing terms.615 Intervention that reduced retailer buying power would, in principle, benefit branded suppliers — but the same scrutiny has also examined whether large suppliers receive preferential terms that disadvantage smaller competitors. Orkla is a large enough supplier to be on both sides of that debate, and investors should not assume regulatory attention to grocery concentration is unambiguously good news for it.
The three KPIs that actually matter
Ignore headline revenue. It is distorted by currency translation, portfolio changes and pass-through pricing. Three metrics carry the thesis.
1. The volume/mix component of organic growth in the consolidated portfolio companies. Orkla discloses organic growth split between price and volume/mix every quarter, and this is the single most honest read on whether the brands are winning or merely re-pricing. Sustained positive volume/mix means the brand shield is holding against private label. Negative volume/mix alongside positive price means Orkla is harvesting.
2. Return on capital employed. This is the metric the entire industrial-investment-company thesis is built on, it is tied to management incentives, and it is the one where Orkla is closest to missing its own target. Watch both the group figure and the dispersion between portfolio companies — the gap between Orkla Home & Personal Care's mid-twenties and The European Pizza Company's high single digits is where the capital allocation story will be won or lost.
3. Jotun's currency-neutral operating profit growth and the cash dividend it remits to Orkla. Because Jotun is equity-accounted, it is invisible in every operating metric Orkla reports. Its underlying profit growth and its dividend are the two numbers that tell you what is happening to what may be Orkla's most valuable single asset.
Everything else — margin, EPS, leverage — is downstream of those three. Two of them are disclosed every quarter in Orkla's own reporting, which makes this an unusually easy company to hold to account.
X. Epilogue & Playbook Lessons
There is a museum railway that still runs at Løkken Verk, carrying tourists along the line Christian Thams electrified to haul pyrite to the fjord. The mine closed in 1987. The company that dug it now sells frozen pizza, bakery inclusions, cod liver oil and, indirectly, paint for the hulls of container ships.
That is not a charming historical footnote. It is the thesis.
Legacy conglomerates can be re-invented — but only by owners, not managers. Orkla has shed four complete identities: mining, pulp and chemicals, diversified industrial conglomerate, and centralised FMCG operator. Each transition was survivable because the balance sheet was never bet on the transition itself. What is striking is that neither of the two most important pivots — the 2011 industrial exit and the 2022 reorganisation — was initiated by professional management. Both came from a controlling shareholder with the votes to force them. That is a genuine, uncomfortable lesson about how corporate change actually happens in practice.
Brand equity protects margin, not volume. This may be the single most useful takeaway for anyone analysing consumer staples. Orkla's Nordic brands proved able to pass through historic cocoa inflation and protect a 40% contribution ratio. They did not prevent volumes from declining. In a market where the distributor is also the competitor, brand strength determines how much you earn per unit; it does not determine how many units you are permitted to sell. Investors who treat those as the same thing will systematically overpay for branded consumer companies facing consolidated retail.
Private equity governance can be imported into a public company — with a price. Rhône's minority in OFI, per-company hurdle rates, published portfolio targets, and a three-tier Anchor / Grow and Build / Transform or Exit classification are all mechanisms borrowed from buyout funds. They impose accountability that most listed conglomerates avoid. The price is a governance structure that concentrates power in a single family office, and an ownership arrangement in OFI with a scheduled option decision in 2027 that Orkla does not unilaterally control.
Hidden assets stay hidden until someone prints a price. Jotun contributed NOK 2.2 billion of associate profit and NOK 1.4 billion of cash dividends in 2025 while appearing nowhere in Orkla's revenue.4 Orkla India was invisible until an Indian exchange started quoting it every morning. The most reliable way to close a conglomerate discount is not investor relations; it is a transaction. Orkla has done three in three years, and the discount narrowed rather than disappeared — which tells you something about how much of it was always about the corporate centre itself rather than the assets underneath.
The unresolved question. Orkla has proved it can sell things well. It has not yet proved the second half of the model — that the capital freed up will earn more in its next use than in its last. Hydropower produced cheap, permanent, low-risk cash flow. What replaces it will have to earn considerably more to justify the trade, and most of the proceeds so far have gone to dividends and buybacks rather than to new platforms. That is a defensible choice when your own shares are cheap. It is not, over a decade, a growth strategy.
The scoreboard for that judgement starts arriving on 20 August 2026, when Orkla reports its second quarter, and continues at the Capital Markets Day later this year, when the 2027–2030 targets are set — the first strategy period in twenty years that will be designed without Stein Erik Hagen in the room.24
XI. Outro & Links
Orkla in 2026 is a 372-year-old company that has been deliberately taken apart and reassembled as an investment vehicle. It owns some of the strongest consumer brands in Northern Europe, a minority position in one of the world's best coatings businesses, a newly listed Indian food company, and a European ingredients platform part-owned by a New York private equity firm. It has hit or exceeded most of the financial targets it set for itself in 2023, returned more than NOK 11 billion to shareholders in a single year while cutting leverage, and just changed the chair of its board under the worst possible circumstances.
Whether that adds up to a durable compounding machine or an elegantly organised collection of mature assets is the question the next strategy period will answer.
For readers who want to go to the source material: Orkla's quarterly reports and presentations, its Capital Markets Day materials, and the portfolio company disclosures are the primary documents that matter, and the per-company financial targets published since November 2023 make it unusually easy to score management against its own commitments.
References
-
Orkla's Board Chair Has Passed Away — Orkla ASA, 2026-05-04 ↩↩↩↩↩↩
-
First quarter results presentation, 20 May 2026 — Orkla ASA ↩↩↩↩↩↩↩↩↩↩↩↩↩↩↩↩↩↩
-
Fourth quarter 2025 report — Orkla ASA, 2026-02-12 ↩↩↩↩↩↩↩↩↩↩↩↩↩↩↩↩↩↩↩↩↩↩↩↩↩↩↩↩↩↩↩↩↩↩↩↩↩↩↩↩↩↩↩↩↩↩↩↩↩↩↩↩↩↩↩↩↩↩↩↩↩↩↩↩↩↩↩↩↩↩↩↩↩
-
Orkla reports organic growth in the first quarter — Orkla ASA, 2026-05-20 ↩
-
The Norwegian Competition Authority's Margin Study 2024 — Konkurransetilsynet, 2025-01 ↩↩↩↩↩
-
Orkla A/S — Company History, International Directory of Company Histories ↩↩↩↩
-
Recommendation of the Nomination Committee to the Extraordinary General Meeting — Orkla ASA, 2026 ↩↩
-
Agreement on sale of Elkem to Bluestar completed — Orkla ASA, 2011-04-14 ↩
-
Hydro acquires Sapa to create a global aluminium champion — Norsk Hydro, 2017-07-10 ↩
-
Orkla ASA: Orkla acquires Cederroth — Orkla ASA, 2015-01-15 ↩
-
Few signs of greedflation, but generally high profitability in groceries — Konkurransetilsynet ↩↩
-
Nils K. Selte new Orkla President and CEO — Orkla ASA, 2022-04-11 ↩↩↩
-
Orkla announces OFI partnership with Rhône — Orkla ASA, 2023-10-26 ↩↩
-
Orkla sells its hydro power portfolio — Orkla ASA, 2025-01-24 ↩
-
Earnings call transcript: Orkla's Q1 2026 results show solid growth — Investing.com, 2026-05-20 ↩↩↩↩↩↩↩↩↩↩
-
Orkla ASA: Initial Public Offering of Orkla India Limited completed — Orkla ASA, 2025-11-06 ↩
-
Orkla's Board of Directors and Chair of the Board of Directors elected — Investegate, 2026-04-23 ↩
-
New board member and Chair of the Board of Directors of Orkla ASA elected — Orkla ASA, 2026-07-10 ↩
 LinkedIn
 WhatsApp
 Reddit
 Hacker News
 Email
Email Kindle
 RSS Feed
 Spotify
 Apple Podcasts
 Amazon Music
 Audible
 YouTube