Cranswick plc: The Farm-to-Fork Bet
I. A Food Company Gets Bigger
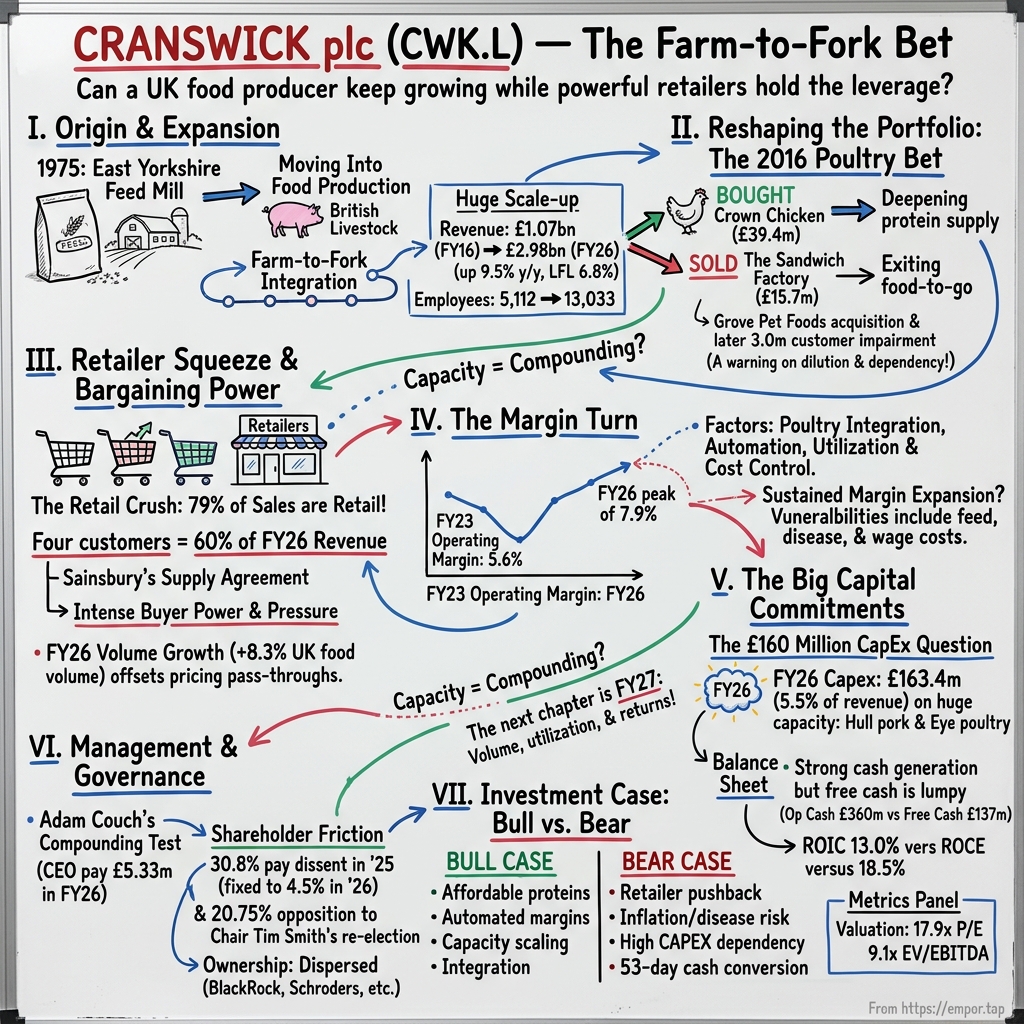
On 19 May 2026, Cranswick told the London market that it had just finished the best year in its history. Revenue for the year to the end of March had risen 9.5% to almost £3bn, adjusted operating profit had grown faster still, and the dividend had gone up for the thirty-sixth year in a row.1 The company that started among East Yorkshire pig farmers now sells sausages, bacon, cooked meats, fresh pork, fresh chicken, dips, olives, ready-to-eat chicken and dry pet food to most of the large British supermarkets. It had become, quietly, one of the largest food producers in the country.
For an investor, the first useful thing to notice about that record year sits between two numbers. Reported revenue grew 9.5%. Like-for-like revenue, which strips out businesses bought during the year, grew 6.8%.2 The gap is worth about £74m of sales, contributed by the sausage maker Blakemans and the pig-genetics business JSR, both bought within the previous eighteen months.2 The headline is the size of the group. The like-for-like number is the health of the group. Both were good, but they tell different stories, and this one will keep asking which is which.
The underlying story was a volume story, and a strong one. Cranswick's UK food volumes rose 8.3% across the year, accelerating from about 7% in the first half to about 9.5% in the second.3 Volume growth of that size, in a mature food market where shoppers do not suddenly start eating twice as many sausages, means one of two things. Either Cranswick took business from someone else, or its customers grew faster than the market and took Cranswick with them. The evidence suggests a bit of both. The fresh and chilled grocery market grew 5.7% over the year, so Cranswick outran it.3 Its poultry sales grew almost 14%, gourmet products about 15% and pet food nearly 30%.3 Poultry, a category the company barely touched a decade ago, now accounts for roughly a fifth of group revenue.2
Profit grew faster than sales, which is the second part of the scene. Adjusted operating profit rose 14.5% to £237m, lifting the adjusted operating margin by 35 basis points to 7.9%.3 Put in plain English: out of every £100 that a supermarket paid Cranswick, the company kept about £7.90 after paying for pigs, chickens, feed, packaging, wages, energy and the depreciation of its factories. That is thin by the standards of a software company and decent by the standards of meat processing, where a few pence of cost movement per kilo can erase a year's profit. In a business this thin, a third of a percentage point is not a rounding detail. On almost £3bn of revenue, it is roughly £10m of extra profit.
Then there are the people who buy the food, and here the story acquires its tension. Four customers each accounted for at least a tenth of Cranswick's revenue in the year. The largest took 23%, the next 16%, then 11% and 10%. Together they bought 60% of everything Cranswick sold.2 The company does not name them in that disclosure, but the names on any British high street are easy enough to guess at, and the point does not depend on which is which. A supplier that sends three-fifths of its output to four buyers lives with a permanent negotiation. Every efficiency it earns is a gain the customers would like to share. Every cost increase is a cost it has to persuade them to accept.
So the questions that drive this story are simple to state. What has allowed Cranswick to keep growing inside a customer structure that, on paper, gives the buyer most of the leverage? Can the margin gains of the past three years last, or did a favourable stretch of input costs and full factories flatter them? And will the largest investment programme in the company's history, with a record £163m of capital spending in the latest year, earn its keep?2
One boundary first. The figures in this story are those of Cranswick plc's consolidated group. There is no parent company above it, no private-equity sponsor and no controlling family; the listed company owns the operating businesses, and the parent's own accounts mostly record its investments in, and loans to, its subsidiaries.2 The Cranswick on the stock exchange and the Cranswick that runs the factories are the same economic animal, and what follows is the story of both.
To see why a feed business from the flatlands east of the Yorkshire Wolds ended up here, the story has to go back half a century.
 Subscribe on LinkedIn
II. From East Yorkshire Feed Mill to Food Producer
In 1975, a group of farmers in East Yorkshire set up a business to supply what their pigs ate.4 The countryside around Driffield and the village of Cranswick, which gave the company its name, was and is pig country: chalky, open, cold in winter, dotted with farm units feeding animals destined for bacon and pork. Animal feed is about as unglamorous as businesses come. It is bulk grain, milled and mixed, sold by the tonne to farmers who know the price of everything because their margins depend on it. But feed has one strategic property. It sits at the very start of the meat supply chain. A feed business knows how many animals are on the farms, what they cost to raise and where they go next.
Cranswick's founders and their successors drew the obvious conclusion slowly and then all at once: the money in pigs was not only in feeding them. It was in what happened after the farm gate, in the abattoir, the cutting room and the kitchen where pork became sausages, bacon and cooked meats with a brand or a supermarket label on the pack. Over the following decades the company moved down the chain. It bought pig processing capacity, added prepared foods, and in 1999 raised fresh equity through a placing and open offer to fund the acquisition of Pethick & Co, issuing about 3.5 million shares at 340p.5 The pattern of the next quarter-century was already visible: buy or build the step that gives more control over the pig, then sell what comes out of it to the supermarkets as something worth more than a carcass.
The company calls this "farm to fork," and describes itself as one of the first British producers to work that way.4 Every food company uses some version of the phrase. What makes it more than marketing at Cranswick is the physical footprint. The group now runs its own pig farms, mills feed, owns a pig-genetics business, rears chickens on its own farms and with independent growers, and processes both species in its own plants.3 It works with more than 900 British farmers, spent about £530m with them in the latest year and buys over 11,500 tonnes of British grain a week. It produces about 7% of all the chickens reared in the United Kingdom.4
The scale of the transformation over the past decade is easiest to hold as two pairs of numbers. In the year to March 2016, Cranswick had revenue of about £1.07bn and an average of 5,112 employees.6 Ten years later it had revenue of about £2.98bn and an average of 13,033 employees.2 The company says that, measured at a point in time rather than averaged through the year, it now has more than 16,500 colleagues.4 Revenue almost tripled; the workforce grew about two and a half times. That is the shape of a business that grew mostly by doing more physical work, not by charging more for the same work.
The product range moved with it. A decade ago Cranswick was overwhelmingly a pork company, with fresh pork on one side and added-value pork products such as sausages, bacon and cooked meats on the other, plus a food-to-go sandwich arm and a gourmet business making things like olives and antipasti. Today it reports four broad categories of roughly comparable weight. Convenience products account for about 35% of revenue, fresh pork about 23%, gourmet products about 20% and poultry about 20%.2 Pet food, the newest arm, is small but growing fast. The move into chicken is the single largest change in the mix, and it is the subject of the next chapter.
The long-run growth rate is impressive: revenue compounded at about 11.4% a year between FY2016 and FY2026.26 But the more recent rates are lower. Over the five years to FY2026, revenue grew about 9.5% a year, and over the last three about 8.7%.2 Some of that slowdown is arithmetic, since the bigger a company gets the harder each percentage point becomes, and some of the earlier period was flattered by food-price inflation and by acquisitions that added whole businesses at once. The point for an investor is that scale alone does not answer whether the engine is still accelerating. The ten-year number describes what happened. It does not promise what comes next.
Running through all of this is one man. Adam Couch joined Cranswick's fresh pork business in 1991, was promoted to the board in 2003 as managing director of fresh pork, became chief operating officer in 2011 and chief executive in 2012.7 Between 2005 and 2013 he also sat on the committee of the British Pig Executive, the industry body.7 He is not a founder, and the company's culture does not depend on founder mythology. It depends on someone who spent two decades learning the pork supply chain from the inside before he ran it. When Couch describes Cranswick's strategy, he describes it in the language of a processor: capacity, utilisation, automation, supply security. That vocabulary is the strategy.
The farm-to-fork claim is the proposition this story will test. Integration can make supply more secure, give the company better information about costs and quality, and let it capture margin at more than one step. It also has costs. It ties up capital in farms, mills, livestock and plants. It exposes the company to animal disease and commodity swings that a pure processor could pass on to someone else. And it demands relentless coordination, because a chicken that is ready for slaughter cannot wait for a processing line that is down for repairs. The question is whether the benefits outweigh those burdens, and the clearest test case arrived in the spring of 2016.
III. The 2016 Poultry Bet
In April 2016, Cranswick did two things within a few months of each other that, taken together, said a great deal about where Couch wanted to take the company. On 8 April it completed the acquisition of Crown Chicken, an integrated poultry producer in East Anglia.8 On 23 July it sold its sandwich business to Greencore, the Irish food-to-go specialist.8 One move pushed Cranswick deeper into raw protein and the supply chain behind it. The other walked away from a business that sat at the far end of the food chain, assembling ready-made lunches from other people's ingredients. The choice was not obvious at the time. Food-to-go was one of the fastest-growing corners of British grocery. Cranswick chose chicken.
Crown was not a single factory. It bred, reared and processed fresh chicken and ran what Cranswick called a well-invested and efficient feed-milling operation.8 In other words, it was a miniature version of the farm-to-fork model Cranswick had built in pork, transplanted into a protein that British consumers were eating more of every year. In the calendar year before the deal, Crown had revenue of £83.8m and adjusted EBITDA of £6.6m. Cranswick paid net cash of £39.4m for it, and the management team stayed with the business.8
Work the arithmetic plainly. Cranswick paid about six times Crown's EBITDA. EBITDA, earnings before interest, tax, depreciation and amortisation, is a rough measure of the cash a business throws off before it pays for its machinery and its financing. Today, the stock market values Cranswick itself at about 9.1 times EBITDA.2 It is tempting to conclude that Cranswick bought a business at six times and folded it into one valued at nine, but that comparison needs care. The two numbers are a decade apart, the interest-rate environment was different, Crown was smaller and riskier than the group is now, and an acquisition multiple measures what a buyer paid for control, not what minority shareholders pay for a slice. The honest reading is narrower: Crown was bought at a disclosed and unremarkable price for a business that turned out to be the seed of a category now worth about a fifth of group revenue.
Crown also showed the growth that came with buying rather than building. In FY2017, total group revenue rose 22.5%, but like-for-like revenue, excluding Crown and a Northern Irish pork business bought later that year, grew 12.7%.8 Including Crown, Cranswick's poultry sales rose 181% that year.8 The like-for-like figure itself was strong, which matters, because it means the acquisition was layered on top of a core business that was already growing on its own.
The Northern Irish deal was the other half of that year's buying. In November 2016 Cranswick acquired Dunbia's pork processing site at Ballymena in County Antrim, a business with £72.4m of revenue, for initial net cash of £16.7m plus up to £1.25m of contingent consideration.8 That was pork, and it fitted the old pattern of adding processing capacity close to a dependable pig supply. Crown was the new pattern.
The sale of the sandwich business deserves equal attention, because walking away is harder than buying. Cranswick received £15.7m in net cash consideration for a unit that had generated £54m of revenue in the year to March 2016.8 Greencore described its purchase as a bolt-on acquisition worth up to £15m in UK food-to-go.[^9] The sale came after Cranswick had already recorded an impairment of goodwill in the business, an admission that an earlier decision had not worked out as planned.6 At the time, Cranswick said developing food-to-go across its core product ranges would remain part of its future growth.8 In practice, the division went to a buyer for whom sandwiches were the core business, not a sideline. That is a lesson in buyer fit as much as in price: a sandwich business is worth more inside a company that makes hundreds of millions of sandwiches than inside one that is trying to become a vertically integrated protein producer.
Cranswick kept buying after 2016, and the later bolt-ons need the same discipline in judging them. In January 2022 it acquired Grove Pet Foods, a dry pet-food producer, for an initial consideration of £32.9m.910 Within months a legacy private-label customer of Grove decided to leave, and Cranswick recorded a £3.0m impairment of the customer-relationship intangible it had booked on acquisition.10 The pet-food business then represented about 1% of group revenue.10 In group terms the write-down was small. As a diagnostic, it was revealing: the asset Cranswick had paid for included a customer relationship, and that relationship walked out of the door shortly after the deal closed. Either the diligence did not identify the risk, or it identified it and the price did not reflect it. The company has since built pet food into a fast-growing category, with sales up almost 30% in FY2026 and a sole-supply deal for Pets at Home's dry food.3 That recovery is real. So was the original miss.
The most recent deals are harder to judge. In May 2025 Cranswick bought Blakemans, a maker of raw and cooked sausages for food service and manufacturing customers, with a site in Newcastle-under-Lyme, Staffordshire, and 290 employees.11 The consideration, around £38m, was recorded in the annual report, but Cranswick did not publish Blakemans' revenue or profit at the time of the deal, so an entry multiple cannot be calculated with any confidence.211 Management told investors that food-service sales from the business rose 35% as it was brought into the group, that procurement savings were already flowing and that Blakemans had won its first frozen retail listing.3 JSR Genetics, the pig-breeding business bought shortly before, was described by Couch as "the leader in the marketplace by quite some distance" and said to be performing ahead of expectations.3 Those are management claims. They may well be accurate, but they are not yet visible as separate numbers in the accounts. A fair verdict is that these deals have not been shown to be either bargains or overpayments.
Taken together, the deal record since 2016 is legible rather than spectacular. Crown was the material, strategic bet, bought at a sensible price and turned into a large business. The sandwich sale showed a willingness to exit. Grove showed that a growing category does not protect a buyer from a customer leaving. The newest acquisitions are still being absorbed. What none of this establishes is that Cranswick's returns come from clever deal-making. If the company earns a superior return, the evidence points elsewhere, to how it runs what it owns and how it sells to the people who buy it. And that brings the story to the supermarkets.
IV. Retailers, Recipes and the Price of a Listing
Picture a pig in a shed in East Yorkshire, bred from a line that JSR Genetics developed, eating feed milled by Cranswick from British grain. A few months later it arrives at the company's processing site in Hull. Within hours it has been turned into dozens of products: loins and chops for the fresh pork counter, shoulders that will become sausages, bellies destined for premium streaky bacon, trimmings that end up in cooked meats. Some of those products are packed with a supermarket's own label in Cranswick's own factory, scheduled to the hour against orders that arrived the day before. By the end of the week, a shopper in Leeds or Bristol picks up a pack of sausages and has no idea that the name on the label is not the name of the company that made them.
That chain, from livestock and feed, through processing, product development and packaging, to the retailer, food-service operator or manufacturer that buys the finished product, is the entire business model.2 Cranswick earns its revenue by selling fresh and value-added food and pet products, and the drivers are volume, product mix, retailer listings and seasonal demand.2 Christmas, with its pigs in blankets and gammon joints, is the peak of the year. A barbecue summer helps sausages and burgers. A cold, wet one does not.
What customers buy is food they buy again and again, which is attractive. The shopper who picks up bacon this week will likely want bacon next week. But repeat purchasing is not the same thing as recurring revenue. Cranswick does not publish a measure of what share of its revenue is contracted, recurring or committed, and its supply relationships are not subscriptions.2 A supermarket can move a product line to another supplier at a range review. That possibility is the price of a listing.
The mix tells you where Cranswick's bargaining position is strongest and weakest. About 79% of revenue comes from retail customers, with the rest from food service, manufacturing and export.2 Across product categories, convenience foods are the largest, followed by fresh pork, then gourmet and poultry at roughly a fifth each.2 It would be easy to assume that the branded-feeling, added-value products such as gourmet sausages earn fatter margins than fresh pork, and they may. But Cranswick reports these as sales categories, not as profit segments, so outsiders cannot see which category earns what. Anyone who tells you precisely how much more Cranswick makes on a premium sausage than on a pork loin is guessing.
The concentration figure from the opening scene is where the bargaining tension becomes concrete. Four customers took 60% of revenue, and the shares, 23%, 16%, 11% and 10%, were identical to those of the year before.212 That stability cuts two ways. It suggests that none of the big four relationships wobbled during a year of fast growth, which is a quiet sign of good execution. It also means that growth did not reduce the dependency. The largest customer alone buys almost a quarter of everything Cranswick makes. Losing a significant part of that business would be an event, not an inconvenience.
Cranswick's answer to that vulnerability is long-term agreements, and here the recent record is genuinely notable. The company has signed a ten-year sole-supply partnership with Sainsbury's covering fresh pork, sausages, premium bacon and cooked meats, and by the FY2026 results that volume had been onboarded.123 Morrisons agreed a ten-year deal covering Cranswick's Eye poultry site and two value-added sites in Hull. Pets at Home moved to Cranswick for sole supply of its dry pet food, adding to a ten-year partnership. And a large ready-to-eat chicken order from what management called the UK's largest retailer was due to start in the autumn of 2026.3
Ten-year agreements are unusual in British food supply, where relationships have historically been governed by annual negotiations and range reviews. They are evidence that retailers value something in Cranswick that they are willing to lock in. But the company does not disclose the minimum volumes, pricing mechanisms or termination rights in those agreements, nor what share of revenue sits under long-term contracts.212 A ten-year deal with flexible volumes is a commitment to talk to each other, not a guarantee of throughput. The honest reading is that these agreements support continuity, and that they would be worth more to a shareholder if their terms were visible.
There was one other shift in the year's customer picture worth noticing. Management's own breakdown of the grocery market showed that Sainsbury's, Tesco and Lidl grew fastest among the large retailers, with Lidl up about 13%, while Morrisons grew more slowly than the market and Asda's sales shrank.3 A supplier is tied to the fortunes of its customers. Cranswick's portfolio of relationships leaned toward the retailers that were winning, which helped volume. If the winners change, so will Cranswick's growth.
Not every sale ends on a British shelf. Cranswick exports fresh pork, including to the United States and China, where cuts that British shoppers rarely buy can command a better price, and it buys olives, charcuterie and some fresh pork cuts in euros.2 Export sales fell about 1% in FY2026 even as retail grew about 9%, a reminder that the overseas business is a way to sell the whole pig rather than a growth engine in its own right.3 The currency exposure is managed with forward contracts up to a year ahead, and the net foreign-exchange charge in the income statement was about £0.5m in the year, small enough to leave the core economics untouched.2 What export does reveal is the logic of a pig processor. Every animal yields a fixed set of parts, and the art is to find the best buyer for each of them, at home or abroad, so that nothing is sold for less than it could be worth.
The pricing story of FY2026 is subtle, and it matters for the moat question. Lower input costs during the year were passed through to customers as modest price deflation, so prices fell slightly, and the 8.3% growth in UK food volumes more than offset that effect.2 At the same time, cost increases that Cranswick could not avoid, such as the higher National Living Wage and employer National Insurance contributions, were passed on through what management described as open-book pricing mechanisms with key customers.3 An open-book arrangement is exactly what it sounds like: the supplier shows the customer its costs, and the price moves with them. It protects the supplier's margin per kilo against cost shocks. It also caps it. A supplier that shows its books to the buyer is not setting prices; it is agreeing a fair return on its costs. That supports a volume-led account of FY2026, not a claim that Cranswick controls its own prices.
The contrast with the year before is useful. In FY2025, Cranswick's reported revenue growth slowed to under 5%, partly because the prior year had contained a fifty-third trading week, which flattered the comparison against it.1312 Then, as now, management framed its pricing around the pass-through of input costs to customers, with volume, efficiency and mix as the levers it controls.123 The consistency of that narrative across two years is a mark in management's favour. It also defines the limits of the claim. In its recent results, the company has not argued that it can raise prices ahead of its costs.
So does Cranswick have a moat in its customer relationships? Test it once, properly. The case for is that becoming a supplier to a British supermarket is hard: it requires food-safety accreditation, reliable delivery seven days a week, product development teams that can create a new premium sausage for the Christmas range, and the scale to supply hundreds of stores at once. Integration adds supply security that a processor buying pigs on the open market cannot match. The long-term agreements suggest customers value all of that. The case against is that the public evidence for switching costs, market-share gains by category, customer-level retention and price realisation is thin. Cranswick does not disclose which customer is which, how its share of each customer's category has moved, or what margins it earns from each relationship.
The Grove episode from 2022 belongs in this conversation, but in proportion. One legacy pet-food customer exiting after an acquisition, triggering a small impairment, shows that customer risk can turn into a write-down. It is not evidence that the core supermarket relationships are fragile, and the big four shares have been stable. The verdict on the customer moat is that it is real but narrow. Cranswick has earned preferred-supplier status with several powerful buyers, but that status gives it access and volume, not pricing power. Its margins depend on what happens inside its own factories, and that is where the next chapter goes.
V. The Margin Turn—and What It Depends On
Rewind to the year to March 2023. British food producers were living through the sharpest cost surge in a generation: energy bills that had multiplied, feed grain priced off a world market rattled by war in Ukraine, wage rates climbing as factories competed for workers. Cranswick did not escape it. Its operating margin, as reported, fell to about 5.6%, the lowest point in the past decade.2 In the half-year to September 2022, it dipped to about 5.5%.2 The business kept growing its sales, because food inflation lifted prices, but more of every pound of revenue went straight out of the door again to pay suppliers.
What happened next is the most important operating story of the past three years. The margin recovered to about 6.4% in FY2024, 7.0% in FY2025 and 7.9% in FY2026.2 Half by half, the improvement was steady rather than sudden: management pointed out that margins improved for five consecutive half-years, with the second half of FY2026 reaching an adjusted operating margin of about 8.2% and an adjusted gross margin of about 16.2%.3 Across the full year, the adjusted gross margin rose 46 basis points, because the adjusted cost of making the food grew more slowly than the revenue it generated.2
The context makes the improvement more striking. At its Capital Markets Day in March 2025, timed to Cranswick's fiftieth anniversary, management raised its medium-term target for the adjusted operating margin from "more than 6%" to "about 7.5%," and lifted its return-on-capital ambition from the mid-teens to the upper teens.13 Couch described the upgrade as reflecting "the significant strategic progress" the company had made.13 Fourteen months later, the company reported a margin above the new target. On the results call, chief financial officer Mark Bottomley said the group had delivered ahead of all its medium-term targets.3 Setting a target and then beating it within a year is a credibility point in management's favour. It also raises a sharper question: if the target was 7.5%, does management itself regard 7.9% as a level to defend, or as a high-water mark?
Management's explanation of the improvement has four parts, repeated consistently across the interim and full-year results. The first is the integrated poultry chain, which grew out of the Crown acquisition and now runs from breeding flocks through to processing. The second is automation, with investment in robots and automated cold stores replacing manual labour. The third is strong capacity utilisation, meaning the factories ran close to full. The fourth is cost control.142 Each is plausible, and the volume figures support the third directly: a plant that processes 8% more food with roughly the same fixed costs spreads those costs over more output.
There is also a small, useful test of management's word inside the year. At the interim results in November 2025, with the first-half adjusted operating margin at about 7.7%, management said it expected to maintain that margin in the second half.14 It did better: the second-half figure came in at about 8.2%.3 Modest guidance, modestly beaten, is the pattern of a team that prefers to under-promise. It is not proof of a durable advantage, but it does mean the margin claims in Cranswick's presentations have recently been conservative rather than aspirational.
Before going further, one technical distinction matters. Cranswick reports an "adjusted" operating margin that excludes the accounting revaluation of its pigs and other livestock, acquisition-related amortisation and impairments.13 Its reported operating margin, the one used throughout this story's long-run comparisons, includes them. In FY2026 the two figures happen to be close, both near 7.9%. In other years they diverge, sometimes by a lot, because the value of living pigs moves with the pig price. The two should not be spliced into a single history. A useful rule of thumb is to use the company's adjusted number to judge management against its own targets, and the reported number to compare across a decade.
That pig revaluation is also the main accounting judgment in the accounts, and worth one aside. Under the international accounting standard for agriculture, Cranswick has to carry its living pigs at fair value, about £93.5m at the year end, of which about £66m was valued using inputs that cannot be observed directly in a market.2 The auditor, PwC, gave an unmodified opinion and found the valuation consistent with its evidence, but flagged it as a key area of audit attention.2 This is not a red flag; it is a reminder that a slice of the balance sheet is an estimate of what pigs are worth before they are pigs on a plate.
Now the consumer context. Pork and chicken are the affordable proteins of the British diet, and when households trade down from beef or lamb, or eat out less, they tend to buy more of what Cranswick makes. That helps volume. But the company's own reports make clear that lower input costs in FY2026 flowed into lower selling prices.2 Affordability is a tailwind for how much Cranswick sells, not for what it charges. The margin gain came from making more food more efficiently, not from consumers paying more.
The vulnerabilities flow directly from the mechanism. Concentrated buyers, discussed in the customer chapter, can press for a share of every efficiency gain when contracts come up. Feed, livestock, energy and labour costs drive production economics, and as FY2027 began, management was already describing a mixed picture: UK pig prices falling as supply ran ahead of demand, feed prices rising after conflict in the Middle East, packaging costs up and fertiliser costs elevated, all being managed with retailers week by week.3 Disease is the risk that does not show up in any forecast. An outbreak of avian influenza on a poultry farm, or of a swine disease in a pig herd, can force culls, close export markets and disrupt the chain that integration is supposed to secure. Animal-welfare rules and environmental regulation can raise the cost of rearing livestock. And any disruption to processing capacity, from a fire to a mechanical failure, idles birds and pigs that are on a fixed biological clock.
Which brings the question into focus. Is the recent margin expansion repeatable efficiency, or a favourable cycle of full factories and benign input costs? The honest answer is that it is probably some of each, and the evidence does not yet separate them. The case for repeatability is that the gains were steady across five half-years, that they coincided with specific investments in automation and poultry, and that management has explained them consistently. The case for caution is that FY2026 combined unusually strong volume growth with falling input costs, two conditions that will not always coincide, and that the half-year margin peaks coincided with very high utilisation. A margin that rises when factories are full can fall when new capacity opens and runs half-empty for a while.
The verdict is that the margin recovery is real and its mechanism is credible, but sustained expansion above today's level remains unproven until it survives a less favourable mix of input costs and volumes. The figure to watch is not revenue growth but the like-for-like operating margin through the next input-cost cycle. And the biggest single threat to that margin, paradoxically, is the investment programme designed to protect it.
VI. The £160 Million Question
In Hull, on the banks of the Humber, Cranswick has been rebuilding one of the largest pork processing operations in Britain while it runs. The company describes a £100m multi-phase expansion of the site, with a fully automated on-site cold store already operating.3 Far to the south, at Eye in East Anglia, the poultry plant that grew out of the Crown deal was originally designed to process about a million birds a week. It now peaks at about 1.6 million. Cranswick has committed a further £56m to a second processing line that will lift capacity by about a quarter, to more than two million birds a week.3 In Worsley, a £27m facility for houmous and dips has been fitted out, and a £30m expansion of value-added poultry has been completed.3
Add the farms, mills and pet-food plants, and the bill for the year to March 2026 came to a record £163.4m of capital expenditure, including about £40m in farming and about £123m in operating assets.3 That is about 5.5% of revenue, up from about 3.2% a decade earlier.26 The company says it has invested more than £850m in its sites since FY2018 and reinvests about half of its EBITDA each year.4 This is not a business harvesting a mature franchise. It is a business spending heavily on the belief that more capacity will fill.
Start with the good news, because there is a lot of it. Over the twelve years from FY2015 to FY2026, Cranswick reported cumulative net profit of about £1.1bn and generated about £1.7bn of cash from operations, roughly 159% of profit.2 That gap is not a mystery. Operating cash adds back the depreciation of factories and the amortisation of acquired intangibles, which reduce accounting profit but cost no cash in the year they are charged. In FY2026 alone, those add-backs included about £77m of depreciation on owned assets, about £22m on leased assets and about £12m of share-based payments.2 Meanwhile inventory, receivables and payables together absorbed cash as the business grew. A food producer that converts profit into cash this reliably is not hiding anything in its earnings.
But cash generated is not cash left over. In FY2026, Cranswick generated roughly £270m of cash from operations and spent about £163m of it on capital expenditure, leaving free cash flow after all investment of about £100m.2 The company's own headline free cash flow figure, £268.4m, is much larger, because Cranswick defines free cash flow before growth capital expenditure and some other items.313 Neither number is wrong. They answer different questions. The company's measure asks how much cash the existing business throws off if it stops expanding. The stricter measure asks how much cash is left after the expansion the company has chosen. For a shareholder deciding what the business is worth today, the second is the more sobering number, and it is the one that has been lumpy for a decade, falling below £15m in both FY2019 and FY2020 when an earlier investment wave peaked.2
Follow the money through the year. Operating cash came in; capex, acquisitions, dividends of about £55m, lease payments and £22.1m of share purchases by the Employee Benefit Trust to satisfy staff awards went out.24 The result is that net cash barely moved. Cranswick ended FY2026 with £12.5m of cash, almost exactly where it was at the end of FY2014, when it held about £12.2m.2 Twelve years of growth, and the cash pile is the same size. That is not a warning sign. It is a choice: everything the business generated has been redeployed into plants, acquisitions and dividends.
The swings within a year show how quickly that choice moves the balance sheet. By the half-year in September 2025, after the Blakemans and JSR purchases, a record first-half capital programme of about £89m and a seasonal build in working capital ahead of Christmas, net debt excluding leases had risen by about £126m, and leverage including leases stood at about 0.9 times EBITDA.14 By March, with the Christmas trading cash collected, net debt excluding leases stood at about £65m.2 A business this seasonal can look stretched in the autumn and comfortable in the spring, and an investor reading a single balance sheet date should know which season it is.
Management's own discipline here is framed by two targets set at the Capital Markets Day: leverage below two times EBITDA including leases, and free cash conversion of about 90%, measured on a definition that excludes growth investment.13 By the company's own reckoning, it sits comfortably inside both, with leverage excluding leases at about 0.2 times at the year end.3 The targets are sensible. They are also generous enough that the company could take on considerably more debt, or a larger acquisition, without breaching them, which is precisely why shareholders should watch what management chooses to do with that headroom.
The commitment does not end with the latest year. At the year end Cranswick had £56.9m of contracted capital commitments, money already promised to contractors and equipment suppliers.2 Add the second Eye line and the remaining Hull phases, and FY2027 looks like another heavy investment year. Management has also said it is searching for a second poultry processing site.3
The dividend sits within that picture. Over the twelve years to FY2026, Cranswick paid out a median of about 32% of its net profit as dividends, with about 35% in FY2026, and it has increased the dividend for thirty-six consecutive years.23 Cumulatively, dividends consumed about 48% of the free cash flow the business generated after investment, with the remainder funding acquisitions.2 The full-year dividend rose about 11% to 112.5p, covered 2.7 times by adjusted earnings against a policy minimum of 2.5 times.3 That is a progressive dividend, steadily growing, but it is not the main claim on cash. Growth investment comes first.
Now the returns, which is where the definitions start to matter. The company reports an adjusted return on capital employed of 18.5% in FY2026, the third consecutive year at that level.3 It calculates that figure as adjusted operating profit divided by the average of opening and closing net assets, net debt, pension surplus and deferred tax.13 A stricter calculation, operating profit after tax divided by equity plus debt less cash, gives a return on invested capital of about 13.0% in FY2026, below the roughly 14% of FY2016 and close to the five-year-ago level.2 These numbers do not contradict each other. The company's measure is pre-tax and uses adjusted profit; the stricter one is post-tax and uses reported profit. The useful signal is the direction of travel. On the stricter measure, a decade of heavy investment has roughly held returns steady rather than lifting them. Asset turnover, the amount of revenue generated per pound of total assets, has drifted down from about 2.0 a decade ago to about 1.7.2 Each new pound of plant is producing slightly less revenue than the old ones did, at least so far.
That is not damning. Capacity built today earns its return over a decade, and plants under construction or ramping up depress asset turnover until they fill. But it frames the question correctly. The balance sheet is strong enough to fund this, as Couch said on the results call: "We have the balance sheet and the management resources available to deliver this project."3 Whether the project earns its keep is a different matter. The proof will come from capacity utilisation and incremental returns at Hull and Eye through FY2028, and from watching net debt both excluding and including leases as the programme completes.
Which raises a governance question. When a company commits this much capital, shareholders care deeply about who decides, and how they are paid for it.
VII. Adam Couch's Compounding Test
On 27 July 2026, Cranswick's shareholders gathered for the annual general meeting, and the poll results told two stories at once. The remuneration report, which sets out how much the directors were paid and why, passed with only 4.50% of votes against.15 A year earlier, the same vote had drawn 30.79% opposition, a level that in British corporate life counts as a public rebuke.16 That was the good news. The bad news, at least for the board, was that 20.75% of votes were cast against the re-election of the chair, Tim Smith.15 All resolutions passed, and the board said it would engage with the shareholders who opposed the chair and report back within six months.15
To understand those votes, start with the man at the centre of the pay debate. Adam Couch's total remuneration in FY2026 was £5.326m, including a £1.949m annual bonus and £2.263m from the long-term incentive plan.2 That compares with about £2.99m in FY2017 and in FY2022, about £2.24m in FY2023 and about £4.72m in FY2025.2 The figures move with the bonus and the vesting of long-term awards, which in turn move with profit and returns: pay fell in the margin trough of FY2023 and rose as the recovery came through. On that pattern alone, pay has tracked performance in both directions.
Couch's credibility rests on what happened during his tenure, not on any founding myth. He was appointed chief executive in 2012, so the whole of the decade analysed here is his decade.7 Over that period revenue nearly tripled, the business moved into poultry and pet food, the sandwich arm was sold, and returns on the company's own measure moved into the upper teens. Couch is the archetype of the operating chief executive: a pork man who rose through the processing business, sat on the pig industry's executive committee and talks about birds per week and cold-store automation rather than visions and platforms.73 His style on results calls is direct and factual; he leads with volume and capacity and leaves the finance to his chief financial officer.
At the Capital Markets Day in March 2025, Couch listed the company's strengths as "industry leading investment, a clearly defined strategy, broadening product portfolio and unrivalled management team."13 The last phrase is the kind of claim that invites testing rather than applause. The evidence for it is a decade of growth, margins recovered from the 2023 trough, targets raised and then beaten, and an acquisition record without a large write-off. The evidence against it is thinner but real: returns on the stricter post-tax measure have not risen over the decade, working capital has lengthened, and one acquisition lost a customer almost as soon as it was bought. "Unrivalled" is an absolute word. What the record supports is a capable, consistent operating team with a long tenure, which in a business where execution is the product is no small thing.
The pay question for an investor is whether the incentives reward durable per-share returns or scale for its own sake. The annual report sets out the performance measures, weightings and vesting conditions behind the bonus and the long-term plan, and those details are where a shareholder should look before forming a view.2 In a capital-hungry business, the more weight a scheme puts on return on capital and cash, the more it penalises management for building plants that do not earn their keep. The less comfortable observation is that a pay package that rises as the business grows inevitably rewards scale to some extent, because a bigger business generates bigger absolute profits even at the same return.
The shareholder response in 2025 was a clear signal that some investors thought the balance was wrong. After that vote, the board engaged with shareholders and changed its pay policy, and opposition fell to 4.50% the following year.1516 That is the system working as designed: shareholders objected, the board listened, and it changed course. The chair vote is a separate matter, and should not be confused with the pay revolt. Shareholders who vote against a chair are usually expressing concern about board composition, tenure, independence or the quality of oversight. The board's promise to report back within six months, which falls due around January 2027, is the next test. The board consists of the chair, four executive directors and four non-executive directors, all of whom the company states are independent other than the chair.2 Four executive directors out of nine is a relatively heavy executive presence by British standards, and could be one source of the concern.
The capital-allocation record belongs in the same judgment. Crown and the later bolt-ons expanded the core in ways that make strategic sense. The sandwich business was sold when it no longer fitted. Grove's customer loss produced a modest impairment. No large, value-destroying acquisition appears in the record of the past decade. That is a mixed but legible record, and it supports cautious confidence in management's judgment rather than proof of perfect execution.
Ownership matters for accountability, and Cranswick's is dispersed. There is no controlling shareholder.2 At the FY2026 year end, the largest notified holders were BlackRock at about 9.6%, Schroders at about 5.5%, Vanguard at about 5.4%, JPMorgan at about 4.9% and Invesco at about 3.8%.17 A decade ago the register looked very different: Invesco Perpetual held almost a quarter of the shares, with Woodford Investment Management and Wellington also significant.6 The departure of those concentrated, active holders and their replacement by large index and institutional managers changes the nature of shareholder oversight. Index funds vote on governance but rarely push on strategy. These notifications are snapshots, not a stable register, but the direction is clear. Of the 2,139 holdings on the register, about 1,500 are private individuals holding a small fraction of the shares.18 Thousands of employees also participate in share plans, which aligns some of the workforce with shareholders.4
The verdict is that Couch has earned a reasonable degree of confidence through a decade of growth with a legible capital-allocation record, and that the board responded to pay dissent rather than ignoring it. The chair vote shows that a separate governance concern remains open. The next credibility checks are the board's report on that vote and FY2027 pay outcomes against profit, return on capital and shareholder returns. Behind all of it sits the question the market is now pricing.
VIII. Analysis & Bear vs. Bull Case
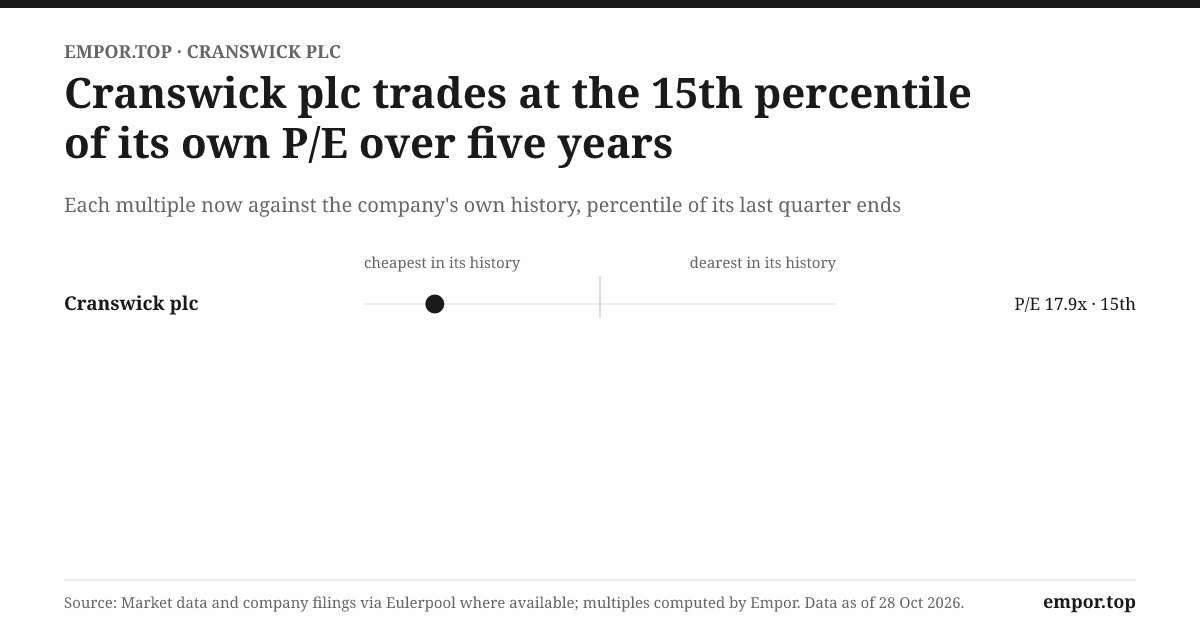
On 28 October 2026, the market valued Cranswick at about £2.8bn, and at about £3.1bn including its debt and leases.2 The shares traded at about 17.9 times trailing earnings, below the company's own five-year median of about 20.5 times.2 On cash-flow measures, the enterprise value was about 9.1 times EBITDA and about 13 times operating profit, and the free-cash-flow yield after all capital spending was about 3.6%.2 The question is whether those numbers price a protected franchise or a well-run processor whose returns depend on the next plant filling up.
Start with the industry. British food production is competitive and retailer-led. Cranswick's named competitors include large private processors such as ABP and 2 Sisters in meat and poultry, and Hilton Food Group in retail-focused protein packing. Hilton's revenue is of broadly comparable scale, but its business mix differs, centred on processing and packing protein for retail partners rather than on an integrated chain running from genetics and farms to the factory. The private competitors do not publish comparable market-share data, so there is no clean public league table of who supplies what share of each category.
Porter's framework, which looks at five forces shaping an industry's profitability, makes the pressures concrete. Buyer power is high, because four customers account for 60% of Cranswick's sales and can multi-source. Rivalry is real, from large processors and from retailers' own sourcing teams, which constantly benchmark suppliers. Supplier power is moderate: farmers and feed markets set input costs, though Cranswick's own farms and mills dampen this. Substitution between proteins is possible, as consumers shift between pork, chicken, beef and plant-based alternatives, though the affordable proteins have tended to benefit when budgets tighten. Barriers to entry are significant, because a new entrant would need facilities, food-safety accreditation, reliable supply and retailer approval, all of which take years and hundreds of millions of pounds. That combination describes an industry where incumbents with scale can earn steady returns, but where the buyer captures much of the surplus.
Hamilton Helmer's seven powers framework asks a sharper question: which durable advantage, if any, lets a company earn returns above its cost of capital for a long time? Scale economies are the clearest candidate. A processor running the largest, most automated plants spreads fixed costs over more volume, and Cranswick's margin gains through utilisation are a direct expression of that. Process power, the advantage of operational know-how that rivals cannot easily copy, is plausible in the integrated poultry chain and automation, though hard to prove from outside. Switching costs exist in a mild form, because retailers that move a product line to a new supplier face qualification costs and risk, and the ten-year agreements suggest customers see value in continuity. Counter-positioning, network effects, branding and cornered resources are weak or absent: most products are sold under supermarket labels, and no supply of pigs or chickens is exclusively Cranswick's. The public evidence on retention, share gains and price premiums is not sufficient to call this a cornered market. Cranswick's power, if it has one, is scale plus process, earned through execution.
Why might it keep winning? Reliable supply at scale, integrated poultry operations, product development, automation and the ability to move from raw protein into added-value products are all visible advantages. FY2026's volume, margin and poultry growth support the case, as does the willingness of several large retailers to sign decade-long agreements. The company does not disclose product-level profit or customer-level retention, so the advantages are inferred from aggregate performance rather than proved category by category.
Why might it not? Concentrated buyers can renegotiate, and open-book pricing means efficiency gains are partly shared with customers. Input-cost deflation is passed through, so revenue can fall even when volumes grow. Working capital has crept up: the cash conversion cycle, the number of days between paying for inputs and collecting cash from customers, has lengthened to about 53 days, with debtor days at about 48, compared with about 33 a decade ago.2 Trade receivables reached about £350m, though most were not yet due and only about £0.5m was more than sixty days overdue.2 That is not a sign of bad customers, but it is a sign that growth ties up more cash per pound of sales than it used to. And expansion can depress returns if new capacity is underused, which is the ever-present risk of an investment programme of this size.
The balance sheet is sound, but the headline understates the fixed commitments. Net debt excluding leases was about £65m at the year end, roughly £79m drawn on the revolving facility less £12.5m of cash.2 Including lease liabilities of about £176m, total net debt was about £241m, up about £68m on the year.23 The £360m revolving facility runs to July 2029 with a further £90m accordion option.2 Covenant headroom is wide, with interest cover above 50 times against a minimum of three and leverage below 0.2 times against a maximum of three, but those covenants exclude leases.2 There is no refinancing stress here. The point is that a facility-heavy business carries obligations, such as long-dated leases on factories and equipment, that the bank covenants ignore and that a shareholder should not.
The risk radar is specific. Livestock disease and biosecurity, food safety, labour and energy costs, customer concentration, execution on new capacity, and environmental or animal-welfare regulation can all affect volumes and margins. Artificial intelligence is more likely to improve forecasting, logistics and factory efficiency than to replace demand for sausages and chicken. It is not a central disruption thesis.
The bull case runs like this. Affordable proteins keep gaining volume as household budgets stay tight. Integration and automation defend the margin at or around today's level. The new Hull and Eye capacity fills quickly under long-term agreements. Bolt-on acquisitions add products and customers without diluting returns. In that world, Cranswick keeps compounding earnings for years, and a valuation below its own five-year average would look undemanding in hindsight.
The bear case runs the other way. Retailers capture the productivity gains at the next contract cycle. Input or labour costs rise faster than prices can follow. New plants run below capacity for longer than planned, dragging down returns. A customer loss or failed acquisition turns growth spending into impairments, as the Grove episode did on a small scale. In that world, the 18.5% return on capital proves to be a cyclical peak, and the market's willingness to pay nearly 18 times earnings fades.
Valuation context helps but does not settle the argument. Hilton Food Group, the closest listed comparator, traded at about 9.2 times EV/EBITDA and about 18.9 times earnings in a contemporaneous snapshot.19 Cranswick's multiples are almost identical, despite its different, more integrated model. Premier Foods, a branded grocery business with a different mix, traded at about 6.5 times EV/EBITDA in an August 2026 snapshot.20 These figures come from different periods and leverage profiles, so they are a rough reference, not a clean peer verdict. Cranswick's own P/E is below its five-year median, but it still asks investors to trust continued execution.
Three KPIs capture the story. The first is like-for-like volume growth, which was 8.3% in UK food in FY2026 and accelerating through the year.3 The second is the operating margin through input-cost cycles, which stood at 7.9% and has risen for three years.2 The third is the incremental return on capital as the Hull and Eye capacity ramps, the measure that will reveal whether the investment cycle creates value or merely size.
IX. Lessons from the Processing Line
A company that began by selling feed to East Yorkshire pig farmers now runs a system that reaches from genetics and grain to the chilled aisle of the weekly shop. Over ten years, revenue compounded at about 11.4% a year and the operating margin moved from about 6.2% to about 7.9%, while cash from operations ran well ahead of reported profit.2 Those are the numbers of a quiet compounder in one of the least glamorous industries in Britain. They also come with a set of lessons that belong to Cranswick and no one else.
The first comes from Crown. Cranswick did not buy a brand in 2016; it bought a chain of breeding farms, sheds, a feed mill and a processing plant that it could make bigger and better. A decade later, the plant that grew from that deal processes far more birds than it was built for, and chicken is a fifth of the group. A good acquisition is a supply chain you can improve, not a logo you can add.
The second comes from the sandwich sale. Food-to-go was growing, and Cranswick had already written down part of what it paid for the business. Selling it to Greencore, which made sandwiches as its core business, freed management to focus on protein. Strategy is also knowing what no longer belongs.
The third comes from Grove. Cranswick bought into a growing pet-food category and watched a customer walk out shortly afterwards, leaving a write-down behind. The category kept growing, and so did Cranswick's pet business, but the asset it had paid for was partly a relationship, and relationships are not owned. A growing category does not protect you from a customer leaving.
The fourth comes from the capex cycle. Every tonne of capacity in Hull or bird-line at Eye is a fixed cost that earns nothing until it is used. The margin gains of the past three years came largely from running factories close to full. In food, capacity only compounds when the line is full.
Each lesson ties back to the evidence. Growth has been persistent through the cycle, cash conversion has been strong across a decade, and the long-term agreements suggest retailers value Cranswick's reliability. But returns on the stricter measure have not risen with scale, and working capital has crept up. The wider lesson for founders and investors is that a low-margin, customer-controlled business can compound, but only if it treats every pound of capital as something to earn back, not as proof of ambition. Integration and execution can compound in an unglamorous business, but scale does not remove buyer power, and it does not excuse a new plant from earning its return.
X. Epilogue
Tonight, Cranswick enters the second half of its FY2027 with new capacity under construction, acquired businesses being absorbed and shareholders awaiting the board's promised response on the chair. The first half ended in September, and the interim results, which last year arrived in late November, will be the first real look at how the year is going.14 Management said in May that trading in the early part of FY2027 was in line with expectations and that demand remained robust.3
The first thing to watch is whether organic volume stays strong once the contribution from Blakemans and JSR is fully in the comparison base. FY2026's like-for-like growth of 6.8% was the cleanest read on the core business. If FY2027 holds anywhere near that level while the large ready-to-eat chicken order with the UK's largest retailer comes on stream, the volume story is intact. If it slows sharply, the question becomes whether FY2026 was a peak year rather than a new baseline.
The second is the margin. FY2026's adjusted margin of 7.9% came with falling input costs and full factories. FY2027 began with pig prices falling but feed, packaging and fertiliser costs rising.3 If the margin holds through that mix, the efficiency story gains credibility. If it slips back towards the 7.5% target, the market will learn how much of the gain was cyclical.
The third is the return on the new assets. The second Eye processing line is due to lift capacity to more than two million birds a week, though management gave slightly different timings for it, with Couch saying by the end of 2027 and Bottomley saying by summer 2027.3 The Hull expansion continues in phases. The test is whether these plants fill, and whether the return on capital holds near 18.5% on the company's measure as the new capital enters the base. Watch net debt including leases, not just the covenant measure.
The fourth is governance. The board's report on the 20.75% vote against the chair is due by about January 2027, and FY2027 pay outcomes will show whether the revised policy rewards returns and cash, not just growth. Results calls will show whether management offers concrete detail on acquisition integration, customer terms, working capital and capacity ramp-up, or retreats to generalities.
Each outcome maps onto the story's central questions. Strong volume, a stable margin and filling plants would suggest that Cranswick's integrated model is becoming a higher-return platform. Slowing volume, a slipping margin and underused capacity would suggest an expensive expansion cycle. The tension that remains is that the company is spending more than ever on the belief that its customers will keep buying, while those customers hold the power to decide the price.
XI. Outro
Go back to that feed business in East Yorkshire in 1975. A group of farmers decided that supplying what their pigs ate was a business worth building.4 Fifty years later, the company they started breeds the pigs, mills the feed, rears the chickens, processes both species and turns them into sausages, bacon, cooked meats, ready-to-eat chicken and pet food for the largest supermarkets in the country. It got there not by inventing a new product, but by taking responsibility for one more step of the chain at a time, and then running each step a little better than the last.
The defining tension of Cranswick is that it has built scale by moving closer to the source of food, but the customers at the end of that chain still hold the power. Its bet is that deeper integration can make a low-margin food business more dependable and more valuable, and that each new factory will earn its place on the processing line. The story so far says the bet has paid. The next factory will say whether it still does.
References
-
Preliminary Results — Cranswick plc via London Stock Exchange, 2026-05-19 ↩
-
Annual Report & Accounts 2026 — Cranswick plc, 2026-05-19 ↩↩↩↩↩↩↩↩↩↩↩↩↩↩↩↩↩↩↩↩↩↩↩↩↩↩↩↩↩↩↩↩↩↩↩↩↩↩↩↩↩↩↩↩↩↩↩↩↩↩↩↩↩↩↩↩↩↩↩
-
Cranswick H2/FY2026 Results Call Transcript — StockAnalysis, 2026-05-19 ↩↩↩↩↩↩↩↩↩↩↩↩↩↩↩↩↩↩↩↩↩↩↩↩↩↩↩↩↩↩↩↩↩↩↩
-
Cranswick Economic Report 2026 — Cranswick plc, 2026 ↩↩↩↩↩↩↩↩
-
Proposed Acquisition of Pethick & Co.; Placing and Open Offer — Cranswick plc via Investegate, 1999-09-06 ↩
-
Annual Report & Accounts 2016 — Cranswick plc, 2016-05-24 ↩↩↩↩↩
-
Acquisition of Dry Pet Food Producer — Cranswick plc, 2022-01-31 ↩
-
Interim Results — Cranswick plc via FCA National Storage Mechanism, 2022-11-22 ↩↩↩
-
Cranswick Announces Acquisition of Blakemans — Cranswick plc, 2025-05-27 ↩↩
-
Annual Report & Accounts 2025 — Cranswick plc, 2025-05-20 ↩↩↩↩↩
-
Capital Markets Day and Upgraded Medium Term Targets — Cranswick plc, 2025-03-20 ↩↩↩↩↩↩↩↩
-
Poll Result for 2026 Annual General Meeting — Cranswick plc via London South East, 2026-07-27 ↩↩↩↩
-
Poll Result for 2025 Annual General Meeting — Cranswick plc via Investegate, 2025-07-28 ↩↩
-
Hilton Food Group Financial Ratios — StockAnalysis, accessed 2026-10 ↩
-
Premier Foods EV/EBITDA Multiples — ValueInvesting.io, 2026-08-25 ↩
 LinkedIn
 WhatsApp
 Reddit
 Hacker News
 Email
 Kindle
 RSS Feed
 Spotify
 Apple Podcasts
 Amazon Music
 Audible
 YouTube