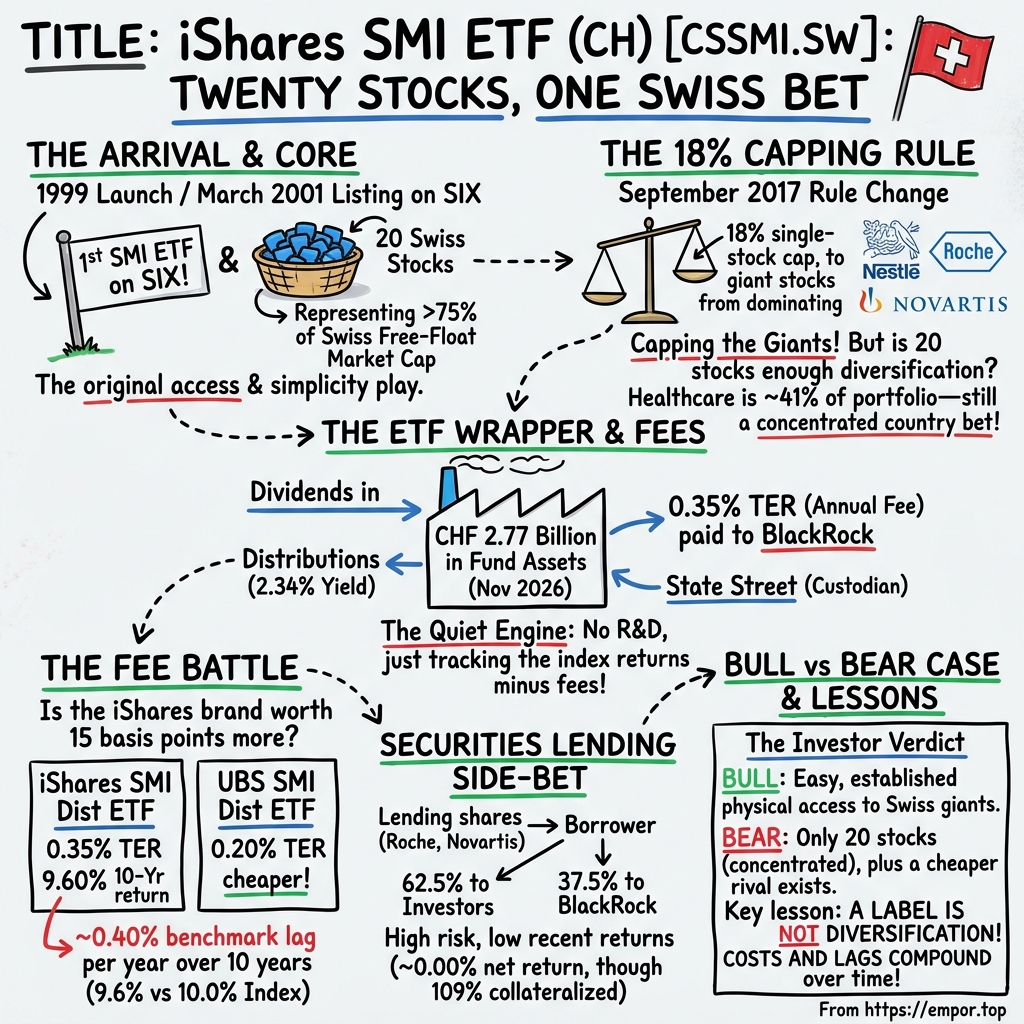
iShares SMI ETF (CH): Twenty Stocks, One Swiss Bet
I. The Day Switzerland Capped Its Giants
On the morning of 4 May 2017, the Executive Board of SIX Swiss Exchange published a short media release with a dry title and a large consequence. After a market consultation, and on the recommendation of its Index Commission, the exchange said it would cap the weight of the largest shares in the Swiss Market Index at 18%.1 The change took effect on 18 September 2017, phased in under transitional rules, and at the same time SIX launched a twin index with the same members and no cap at all, for the users who still wanted the market exactly as it was.1
It sounds like housekeeping. It was really an answer to a question most investors never think to ask: how much of a country should its biggest companies be allowed to represent?
Switzerland is an unusual stock market. A small, rich country of around nine million people hosts some of the largest companies on Earth, and three of them, Nestlé, Novartis and Roche, are so large that in a market-capitalisation index they had come to behave like a gravitational field. In the years before the rule change, the two largest SMI members had, on several occasions, both carried more than 20% of the index at the same moment.2 An investor who bought "the Swiss market" through the SMI was buying, to a striking degree, a bet on chocolate, cereal, coffee and two pharmaceutical pipelines.
SIX phased in the cap in two steps, on 18 September and 18 December 2017, and from then on the three giants sat at the 18% ceiling.3 That ceiling is still the rule today: at each quarterly review, any SMI member whose free-float market value would exceed 18% of the index is trimmed back to it.4
This story is about a fund that lives entirely downstream of decisions like that one. The iShares SMI ETF (CH), which trades on SIX under the ticker CSSMI, does one thing. It holds the 20 companies in the SMI, in the weights the index rulebook sets, and tries to hand its investors the index's return minus a fee.4 On 12 November 2026 it managed about CHF2.77 billion for those investors, and its net asset value per unit closed at CHF157.16, the top of its 52-week range.4
So the first question is not whether the fund is good at its job. It is what the job really is. Does a unit of CSSMI give an investor broad Swiss exposure, or is it a convenient way to own a concentrated handful of very large companies? The 2017 rule change is where that question becomes sharp, because it shows that "the Swiss market" in this product is not a natural fact. It is the output of a methodology, written and revised by an exchange, with trade-offs that somebody had to choose.
Two further questions follow from the first, and they will carry the rest of the episode. A direct rival from UBS tracks the very same index and charges less, so does this fund earn its higher fee? And the fund lends out some of its shares for a fee, so does that side business add anything meaningful for the people who own it?
Before going further, a boundary needs to be drawn, because this is not a company in the usual sense. CSSMI is a Swiss contractual fund, a sub-fund of the iShares ETF (CH) umbrella, supervised by FINMA, Switzerland's financial-market regulator, and managed by BlackRock Asset Management Schweiz AG, with State Street Bank International GmbH, Zurich Branch, as custodian.5 Its legal backbone is a prospectus with an integrated fund contract, not articles of incorporation.6
That boundary changes the vocabulary. The fund has no sales, no factories, no research labs and no chief executive of its own. When this story talks about growth, it means the growth of fund assets and of investor returns, not revenue. When it talks about management, it means the people and processes that run the wrapper, not the leaders of Roche or UBS. The companies inside the fund are the engine; the fund is the transmission. And a transmission is judged by how much power it loses on the way through.
That makes the history of this particular transmission worth telling, because it was not always obvious that Swiss investors needed one at all.
 Subscribe on LinkedIn
II. The First SMI ETF Arrives on the Exchange
Rewind to the turn of the millennium. The SMI itself was already a teenager. It had been launched on 30 June 1988 at a starting value of 1,500 points, and within months there were options on it, then futures.3 Professional traders could bet on the index easily. Ordinary investors could not easily own it.
If a Zurich saver in 1999 wanted the SMI, the practical choices were unappealing. One route was to buy every constituent separately, in the right proportions, and then keep rebalancing as weights drifted and members changed. Another was a conventional index fund, bought and sold once a day at a price struck after the market closed. Neither felt like owning a share.
The building blocks of an answer arrived in stages. On 6 October 1999, the fund that is now CSSMI was launched as an index fund on the SMI.3 In September 2000, SIX Swiss Exchange opened a dedicated ETF segment, one of the first in Europe.7 And on 15 March 2001, that index fund became the first exchange-traded fund on the SMI, listed on the Swiss exchange.3
The bargain was simple and, at the time, quietly radical. One listed unit gave its holder a slice of a whole basket. It traded through the day like a share of Nestlé, at a price close to the value of the stocks underneath, and it did not try to pick winners. Its promise was the opposite of a stock-picker's: to be exactly as good as the index, no better and, ideally, not much worse.
A useful way to picture an ETF is as a glass jar of marbles on a shop counter. The jar holds the marbles in fixed proportions, and you can buy a scoop without counting the marbles yourself. Professional dealers, called market makers, keep the price of a scoop honest by buying and selling jars and marbles against each other whenever the two drift apart. The jar does not choose the marbles. The index rulebook does.
That rulebook was itself evolving. Six months after the first SMI ETF listed, on 1 October 2001, SIX moved the SMI to free-float weighting, so that shares locked up with long-term holders no longer counted toward a company's weight.3 Then on 24 September 2007, the exchange fixed the index at exactly 20 members; before that, the SMI had wandered between 18 and 29 stocks under a ceiling of 30.3
Today's version of those rules is precise. The SMI holds the 20 largest and most liquid equities traded on SIX, and together they represent more than 75% of the free-float market capitalisation of the entire Swiss equity market.8 Membership is reviewed once a year, on the third Friday of September.8 A company ranked in the top 18 on SIX's selection list goes straight in; the last two seats go first to existing members ranked 19th to 22nd, and only then to newcomers from that band.8 That buffer exists for a reason: without it, a company hovering around 20th place could be pushed in and out each year, forcing every tracking fund to buy and sell it repeatedly.
Weights, meanwhile, are refreshed every quarter, in March, June, September and December, when the share counts, free-float factors and caps are updated.8 So the fund is a slow-moving machine with two clocks: an annual clock for who is in, and a quarterly clock for how much of each it holds.
The fund's own ownership has changed too. Its ticker carries a fossil of its past. The "CS" in CSSMI points back to Credit Suisse, whose ETF business BlackRock bought in a deal completed on 1 July 2013, rebranding 58 funds with about $17.6 billion of assets as iShares while keeping their identifiers unchanged.9 So the bank's initials stayed on the ticker under a new owner, while the most direct competitor for this exact exposure came to sit with UBS, the other giant of Swiss finance.
The new owner brought something the old one could not: a global shelf. Within the iShares ETF (CH) umbrella, the SMI fund now sits beside sister funds on the SLI, on the mid-cap SMIM, on Swiss dividend payers, on the broad SPI and on Swiss government bonds, all run by the same Zurich management company, with investment decisions for several of them delegated to BlackRock Advisors (UK) Limited in London.10 That shelf matters later in this story, because it turns out that the most revealing competitor to CSSMI may not be UBS at all. It may be BlackRock itself.
What did investors get from this fund that they did not have before? Access and simplicity, delivered first. That head start is real history. A fund that opened before the dot-com bust and has since survived the 2008 financial crisis, the 2015 franc shock, a pandemic and the bear market of 2022 has proved that its plumbing works.
But durability is not the same thing as a moat. In 2001, an SMI ETF was a novelty. In 2026, it is a commodity: SIX hosts 34 ETF issuers and more than 2,000 tradable ETFs, and several of them can sell an investor the same 20 Swiss companies.7 The question has shifted from "can I own the SMI on the exchange?" to "which wrapper should I use, and what does it cost me?"
And to answer that, an investor first has to understand what, exactly, the wrapper contains, which brings the story back to that 2017 decision and what it did to the meaning of "the Swiss market."
III. The 18% Rule Changed What "Swiss Market" Means
On 30 November 2016, SIX sent out a three-page consultation paper that opened with an unusually candid admission. The exchange was considering a change to the SMI because of a European rulebook it did not control.2
The rulebook belonged to ESMA, the European Union's securities regulator, and to the UCITS regime, the framework that governs most mass-market investment funds sold across Europe. UCITS funds may track an index only if the index meets certain diversification and concentration limits, and SIX's paper said plainly that its aim was to let customers use the SMI in financial products under that regime.2 The problem was arithmetic: the two largest SMI components had repeatedly crossed the 20% threshold.2
SIX's first proposal was gentler than what it eventually adopted. It suggested capping the single largest member at 33% and every other member at 18%, with emergency trims between reviews if the largest crossed 35% or the second crossed 20%.2 In plain terms, the exchange was looking for the smallest change that would let European fund managers use its flagship index, while disturbing the index as little as possible.
The consultation also asked a revealing question: would users need a parallel, uncapped SMI, and for how long?2 That question exposed the real tension. An index is a product with several kinds of customers. ETF and structured-product issuers wanted a benchmark they could legally package for Europe. Derivatives traders wanted continuity. Some institutional benchmarks wanted the market exactly as it was, giant weights and all. Whatever SIX chose, someone's definition of "Switzerland" would change.
The consultation ran until 31 January 2017.2 By May, SIX had gone further than its own draft, applying the 18% ceiling to every member and triggering early cuts if two rose above 20% between reviews.1 The release said that issuers of financial products and users of index derivatives in particular had favoured capping.1 Reductions were phased in gradually, at three percentage points per quarter, and SIX launched a twin index for users who wanted no cap; today it is called the SPI 20, and its members are always identical to the SMI's, simply weighted without any limit.18
There is an irony buried in that decision. The cap was written for Europe's UCITS regime, yet CSSMI itself is not a UCITS fund. Its umbrella is a Swiss fund of the "other funds for traditional investments" type, governed by Swiss collective-investment law rather than the EU directive.10 The UBS rival, too, describes itself as a Swiss fund outside UCITS.11 So the rule that reshaped the index both funds track was driven largely by the needs of other products, European-domiciled ETFs, structured notes and derivatives, that wanted the SMI as their reference. Swiss investors in Swiss funds simply inherited the new definition of their own market.
What did the cap actually solve? It solved the regulatory problem completely. SIX's rulebook now describes the SMI as "sufficiently diversified for the UCITS guidelines" precisely because of the capping factor.8 It also solved the most extreme version of the concentration problem: no single company can again carry a quarter or more of the index for long.
What it did not do was turn the SMI into a diversified portfolio. Consider the index at the end of January 2026. Roche weighed about 18%, sitting just above the ceiling because prices drift between reviews. Novartis weighed nearly 17%, and Nestlé about 14%.11 Three companies, then, made up roughly half the index. Add UBS and ABB at nearly 8% each, and five companies were about two-thirds of it.11 In the latest iShares factsheet, the ten largest holdings make up about 83% of the fund.12
The rulebook adds a few further guard rails that shape who can sit in those top seats. When a company has more than one class of shares listed, SIX adds their free-float values together before applying the cap, so a company cannot slip past the 18% ceiling by spreading its weight across two lines of stock.8 And companies whose shares have a primary listing on more than one exchange, and which do less than half of their trading on SIX, must pass an extra liquidity test; such a company must rank no lower than 18th to be admitted, and is removed if it falls to 23rd or below.8 The SMI, in other words, is designed to be a Swiss market index that a fund can actually trade in Zurich, not merely a list of large companies with a Swiss address.
There is a subtle twist in those numbers. Right after the cap was phased in, all three giants sat at exactly 18%.3 By early 2026, Nestlé had slipped to about 14%, below the ceiling, not because of any rule but because its share price had lagged the others.11 The market itself did some of the de-concentrating that the rule could not. That is a reminder that the cap is a ceiling, not a target: it limits how heavy a stock can become, but it does nothing about the heavy stocks that sit just beneath it.
Sector exposure tells the same story from another angle. Healthcare accounted for about 41% of the fund in its latest factsheet.12 In January 2026, financials were about a fifth of the index and consumer staples about a seventh, while information technology was below one percent.11 For an investor whose other holdings are a global index full of software and semiconductor companies, that might be a feature. For an investor who thinks the SMI is "the Swiss market, diversified," it is a surprise worth discovering before a drug-pricing shock, a failed trial or a patent cliff discovers it for them.
Is there an alternative inside Switzerland? Yes, and SIX itself builds it. The Swiss Leader Index, the SLI, holds the 30 largest and most liquid Swiss stocks and caps them much harder: the four largest at 9% each and every other member at 4.5%.8 SIX describes it as an alternative to the SMI that distributes exposure to price movements more evenly across its members.8 Beyond that sits the Swiss Performance Index, the SPI, the broad benchmark from which the SMI's own members are drawn, reaching well down into Switzerland's mid-sized and smaller listed companies.8
So the trade-off is visible in the menu. The SMI concentrates on household-name blue chips and accepts heavy weights at the top. The SLI spreads the same large-cap world more evenly. The SPI reaches for the whole market. CSSMI picks the first of these and does not deviate, because a tracker cannot.
The verdict on the 18% rule, then, is narrower than the headline. The cap made the SMI usable for a much wider range of European fund products and prevented one name from dominating. It did not turn 20 stocks into a diversified portfolio, and it did not diversify the fund across countries or industries. Owning CSSMI remains a concentrated country bet on a few of the world's most international companies, with all of their pharmaceutical, consumer and banking risks attached.
Once an investor accepts that bet, the next question is mechanical, but it is where the money is: how does a fund with no business of its own turn those 20 companies into returns for its holders, and what does it keep for itself along the way?
IV. The Quiet Engine: Fees, Dividends and Tracking
Picture an investor in Lausanne, on an ordinary weekday, buying a few hundred units of CSSMI through an online broker. The order meets a seller or a market maker on SIX, settles two days later, and the investor owns a claim on a portfolio. Nothing in that trade touches Roche or Nestlé. No new shares of any Swiss company are issued. The investor has simply joined a pool.
Behind the pool, a quieter set of machinery runs. The fund holds the SMI's 20 stocks directly, which is what "physical replication" means: real shares, in a custody account, rather than a promise from a bank to pay the index return.13 Those shares pay dividends, which flow into the fund. Their prices move every second, which moves the fund's net asset value. And once a year, BlackRock deducts its fee.
The economics can be told as a cycle. Investors buy and sell units on the exchange. When demand exceeds supply, authorised dealers create new units by delivering cash or shares to the fund; when investors leave, units are redeemed and the fund shrinks.6 The fund holds SMI shares. Dividends and price changes flow into the net asset value. The manager's fee is a percentage of that value, so the fee grows when markets rise or investors arrive, and shrinks when either reverses.
That fee is 0.35% a year, the fund's total expense ratio or TER.4 It is a flat, all-in charge, set in the prospectus, that covers management, custody and administration.6 For an investor with CHF100,000 in the fund, it comes to CHF350 a year, taken quietly from the fund's assets rather than billed.
The audited accounts for the year ended 31 May 2025 show how that fee looks from the inside. The fund received about CHF59.5 million of dividend income from its shares that year, plus small amounts of interest on cash and from lending out securities, for total income of about CHF59.6 million.13 Against that, the management company was paid about CHF7.1 million.13 Net assets at the year end were about CHF2.11 billion.13 The fee charged works out at roughly 0.35% of average assets, exactly what the prospectus says it should be; the arithmetic closes, which is the most a unitholder can ask of a fee line.
Another way to see that relationship: for every CHF100 of dividends the Swiss companies paid into the fund that year, about CHF12 went to the manager, and the rest stayed with investors. That is not a scandal, and it is not a bargain. It is the price of the wrapper, and it is the number that the rival from UBS undercuts.
The following year confirmed the pattern at a larger scale. In the twelve months to 31 May 2026, dividend income rose to about CHF66 million and the management company's fee to about CHF7.9 million, while net assets grew to almost CHF2.49 billion.10 The fee grew by roughly a tenth, not because BlackRock did anything different, but because Swiss share prices rose and more investors arrived. That is the defining feature of an asset-based fee: the manager's revenue is a passenger on the market's ride, and so, in a bad year, is its pain.
This is also where a company-style reading of the accounts can mislead. The fund reported total net profit for that year of about CHF95.5 million.13 That is not a profit in the sense that Nestlé reports profit. It included roughly CHF54 million of realised gains on shares sold during the year and around CHF11 million of unrealised losses on shares still held, alongside the income net of expenses of about CHF52.5 million.13 In a fund, "profit" is mostly the market moving. A strong year for Swiss stocks makes the fund profitable; a bad one makes it lose money; the fund's own conduct barely enters into it. The year to May 2026 makes the point vividly: total net profit jumped to almost CHF298 million, and about two-thirds of that, nearly CHF198 million, was simply the unrealised rise in the value of shares the fund still held.10 Nobody at BlackRock earned that. Roche, Novartis and the rest of the index did.
So the questions an analyst would normally ask of a company, about margins, capital expenditure, research spending or acquisitions, simply do not apply. The fund has no R&D, no capex programme and no corporate acquisition strategy. Its meaningful "investment" choices are cost, how closely it tracks, how it replicates, and how well it controls the operational risks of holding and moving billions of francs of other people's shares.
Tracking is the heart of it. An index is a theoretical calculation that assumes no costs, no taxes, no trading frictions and instant reinvestment of every dividend. A real fund cannot match that perfectly. It pays a fee, it pays commissions when it rebalances, it holds a little cash, and its dividends arrive on real timetables. The difference between the fund's return and the index's is called the tracking difference, and for a passive fund it is the single most honest measure of how well the transmission works.
The fund allows itself small tools to keep that difference tight. Its mandate permits limited index futures and total-return swaps, mainly to stay fully invested while cash is moving in or out; at the end of May 2025, its derivative positions were worth only about CHF300,000, a rounding error against a two-billion-franc portfolio.136 It did not borrow in any conventional way, and its accounts showed no material borrowing balance.13
Dividends deserve their own moment, because Swiss blue chips are generous payers and this is a distributing fund that passes them through. As of 11 November 2026, its trailing distribution yield was about 2.34%.4 That income is not the fund's achievement. It is the dividend policy of Roche, Nestlé, Novartis, Zurich Insurance and the rest, minus the fund's costs, paid out to unitholders.
The rhythm of those payouts reveals the Swiss corporate calendar beneath the fund. In its year to May 2026, the fund paid unitholders a total of CHF3.56 per unit, gross. A first payment in July 2025 combined a small capital distribution with income; then came a burst of four income distributions between 10 March and 20 April 2026, the weeks when Swiss companies hold their annual meetings and pay their dividends.10 An investor in CSSMI is, in effect, collecting Switzerland's spring dividend season in instalments, at roughly 2.5% of the year-end unit value, before costs and taxes on the investor's side.
The fund also does not hedge currencies. Its accounting and listing currency is the Swiss franc, and its benchmark is the SMI total-return index in francs.4 Yet the companies inside it earn most of their money abroad, so a strong franc tends to squeeze their reported results while a weak franc flatters them. The investor in CSSMI owns that exposure whether they think about it or not, because it is embedded in the companies, not in the fund.
The fund's manager and custodian matter here, because a fund like this is only as sound as its custody.5 If a custodian failed or a counterparty in a derivatives or lending trade defaulted, Swiss collective-investment rules are designed to keep fund assets separate from the custodian's own, but transaction and counterparty risks would still matter.6 The fund's auditors gave an unmodified opinion on the 2025 accounts, finding them compliant with Swiss collective-investment law, the fund contract and the prospectus, with no emphasis-of-matter paragraph.13 Deloitte, the umbrella's statutory auditor, again found the accounts for the year to May 2026 compliant with Swiss law and the fund documents.10
The machinery also changes in small ways that matter to the professionals who use it. From 1 August 2026, the daily cut-off for dealers to subscribe or redeem units in the Swiss equity sub-funds, CSSMI among them, moved from 15:30 to 16:00 Central European Time.10 That half-hour sounds trivial. For a market maker who has to hedge a large creation against the closing auction of the underlying shares, it is extra time to get the price right, and better prices for dealers tend, over time, to show up as tighter quotes for investors.
Management credibility, in this world, also looks different. There is no CEO to judge on promises and misses, no shareholder vote on pay, no annual meeting where unitholders can challenge the board. The governance that exists sits at the management company. The 2025 report recorded that Dirk Klee joined its executive committee as delegate in October 2024, with Mirjam Staub Bisang as board chair and Barry O'Dwyer as vice-chair.13 Those are useful facts, but they are not the test. The relevant evidence of good management is whether the fund tracks its benchmark, discloses its costs clearly and avoids operational accidents. On the last two counts, the record is clean.
And investors have kept arriving. The fund had about 16.5 million units at the end of May 2024, issued about 1.7 million and redeemed about 1.6 million over the following year, and ended May 2025 with about 16.6 million.13 The year to May 2026 was busier: about 2.1 million units were created and about 1.05 million redeemed, lifting the total to about 17.6 million.10 By 12 November 2026, the count was marginally lower, at just under 17.6 million.4 Those are not equity raises. They are investors voting with their francs, and over two years they voted, on balance, to stay and to add modestly. Whether "modestly" is good enough is a question that only makes sense against what investors did elsewhere on the same shelf.
Which leaves the first measure, tracking, as the one that decides whether this fund is merely competent or genuinely good value. And on that measure, the fund's own long record has a very specific shape.
V. Four-Tenths of a Point Is the Whole Debate
Lay two factsheets side by side on a desk. Both describe Swiss-domiciled, physically replicated funds that hold the same 20 SMI stocks in the same weights, list on SIX in Swiss francs and distribute their dividends. One says the TER is 0.35%.4 The other, from UBS, says 0.20%.11
Everything about this comparison hinges on those fifteen basis points, fifteen hundredths of a percentage point a year. In a product where the underlying portfolio is identical by design, the fee and the tracking are almost the only things that can differ. So it is worth going slowly.
Start with the iShares fund's own long view. From its launch in 1999 through 12 November 2026, its net asset value delivered a total return of about 5.27% a year, including dividends, against 5.67% for the SMI total-return benchmark.4 Over the last ten years, the fund returned about 9.60% a year against 10.00% for the index.4 In both periods, the gap is roughly 0.40 percentage points a year.
Now line that up against the fee. The fund charges 0.35% a year. So the shortfall is the fee plus a little more, about five extra basis points a year. For the year to May 2026, BlackRock reported a pre-TER tracking difference of minus 0.05%, and realised tracking error, the month-to-month wobble around the index, of just 0.01%.10 BlackRock attributes that small residual mainly to net income differences, meaning withholding-tax rates, tax reclaims and the timing of dividend receipts compared with the index's idealised assumptions, and to investment techniques such as cash management.10 BlackRock does not break the five basis points down further. But the shape is unmistakable: almost all of the lag is the price tag.
The latest fiscal year shows the same arithmetic in miniature. In the twelve months to 31 May 2026, the fund returned about 13.8% against 14.2% for its benchmark, a gap of 0.40 percentage points, or the fee plus that residual nickel.10
Is that a bad result? Not on its own. A passive fund that lagged its index by only slightly more than its fee for a decade and more has done exactly what it was built to do. It has not leaked value through sloppy trading. It has not taken risky bets to try to beat the benchmark. The calendar years show the same steady pattern. In 2022, the fund lost about 14.6% while its index lost a little less; in 2023 it gained about 6.7% against 7.1%; in 2024 it gained about 7.1% against 7.6%; in 2025, it gained about 17.6% against 18.0%.4 10 In each year, the benchmark was ahead by roughly four-tenths of a point, rain or shine. Consistency like that is a sign of a well-run machine. It is also a sign that the gap is structural, because it does not depend on markets at all.
The difficulty is that the UBS fund shows the same discipline at a lower price. Over the previous five years, the UBS SMI fund returned about 7.44% a year against 7.69% for the SMI total-return index, a lag of about a quarter of a percentage point.11 UBS charges 0.20%, so its shortfall, like iShares', is the fee plus roughly five basis points. Its ex-post tracking error, the measure of how much its returns wobbled around the index, was a tiny 0.02% over two, three and five years.11
So the two funds look almost like twins with one difference in their price. And the calendar years confirm it. In 2022, UBS lost about 14.5%; iShares lost about 14.6%. In 2024, UBS gained about 7.3%; iShares about 7.1%. In 2025, UBS gained about 17.8%; iShares about 17.6%.11 4 Each year, the cheaper fund came out ahead by roughly the fee gap. Nothing in the record suggests that iShares' higher fee buys better tracking.
What does this comparison establish, and what can it not? It establishes that, across years of good and bad markets, the return gap between the two funds has been consistent with the fee gap. It does not prove that UBS will always keep its advantage; fees can be cut, and either fund could have a bad operational year. It also cannot isolate every source of the difference, because neither manager publishes a basis-point-by-basis-point attribution of its tracking. But the burden of proof has shifted. When two jars hold the same marbles, the more expensive jar needs a reason.
It is also worth fact-checking one comforting assumption: that the iShares fund must be the biggest and therefore the default. At the end of January 2026, the UBS SMI fund held about CHF3.3 billion in total.11 The iShares fund held about CHF2.77 billion in mid-November 2026.4 Those figures are from different dates and markets moved in between, so they are not a precise ranking. But they are enough to show that iShares is not the obvious scale leader in this particular product. Its rival is at least as large.
The sharper comparison, though, comes from inside BlackRock's own house. The same Swiss umbrella that contains CSSMI also contains the iShares Core SPI ETF (CH), which tracks the broad Swiss Performance Index, the very benchmark from which the SMI's 20 members are drawn. Its TER is 0.10%.10 The iShares Swiss Dividend ETF (CH) charges 0.15%.10 The iShares SLI ETF (CH), which holds the more evenly capped 30-stock index, charges the same 0.35% as CSSMI.10
Sit with that for a moment. BlackRock will sell an investor the broad Swiss market, including every SMI company plus a long tail of mid-sized and smaller ones, for less than a third of the price it charges for the twenty-stock SMI alone. The tracking record of that cheaper fund was also tight: for the year to May 2026 it returned about 13.6% against 13.7% for its benchmark.10 Whatever the 0.35% price on CSSMI reflects, it is not the cost of running a Swiss equity fund on BlackRock's platform. It looks more like the price of a famous label, set in an earlier era and never brought down to the level of the firm's newer, cheaper Swiss products.
That does not make the two funds interchangeable. The SPI owns hundreds of smaller companies that the SMI ignores, and an investor who wants only blue chips may prefer the narrower index. It also tracks a different benchmark, so its returns will diverge from the SMI's in any given year. But it answers the skeptical question directly: the issuer itself has shown that tracking Swiss equities can be done, well, for ten basis points.
There is a second trap worth avoiding. SIX publishes market-share figures for ETF providers, and iShares ranks first among them, ahead of UBS. Those are provider-wide trading figures across hundreds of products, not this fund's share of SMI tracking, and they say nothing direct about which SMI fund investors prefer. That distinction matters in the competitive story still to come, and it is easy to blur.
How much does fifteen basis points matter? On CHF100,000, it is CHF150 a year. That sounds trivial, and in any single year it is. But it compounds. At the ten-year returns above, an investor who earned the cheaper fund's return instead of the dearer one's would end the decade with very roughly an extra one-and-a-half percent of wealth, other things equal. For a pension fund putting hundreds of millions of francs into Swiss equities, the difference stops being a rounding error and becomes a line item.
Keep 2025 in proportion too. It was a strong year: both the iShares fund and its index rose by roughly 18%, and 2026 has continued the run, with the fund up about 16.6% year to date by 11 November.4 Strong markets make fee differences feel irrelevant, because they vanish against double-digit gains. They are not irrelevant. They are simply hidden, and they reappear in flat or falling years, when fifteen basis points can be a meaningful share of whatever return there is.
That leaves a skeptical investor with a clean test. If iShares costs fifteen basis points a year more, what measurable benefit pays for it? The candidates are a tighter trading spread on the exchange, better execution for large trades, availability on a particular broker or platform, or service an institution values. Each of those can exist. None of them shows up in the published return record, which so far favours the cheaper fund. Until an investor can see the benefit in their own trading costs, the case for the premium rests on convenience and familiarity, not on performance.
There is, however, one other source of return the fund has that is not in the index at all. It lends its shares. Whether that changes the arithmetic is the next question.
VI. Lending Shares Adds a Small, Complicated Side Payment
Imagine a hedge fund in London that wants to bet against a Swiss stock, or a bank that needs to deliver shares it does not yet have. It can borrow them, and one of the places it can borrow from is a fund like CSSMI, which owns millions of francs of Roche, Novartis and the rest and does not need them every day.
The mechanics are simple to describe. The fund lends some of its shares to a regulated borrower. The borrower hands over collateral worth more than the shares, and pays a fee for the loan. When the loan ends, the shares come back, the collateral goes back, and the fee is split. The fund may lend only to regulated borrowers, as its prospectus allows.6 The borrowers in the year to May 2026 read like a roll call of global investment banking: Barclays, BNP Paribas, Citigroup, Goldman Sachs, HSBC, Jefferies, JPMorgan, Macquarie, Morgan Stanley, Société Générale and, with a certain irony, UBS, the company behind CSSMI's cheaper rival.10 The collateral is administered by BNY and JPMorgan Chase.10
The split is where the related-party question lives. The lending agent is a BlackRock company, BlackRock Advisors (UK) Limited, and the income is divided 62.5% to the fund and 37.5% to the agent, with all operating costs borne out of the agent's share.10 6 BlackRock describes the arrangement in the prospectus as being on normal commercial terms and subject to review.6 It is not hidden. But it means BlackRock earns twice from the same portfolio: once through the management fee, and again through a share of lending proceeds from shares its own agent decides to lend.
So how much has the side payment been worth? In the year to May 2025, the fund booked about CHF28,500 of securities-lending income.13 Set that beside the roughly CHF7.1 million management fee in the same year, and lending income was about 0.4% of the fee. Measured against a fund of about two billion francs, it added roughly one-seventh of a single basis point.
Then comes the most telling detail in the accounts. On 31 May 2025, the fund had about CHF340 million of shares out on loan, a sixth of the portfolio, backed by about CHF359 million of collateral.10 A year later, the figure had collapsed to about CHF11 million, less than half of one percent of net assets.10 And yet lending income for the year to May 2026 was about CHF28,800, almost exactly the same as the year before.10 Whatever drives this fund's lending revenue, it is not the size of the balance on loan on any given day.
The latest data is even starker. For the twelve months to 30 September 2026, the fund's securities-lending return was 0.00%.4 Over that period, on average only about 0.91% of the fund's assets were on loan, and collateral ran at about 109% of the value of the shares lent.4
Why so little? Large Swiss blue chips are widely held and easy to borrow, so there is little scarcity for a lender to charge for, and demand to borrow them tends to come in short bursts rather than as a steady stream. Compare the fund's mid-cap sister, the iShares SMIM ETF (CH), which had almost 9% of its assets on loan at the end of May 2026 and earned about CHF223,000 from lending that year, nearly eight times CSSMI's income on less than half the assets.10 Smaller, scarcer stocks are what borrowers pay for. Twenty of the most liquid companies in Europe are not. Whatever the cause in a given year, the outcome is clear: lending does not close the fifteen-basis-point gap with UBS, or anything close to it.
What about the risk? The textbook danger runs in a chain: the borrower defaults, the collateral it posted has fallen in value or is hard to sell, and the fund must buy back the lent shares in the open market, perhaps after their price has jumped. Collateral of about 109% of the loan value is a cushion against that chain, not a guarantee. BlackRock says the sub-funds benefit from a borrower-default indemnity from BlackRock, Inc., which allows for the full replacement of securities on loan, with the cost of that indemnity also borne by BlackRock.10
That indemnity changes the shape of the risk rather than removing it. In a borrower default, the fund would look first to the collateral and then to BlackRock, Inc. to make it whole. So the residual exposure is to a sequence of failures, a large bank defaulting and its collateral falling short and the indemnity being called at a moment of market stress, rather than to any single event. With so little on loan today, that exposure is small. It is still a disclosed related-party arrangement in which the same group chooses the loans, takes a share of the fee and stands behind the losses.
The fair conclusion is that lending is not a meaningful source of extra return for CSSMI investors today. It is a well-protected but trivial side business, a disclosed related-party revenue channel in exchange for a return that has recently rounded to nothing.
The right way to track it, then, is not by how many shares are out on loan. More lending does not automatically mean more income. The figures that matter are the net lending proceeds that reach the fund each year, after the agent's share, set against the collateral coverage and the indemnity that protect them. The next audited report will show whether the zero was a blip or the new normal.
With the fee higher than its rival's and the lending income negligible, the obvious question becomes commercial rather than mechanical. Why does a fund like this keep its investors at all?
VII. A Giant Provider, a Commodity Product
Every quarter, SIX publishes a report on its ETF market, and the final one for 2025 told a story of two dominant houses. In the fourth quarter of that year, iShares products accounted for about a third of all ETF trading turnover on the Swiss exchange, about 33.4%. UBS was next, with about 27.2%.14 Between them, the two firms carried roughly 60% of the exchange's ETF trading.
Those figures describe each provider's full Swiss-listed range, not the SMI contest.
Run the competitive forces through this product, and they all point in the same direction. Start with the buyers, the investors. They can switch from one SMI ETF to another with a sell order and a buy order, typically in minutes, with no lock-in, no contract and no loss of features. Their bargaining power is high.
Substitutes are everywhere. An investor can buy the UBS SMI fund, another provider's Swiss large-cap fund, an SLI tracker, an SPI tracker, or simply the 20 stocks directly. Institutional investors can replicate the index themselves or use futures. Because the SMI's holdings and weights are published, nothing about the portfolio is secret, so the threat of substitution is not theoretical. It is built into the product.
New entrants face low barriers on the portfolio side, since anyone licensed by SIX can track the SMI, but higher barriers on distribution and trust. That is where incumbents earn their keep. Supplier power sits with SIX, which owns and licenses the index, and with the custody and market-making firms that keep the machinery running. And rivalry among the incumbents is expressed through the one lever that is visible to everyone: the fee.
What, then, could a CSSMI holder reasonably hope the iShares name provides? There are four plausible benefits. Distribution reach: many Swiss and international brokers list iShares funds by default. Market-making relationships: a large provider can attract more dealers to quote its funds, which can tighten spreads. Operational scale: a big platform can spread the fixed costs of custody, compliance and reporting. And familiarity: some investors prefer the brand they know.
Each of those is plausible. None is proven at the level of this specific fund in the published materials. iShares' advantage in exchange-wide turnover suggests a deep platform. But liquidity on the exchange is not the same as fund size, and neither is the same as market share in SMI trackers. Without product-level evidence that CSSMI trades at a tighter spread, attracts stronger flows or tracks better than its UBS twin, those benefits remain hypotheses.
And here the historical record is the strongest test. The iShares fund listed in March 2001; the UBS fund launched on 2 December 2003, more than two and a half years later.11 Since then, both have had more than two decades to compete for the same investors. If being first and being iShares created a lasting moat, it would show up as a fee premium that investors pay without leaving and a clear size lead. The fee premium exists. The size lead does not obviously exist. The rival, cheaper and slightly younger, appears to be at least as large. That evidence narrows the moat claim sharply: the platform is real, but the individual fund has not converted it into a durable advantage over its closest substitute.
The flows on BlackRock's own Swiss shelf push the same conclusion further. CSSMI units rose modestly over the two years to 31 May 2026.10 Over the same two years, units in the 0.10% Core SPI fund rose by almost half, from about 22.3 million to 32.5 million, and units in the 0.15% Swiss Dividend fund rose about two and a half times, from about 15.8 million to 40.6 million.10 By May 2026, the Core SPI fund managed about CHF5.3 billion and the Swiss Dividend fund about CHF7.4 billion, both far larger than CSSMI's CHF2.5 billion.10
Unit counts strip out market movements, so they are the cleanest view of where new money went, and the message is plain. Investors who came to iShares for Swiss equities in these two years overwhelmingly chose the cheaper, broader or differently designed products, not the flagship SMI fund. The platform's pull is real; its pull toward this particular fund is weak. That is what a commodity looks like from the inside: the brand gets the investor through the door, and price and design decide where they sit.
Several of the usual corporate questions simply have no answer here, because they do not apply. There is no management ownership to examine, no executive incentive plan tied to the fund, no capital allocation record of acquisitions or buybacks. When the fund issues new units, it is not raising capital to invest in growth; it is accommodating investors who want in, and redemptions simply hand assets back.
There is also no earnings call. Nobody stands up each quarter to explain CSSMI's strategy, and analysts do not cross-examine anyone about it. The primary evidence on this product's costs, risks and design lives in the audited annual reports, the prospectus and SIX's index consultations. That is fitting. The fund's strategy was settled in its prospectus long ago: track the index, charge the fee. The only question is whether that offer remains competitive.
Which leads to the frame any long-term investor should apply: weigh the bull and bear cases for owning the SMI through this specific wrapper, and decide which numbers settle the debate.
VIII. Analysis & Bull vs. Bear Case
Return to the investor at the desk with two factsheets. The choice in front of them is not between Swiss stocks and something else. It is between a familiar SMI label at 0.35% a year and a cheaper tracker of the same index at 0.20%. The broader question sits behind it: is the SMI, through any wrapper, the right way to own Switzerland?
The bull case begins with what the fund demonstrably does well. It offers a transparent, physical portfolio of Switzerland's leading listed companies, held directly rather than through a swap.4 It has a long, uninterrupted operating history, which includes clean audit opinions in each of the last two years and no material litigation or tax disputes disclosed in its 2025 report.13 10 Its tracking has been steady: over ten years and since launch, it delivered the index return minus slightly more than its fee, year in and year out.4 It is large, at about CHF2.77 billion, and its unit count has grown, so investors have kept choosing it.4
It also offers exposure to a market with real qualities. The SMI's companies are among the most international on the planet, many with strong balance sheets and long dividend records, and the 2.34% trailing distribution yield gives holders a steady stream of income.4 For an investor who wants a defensive, quality-tilted large-cap allocation in Swiss francs, this is a straightforward way to get it.
The bear case begins with the same 20 stocks. Twenty holdings remain a concentrated exposure, with the top three around half the index and healthcare around 41% of the fund.11 12 A shock to one of those companies, a failed blockbuster trial, a pricing reform in American drug markets, a crisis at a bank, can dominate a year's return. Investors who think they have bought diversification have, in fact, bought a sharply defined bet. And the same benchmark is available through a lower-fee peer with an equally tight tracking record.11
Run the moat argument once, in full, using Hamilton Helmer's seven powers, the framework that asks what lets a business earn better returns than its rivals for a long time. Scale economies: real at the platform level, since BlackRock spreads fixed costs across a huge product range, and the 0.10% fee on its own Core SPI fund proves it can run Swiss equities very cheaply. But that scale has not been passed through to this fund, whose price sits above both its UBS rival and its own siblings. Network economies: absent, because one investor's ownership does not make the fund more valuable to another, apart from a modest liquidity effect in trading. Counter-positioning: absent, since the fund's model is the industry standard.
Switching costs are low: selling one SMI ETF and buying another takes minutes, though taxable investors may hesitate to crystallise gains, which is a genuine, if passive, source of stickiness. Branding is plausible, since the iShares name carries weight, but its value is limited when the product is identical and the price is published. Cornered resource: none, because the index is licensed to multiple providers. Process power: the operational excellence of tracking tightly, keeping assets safe and running a clean audit is real, but UBS demonstrates the same capability.
Score it honestly, and the fund has a platform, a reputation and a passive base of investors reluctant to move. It does not have a durable power that would justify a sustained fee premium against an identical product. The likeliest long-run outcome in a market like this is pressure on that premium, either through investors drifting to cheaper options or through a fee cut. The first is already visible in the flows on BlackRock's own shelf, where new Swiss-equity money has gone mostly to cheaper funds; the second has not happened. So the claim that CSSMI can hold its price survives only in a narrower form: it can keep the investors it already has, at least while markets are rising, but the record does not show it winning new ones at that price.
The risks that matter most here sit inside the portfolio, not inside the wrapper, and the concentration turns them into fund-level risks. With healthcare at about two-fifths of the fund, anything that compresses pharmaceutical profits, whether drug-pricing reform in the United States, tariffs on imported medicines or a patent cliff at one of the two drug giants, flows straight into CSSMI's net asset value. The banking and insurance names, about a fifth of the index, tie the fund to the credit cycle and to Swiss capital rules. And whenever the franc strengthens, which the fund does not hedge against, it quietly shrinks the foreign earnings of almost every company inside it once they are translated home. None of these is a reason to avoid the SMI. Each is a reason to know that owning it is a set of specific bets, not a neutral default.
Why might the fund win from here anyway? Because inertia is a powerful force in finance. Many investors buy through a bank or broker that features iShares products, many trade in sizes where fifteen basis points are invisible, and many value a brand they already use across other holdings. For those investors, the fund's established infrastructure may genuinely be the most convenient choice.
Why might it not? Because the proposition is readily copied, the fee gap is explicit on every factsheet and comparison website, and the evidence shows modest but persistent benchmark lag consistent with that fee. A sophisticated investor comparing like with like has every reason to choose the cheaper fund unless a specific trading advantage shows up.
An activist looking at this fund would not find a poorly run business. They would find a well-run product priced above its closest substitute, a related-party lending split that sends 37.5% of the proceeds to the manager for a programme that recently returned nothing, and no published product-level evidence of a trading-cost advantage to justify the premium. They would also point to the awkward internal comparison: why should a twenty-stock Swiss fund cost three and a half times the same manager's broad Swiss fund? Their demand would be simple: either cut the fee, or publish the spread and execution data that prove investors get something for it.
Three numbers capture the fund's ongoing performance. The first is the annualised tracking difference against the SMI total-return index, currently about minus 0.40 percentage points a year over ten years, which tells you how much of the index return the fund actually delivers; stripped of the fee, the latest fiscal year's gap was just minus 0.05%, and steady.10 The second is the total cost to the investor, which is the TER of 0.35% plus the trading spread the investor actually pays on the exchange, which depends on the day, the size of the trade and the broker. The third is the net securities-lending contribution, recently 0.00%, which shows whether the manager's side business is paying its way.4
One caution about valuation. The fund's portfolio traded at about 24 times earnings and about 4.6 times book value as of 11 November 2026, up from about 22 and 4.3 times in the prior month's factsheet.4 12 Those multiples describe the SMI companies, not the ETF as a business. They tell an investor that Swiss blue chips are priced as quality assets after a strong run, a premium that assumes their earnings will hold up. They are not a valuation of CSSMI itself, which is always worth exactly its net asset value, give or take a small trading premium or discount.
So the analysis lands in two parts. As a way to own the SMI, CSSMI is sound, well run and transparent. As the best way to own the SMI, its case depends on benefits that its published record does not show.
IX. Business & Investing Lessons
Go back to that investor with the two factsheets once more, because the lessons all live in that moment.
The first lesson is that a label is not diversification. As the SMI's concentration makes clear, the name on the jar tells you what the jar is called, not how many kinds of marble are inside. The wider lesson for investors is to read the holdings before trusting the headline, especially in small, rich markets where a few global champions loom over everything else.
The second lesson is that a small fee gap compounds. The comparison with UBS shows how a persistent gap can shape returns when two funds track the same index. Brand claims cannot argue with that kind of evidence. Only measured benefits can.
The third lesson is that a rule change is not a new business. The 2017 cap made the SMI more usable for European fund products, but left it a concentrated index. Rules can make a benchmark more usable without making it more balanced.
The fourth lesson is that extra income needs a net number. CSSMI's securities lending has added little for investors, while carrying a disclosed conflict and protections. Any extra return belongs in the investment case only after the fund's share, the fees, the collateral and the risk have all been counted.
The fifth lesson is that the cheapest competitor can be your own sibling. CSSMI's sharpest rival is also inside BlackRock's umbrella: the cheaper Core SPI fund. Its flows show the pull of that alternative. Legacy pricing survives in asset management because inertia protects it, not because anyone defends it. For founders and incumbents everywhere, the warning is the same: when your newer product is cheaper and better, your customers will eventually notice, and the old price will not be decided by you.
Put together, the lessons point to one durable truth about this fund: in a replicable product, longevity and scale earn a hearing, but an investor still needs a measurable reason to pay more. A product can be excellent and still not be the best choice. The difference between a good fund and a good decision is the comparison.
X. Epilogue
Tonight, CSSMI sits at the top of its 52-week range, with about CHF2.77 billion entrusted to it, roughly 17.6 million units outstanding and a portfolio of twenty Swiss companies trading at about 24 times earnings.4 Swiss stocks have had a strong two years. In markets like this, nobody frets about fifteen basis points or a lending return of zero. That is exactly why the next few moments matter.
The first is the next audited annual report, for the year to May 2027. The latest one, for the year to May 2026, established the baseline: tracking stayed close to the fee, and lending income remained negligible.10 The next one will show whether those numbers hold. If tracking stays close to the fee and lending stays negligible, the story holds: an honest wrapper at a premium price. If BlackRock cut the fee toward the UBS level, or toward its own Core SPI fund, the main bear argument would weaken overnight. If it does not, the drift of new money toward cheaper Swiss products is likely to remain the quiet verdict on that price.
The second comes each September, at the SMI's annual review, and each quarter when weights are reset. The next review will show whether the index's top three companies and its heavy healthcare weight drift further, or whether the market, as with Nestlé's quiet slide below the cap, keeps de-concentrating the index on its own. An investor should watch the top-three weight and the healthcare share together, because they are where the concentration risk actually sits.
The third is the lending programme. Either lending returns recover from their recent zero, or they stay at the edge of invisibility. Either way, the question is whether the lending income is worth the conflict of interest built into the arrangement.
None of these events requires the fund to invent a new growth engine. It cannot. Its fate is set by the SMI's companies, by its own costs and by the price of the alternatives. The central questions this story began with remain live: whether the SMI is diversified enough for the investor holding it, whether this wrapper earns its higher fee, and whether lending adds anything. Each will be answered by numbers anyone can read when they are published. The tension that remains is whether the market will keep paying for a familiar name when the evidence keeps saying it does not have to.
XI. Outro
Somewhere on SIX today, a single unit of CSSMI changed hands. The buyer and seller probably never thought about Roche's weight, or the September buffer rules, or a consultation paper from November 2016. They did not need to. Behind that unit sits the SMI, shaped by the exchange's rules.8
That is what makes this fund unlike any company in the market. CSSMI's promise is the index, delivered faithfully for its stated fee.4 It sells a precise slice of Swiss large-cap exposure, and every year it asks the same question of the people who own it: is this particular wrapper worth what it costs?
References
-
Amendment to the index rules of SIX Swiss Exchange with effect from 18 September 2017 — SIX, 2017-05-04 ↩↩↩↩↩
-
Market Consultation on potential index methodology changes of SMI — SIX, 2016-11-30 ↩↩↩↩↩↩↩
-
iShares SMI ETF (CH) product page — BlackRock, accessed 2026-11-13 ↩↩↩↩↩↩↩↩↩↩↩↩↩↩↩↩↩↩↩↩↩↩↩↩
-
Approved Swiss collective investment schemes — FINMA, 2026-04-30 ↩↩
-
iShares ETF (CH) Prospectus with Integrated Fund Contract — BlackRock, 2026-03 ↩↩↩↩↩↩↩↩
-
Swiss Index Methodology Rulebook Governing Equity and Real Estate Indices, Version 3.41 — SIX, 2026-10-29 ↩↩↩↩↩↩↩↩↩↩↩↩
-
BlackRock iShares completes acquisition of Credit Suisse ETF business — ETF Strategy, 2013-07-01 ↩
-
iShares ETF (CH) Annual Report and Audited Financial Statements 2026 — BlackRock, FY ended 2026-05-31 ↩↩↩↩↩↩↩↩↩↩↩↩↩↩↩↩↩↩↩↩↩↩↩↩↩↩↩↩↩↩
-
UBS SMI ETF CHF dis factsheet — UBS, 2026-01-31 ↩↩↩↩↩↩↩↩↩↩↩↩↩
-
iShares ETF (CH) Annual Report 2025 — BlackRock, FY ended 2025-05-31 ↩↩↩↩↩↩↩↩↩↩↩↩↩
 LinkedIn
 WhatsApp
 Reddit
 Hacker News
 Email
 Kindle
 RSS Feed
 Spotify
 Apple Podcasts
 Amazon Music
 Audible
 YouTube