PSG Financial Services: The Adviser Network That Became a Public Company
I. The Market Turns, and the Fee Engine Slows
On 15 October 2026, PSG Financial Services published a set of half-year numbers that would have looked perfectly respectable in almost any other year. Recurring headline earnings per share, the measure the company itself steers by, rose 5% to 60.9 cents for the six months to the end of August.1 Assets under management had climbed to about R594 billion.1 The Wealth business, the largest of the group's three divisions, grew its earnings by double digits.1 Nothing had broken.
The trouble was the comparison. Six months earlier, in April 2026, the same company had reported a full year in which recurring headline earnings per share jumped 34% to 135 cents.2 That is not a normal number for a South African wealth manager with nearly three decades of history behind it. It is the kind of number that makes a share re-rate, and it did. So when the next half-year arrived with growth of 5%, the obvious question was which of the two figures described the real business.
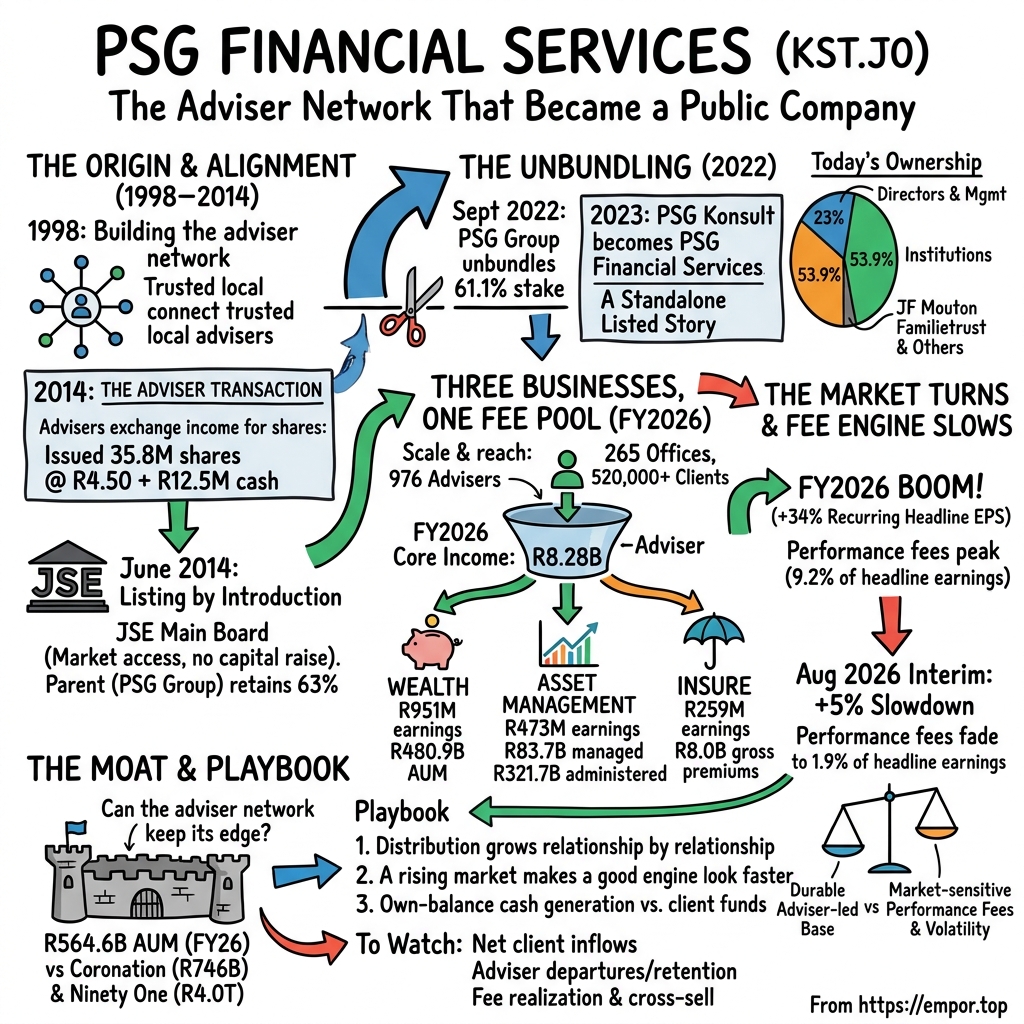
The clue sits in one small line of each report. In FY2026, the year to February, performance fees, the bonuses a fund manager earns only when its funds beat a benchmark by enough, made up 9.2% of headline earnings, against 3.7% a year earlier.2 By the August 2026 half-year, that share had collapsed to 1.9%, down from 7.3% in the comparable period a year before.1 Strip performance fees out and the interim picture looks better: recurring earnings per share excluding them grew 11%.1 Strip them out of the boom year and it looks a little less spectacular: 26% instead of 34%.2
Put those two adjustments side by side and the story comes into focus. PSG has an underlying engine that has been growing at a healthy double-digit pace. Wrapped around that engine is a layer of income that depends on markets: performance fees, gains on investments, investment income in the insurance business. In FY2026 that outer layer was blowing a strong tailwind. In the August half-year, it turned into a mild headwind.
That is the puzzle this episode tries to solve. What exactly does PSG's network of advisers earn, and how much of that would survive a market that stops helping? What makes the business hard to copy, if anything? And is a share price that now sits above its own five-year average multiple paying for the engine, or for the tailwind?
Before going further, one boundary matters, because the name causes confusion. This story is about PSG Financial Services, listed on the Johannesburg Stock Exchange under the code KST. It used to be called PSG Konsult. For most of its listed life it sat inside a different, larger company, PSG Group, the investment holding company founded by Jannie Mouton that also built stakes in Capitec, Curro and others.3 PSG Group unbundled its shares and delisted in 2022.3 Its portfolio companies are not part of PSG Financial Services, and nothing those companies earned shows up in the numbers here.
What is left, once the family tree is cleared away, is a financial-advice business with three branches: Wealth, Asset Management and Insure. To understand why it earns what it earns, the story has to start not with a fund or a policy, but with a person sitting in a small-town office across a desk from a client.
 Subscribe on LinkedIn
II. Building the Adviser Network One Relationship at a Time
Picture a financial adviser in a South African country town in the late 1990s. The local bank branch sells its own products. The big life insurers send their own agents, paid on commission, who sell their own policies. A family with savings, a farm or a small business and a retirement to plan has few places to go for advice that is not attached to a single product shelf.
PSG Konsult's network grew out of that gap. The business has described itself as operating its advisory network since 1998.4 The idea was not to invent a better fund or a cleverer insurance policy. It was distribution: put trusted, locally embedded advisers in offices across the country, give them a platform, research, administration and products, and let them build long relationships with clients one household at a time.
By the time the company prepared for its stock-market listing in 2014, that idea had become a sizeable operation. At the end of February 2014, PSG Konsult ran 193 offices in South Africa and Namibia, employed 1,841 people of whom 618 were financial planners, portfolio managers, stockbrokers and asset managers, and served more than 150,000 clients.5 It had about R112 billion of funds under management and about R235 billion under administration.5
Those numbers hide the structural problem every adviser network faces. The adviser owns the relationship. The client trusts the person, not the logo. If the adviser leaves, the client often follows. A platform that depends on advisers is therefore always negotiating with them: how much of the income does the adviser keep, how much does the platform keep, and what stops a successful adviser from walking across the road to a competitor, or setting up alone?
The industry has tried several answers to that problem. Life insurers have long employed tied agents who sell only the house products, which secures the relationship but limits what the adviser can offer and raises questions about whose interest is being served. Fully independent advisers keep their freedom but must build their own back office, compliance and research. Platform networks sit between the two: the adviser keeps a degree of independence and a share of the income, while the platform provides the machinery and takes its cut. The weakness of the middle path is that the adviser's loyalty depends on the deal staying attractive.
In 2014 PSG Konsult tried a bold answer. In a transaction reported with its results for the six months to August 2014, the company bought a larger share of advisers' income streams and paid for it partly in its own shares.6 It issued 35.8 million shares at R4.50 each, plus R12.5 million in cash, and moved advisers onto standardised revenue-sharing terms.6 In plain terms: advisers gave the company a bigger slice of the fees from their client books, and in return became shareholders in the platform.
Why does that matter so much? Because it changed the adviser's incentives in two ways at once. A standard revenue split made the economics of each practice more predictable for the group. And shares gave advisers a reason to care about the whole platform's value, not just their own monthly commission. An adviser thinking about leaving now had something to lose beyond a client list. It is the closest thing in this story to a founding design decision, and it is the one that most clearly explains the company PSG later became.
Twelve years on, the network looks very different in scale. At the end of FY2026, PSG counted 976 advisers in 265 offices and more than 520,000 clients.7 Client numbers have more than tripled since the listing, which is the single clearest piece of evidence that the distribution model has worked as a way of gathering relationships.
The office count tells a subtler story. It rose from 193 to 265 over those twelve years, an increase of well under half, while clients more than tripled.57 The 2014 figure of 618 also counted portfolio managers, stockbrokers and asset managers alongside planners, so it is not a like-for-like adviser count with today's 976.5 But the direction is plain: each office and each adviser now serves far more clients than at the listing. That is what a platform is supposed to do. Shared administration, research, compliance and technology let an adviser carry a bigger book without hiring a back office of their own, and the group earns its slice on every client added to that book.
What the record does not show is just as important. PSG does not publish adviser retention rates by cohort, the lifetime revenue of a typical adviser practice, or what it costs to recruit and onboard a new adviser or win a new client.7 Those are the proof points that would tell an investor whether the 2014 design really locked advisers in, or whether the network simply grew because South African savers and markets grew underneath it. The headline counts measure scale. They do not measure stickiness.
So the founding idea leaves an open question that the next chapter takes up. In 2014 this network was still a subsidiary inside a much larger holding company. Could it stand on its own in front of public investors, or was its value still bundled up with its parent?
III. A Listing Without a Fundraising Roadshow
Most stock-market debuts are, at heart, fundraising events. Bankers tour the country, the company sells new shares, and the money pays for factories, acquisitions or debt reduction. PSG Konsult's arrival on the Johannesburg Stock Exchange in June 2014 was nothing of the kind.
Shares in PSG Konsult had already traded over the counter since 2005.5 The JSE listing, which took effect from 18 June 2014, was a listing "by way of introduction" of the company's entire existing share capital, and the company said plainly that it did not intend to raise capital leading up to it.5 Roughly 1.26 billion shares simply moved from an informal trading venue onto the exchange's Main Board, under the code KST.5 Chief executive Francois Gouws made the same point when the shares started trading: this was not a capital raise.4 The debut was hardly a quiet corner of the market, either. PSG Konsult was the fifth company to list on the JSE's Main Board that year and the 30th financial-services company on the exchange, joining a sector then worth about R215 billion.4 For a business that had spent nine years trading in the informal shadows of the over-the-counter market, that was a promotion into the company of the country's established financial names.
A listing by introduction is a bit like moving a well-established shop from a side street onto the high street. Nothing new is sold on opening day. The point is visibility, liquidity and a price that anyone can see and trade. Employees, advisers and long-standing shareholders who had held shares on the over-the-counter market gained a deeper market in which to sell. The company also kept the option, as it said at the time, to raise equity later if it ever needed to.5
The business that walked onto the Main Board had the same three-part shape it has today. PSG Wealth looked after clients' savings and investments through the adviser network and a stockbroking and platform operation. PSG Asset Management ran the in-house funds. PSG Insure distributed short-term insurance, and through its underwriter, Western, carried some insurance risk itself.5 All three hung off the same distribution relationship.
At the top of the share register sat PSG Group. The listing documents described PSG Konsult as a subsidiary of PSG Group, which controlled it.5 The board reflected that parentage. The non-executive directors included Jannie Mouton, the PSG Group founder, and his son Piet Mouton, alongside chairman Willem Theron and independent directors including Patrick Burton.5 Gouws, then 49, was chief executive and Mike Smith, then 46, was chief financial officer.5
That arrangement had a cost and a benefit. The benefit was a patient controlling shareholder with a long record of building financial businesses. The cost was that PSG Konsult was always, in part, a line inside someone else's portfolio. An investor who wanted exposure to the adviser network could buy it directly, but the controlling stake, the strategic direction and the price discovery all had a parent hovering above them.
Notice what the listing did not do. It did not fund a burst of acquisitions with fresh public equity, and the shares issued to advisers that same year were consideration for adviser income, not a raise for expansion.6 This is a story about market access and, eventually, separation, not about a company that used the stock market as a cash machine.
The real test of the listing came with the 2022 separation. Did PSG Konsult's economics, and the case for owning it, become clearer once it stood alone?
IV. The Parent Unbundles—and the Listed Company Inherits Its Own Story
In September 2022, PSG Group carried out the final act of a holding company that had decided it was worth more broken up than whole. Through a set of linked transactions, it unbundled its stakes in five JSE-listed companies directly to its own shareholders: 61.1% of PSG Konsult, plus large holdings in Curro, KAL Group, CA&S and Stadio.3 Shareholders who wanted out of what remained were bought out at R23 a share, and PSG Group then delisted.3
It is worth being precise about what changed for PSG Konsult that September. Nothing in the operating business moved. The same advisers sat in the same offices with the same clients. No new money came into the company, and no assets left it. What changed was the owner of the shares. A single controlling holder became a dispersed set of shareholders, many of them the very same people and institutions who had previously owned PSG Konsult indirectly through the parent.
Why would a parent give away its crown jewels? Holding companies in South Africa had long traded at a discount to the value of what they owned, because investors paid twice for the same management layer and could not choose which underlying businesses to hold. Handing the shares directly to its own shareholders let PSG Group's owners keep or sell each business on its merits, and removed the discount in one stroke. For PSG Konsult, the effect was to strip away a layer of interpretation. Its share price now reflects what investors think of the adviser network, not what they think of a conglomerate.
That distinction matters for anyone reading the numbers. The R23 buyout price, the Capitec unbundling of 2020 and the rest of PSG Group's restructuring belong to the parent's history.3 None of those transactions is revenue, an acquisition or capital deployed by PSG Konsult. They tell an investor where the shares came from, not what the business earns.
The name followed the ownership. In August 2023 PSG Konsult became PSG Financial Services, a label that described a diversified services group better than an Afrikaans-flavoured word for "consult".7 With the parent gone, the company had to be judged on its own merits, without a holding-company discount or premium to blur the picture.
Who owns it now? At the end of February 2026, directors held about 22% of the shares and management about 1%, with another 1% in treasury.7 Institutional investors held 53.9%.7 Three holders stood above 5%: Coronation Asset Management with 17.8%, the Public Investment Corporation, which manages South African public-sector pensions, with 14.5%, and the JF Mouton Familietrust, the family trust of PSG Group founder Jannie Mouton, with 13.9%.7 A year earlier those three stakes had been roughly 16%, 13% and 14%, while Allan Gray had cut its holding from 8% to 5%.7
That register has a quirk worth savouring. Coronation, the single largest shareholder, is also a competitor in asset management, one of the managers PSG's own funds are measured against. Coronation has been public about its view of PSG, featuring the company in its "Crown Club" series of investment insights in October 2026.8 A rival choosing to own nearly a fifth of the company is not proof of anything, but it is a revealing vote from someone who knows the industry's economics from the inside.
The Mouton family trust, meanwhile, keeps the founding lineage close to the boardroom. A large family-linked block can align management with long-term owners. It can also concentrate influence, and the trust's interests and those of directors and management are related but not identical. No pledge of those shares was reported in the FY2026 report.7
The standalone era has coincided with the fastest earnings growth in the company's listed history. Net profit compounded at about 22% a year over the three years to FY2026, well above the roughly 20% five-year and 19.5% ten-year pace.27 The obvious question is what produced it: the operating model, the markets, acquisitions, or some mix of all three. To answer that, the story has to open the machine and follow the money.
V. Three Businesses, One Fee Pool
Follow a single client through the door. She arrives at a PSG office in, say, Stellenbosch with a retirement annuity from an old employer, some shares inherited from a parent and a house and car to insure. The adviser does a financial plan. That conversation is the start of a chain of fees, and almost every link in it pays PSG something.
If she moves her savings onto PSG's investment platform, PSG earns administration fees for keeping the records, processing contributions and reporting. If those savings go into a PSG-managed unit trust, PSG Asset Management earns a management fee, a small percentage of the assets every year, and possibly a performance fee if the fund beats its target. If the adviser places her shares in a stockbroking account, trades earn brokerage. Her adviser earns an advice fee or commission, part of which flows to the group under the revenue-sharing terms set in 2014. And when the adviser places her household insurance, PSG Insure earns commission and administration fees, and if the policy is underwritten by PSG's own insurer, Western, it also earns the underwriting result.
Add that up across the whole client base and you get the shape of FY2026. Core income was about R8.3 billion.2 Management and performance fees together were about R2.6 billion, commissions about R2.7 billion, administration fees almost R0.9 billion and brokerage about R0.35 billion.7 Most of this revenue is recognised over time as services are provided; brokerage is the main transaction-based stream.7
Then look at where profit lands. Recurring headline earnings were about R1.68 billion. Wealth produced about R951 million of that, Asset Management about R473 million and Insure about R259 million.2 Wealth is the anchor, bringing in more than half the group's earnings. It looked after about R481 billion of managed assets.2 Asset Management managed about R84 billion and administered about R322 billion, while Insure wrote about R8 billion of gross premiums.2
Those scale figures need careful handling, because they are not all the same kind of thing. Assets under management are money PSG actively invests. Assets under administration are money it holds records for, often invested in other managers' funds. Gross premiums are mostly money paid by clients to insurers. Much of the premium that PSG's advisers distribute is placed with third-party insurers, on which PSG earns commission and fees without carrying the claims risk; Western, by contrast, underwrites non-life business and keeps the risk.7 So R8 billion of premiums is a measure of reach, not of PSG's revenue.
Each division has its own temperament. Wealth earns largely on the size of client assets and the volume of advice, so it grows with net client inflows, adviser recruitment and market levels. Asset Management is the faster-growing but jumpier sibling, because its management fees ride directly on market values and its performance fees switch on and off with relative returns. Insure earns underwriting profit when claims are benign and investment income on the float it holds, and loses some of both when storms hit or rates fall.
That temperament showed up in the August 2026 half-year. Wealth earnings rose 14%.1 Asset Management earnings fell 5%, and Insure earnings fell 16%.1 Management attributed the declines to lower performance fees in Asset Management, lower investment income in Insure and claims from storms in the Western Cape.1 In other words, the one division whose income comes most directly from advice and assets kept compounding, and the two divisions with more market and weather exposure gave back ground.
That split is the most useful single diagnostic in the latest numbers. It suggests that the advice-led core is genuinely growing, and that the slowdown was concentrated where market-sensitive income sits. It also warns that the word "recurring" in "recurring headline earnings" should not be read as "smooth". Recurring means PSG excludes one-off items such as disposal gains. It does not mean income that is guaranteed to repeat.
The cost side of the machine is just as revealing. PSG does not report a separate research-and-development line; most of its technology spending is expensed as it goes rather than capitalised.7 Cash spent on property and equipment was about R59 million in FY2026, and additions to intangible assets about R57 million, tiny amounts next to more than R8 billion of core income.7 This is not a factory business. Its real investment is people, systems and the time it takes to recruit and settle advisers. In FY2026, technology and infrastructure costs grew about 9% and fixed pay about 8%, while core income grew about 22%.7 That gap is operating leverage in action: when the fee pool swells, a large share of each extra rand drops to profit. The same leverage works in reverse when fees shrink, which is one reason a slowdown in performance fees bites harder at the profit line than at the revenue line.
There are limits to what the company tells investors about this fee pool. PSG does not disclose average contract length, minimum commitments or a group-wide recurring-revenue percentage.7 It does say that no single external customer generated 10% or more of group income in FY2026, which with more than half a million clients is unsurprising.7 What it does not publish, such as how much of its revenue comes from its top five or ten clients, simply is not available.
One thing that becomes clear from following the client is that PSG's three businesses are not really three businesses at all. They are three ways of earning from the same relationship. Which raises the competitive question: is that relationship durable enough to call a moat, or is PSG simply a well-run participant in a crowded market?
VI. Can the Adviser Network Keep Its Edge?
By FY2026, PSG had built a large network by South African standards.7 Yet the company itself says it still has a relatively small share of the market it serves.7 Both statements can be true, and the tension between them defines the competitive question.
Start with the field. PSG does not face a single rival; it faces different rivals in each part of its fee chain. In independent advice and investment platforms, it competes with other adviser networks, banks' wealth arms and life insurers' tied agents. In asset management, it competes with specialist managers such as Coronation, Allan Gray and Ninety One for the same retirement and discretionary savings. In insurance distribution, it competes with brokers, direct insurers and the big diversified groups such as Sanlam. Treating every financial company as a direct peer would flatten the picture.
Scale comparisons need the same care. PSG's total assets under management were about R565 billion at the end of FY2026 and about R594 billion by August 2026.21 Coronation reported about R746 billion at March 2026.9 Ninety One reported about R4.0 trillion at September 2026, built on a much broader international footprint.10 On that measure, PSG is in the same weight class as Coronation and far smaller than Ninety One. But the comparison is imperfect: PSG's figure includes assets it manages for clients through its Wealth business, while Coronation's is almost entirely third-party fund management, and the dates differ.
So what could make PSG's network hard to displace? Five candidate powers come up, and the evidence for each varies.
The first is local advice. A trusted adviser in a town where the client lives is not easily replaced by an app or a call centre. That is plausible and consistent with the growth in clients, but PSG does not publish client churn, so the strength of the bond remains a matter of inference.
The second is breadth of product. Because PSG offers investment platforms, funds, stockbroking and insurance under one roof, an adviser can serve most of a household's financial needs without leaving the group. That is evidenced by the integrated structure, but PSG does not disclose how many clients use more than one division, so cross-selling depth is unproven.
The third is brand, which counts for something in a market where trust is the product. The fourth is adviser economics, the design that began with the 2014 share transaction, where advisers who share in platform value have a reason to stay. The fifth is the cost advantage of a shared platform, technology and compliance function spread over a larger book. Each of these is a management claim with partial evidence behind it; none comes with a published retention or cost-per-client figure that would settle it.
There is one place where the links between the three businesses can be seen in the money. In FY2026, PSG earned about R1.12 billion of revenue from PSG unit trusts, the in-house funds into which clients' money flows.7 Related-party receivables were about R186 million at year-end, and PSG paid R264 million of fees to unit trusts during the year, up from R77 million.7 Those flows are material, and they show how strongly the group's fee engine depends on clients choosing PSG's own funds.
It would be tempting to turn that into a neat percentage of revenue. That would be a mistake. Intersegment fees are described as market-related and eliminated on consolidation, and the revenue definitions behind the unit-trust figure and group core income differ, so dividing one by the other does not give a clean share.7 What can be said is that the in-house funds are an important link in the chain, which makes their investment performance and pricing doubly important. If PSG funds lag badly, advisers face pressure to move clients elsewhere, and the group loses at more than one link.
The diversification signals are real: more than half a million clients and no single customer above 10% of income.7 But the most important evidence for a moat, adviser retention, client retention and the trend in fee rates, is not published. So the verdict is narrower than the brochure version. PSG has credible distribution scale and a broad product suite. The evidence supports a strong platform more clearly than a locked-in moat.
Technology is the wild card in this contest. PSG says it is investing in digital automation and exploring artificial intelligence.7 For a platform, that could cut the cost of servicing each client and let advisers handle larger books. But the same tools lower the cost of basic advice for everyone, including low-cost digital rivals, and so put pressure on what clients are willing to pay for simple portfolio construction and administration.7 The human adviser's defence is that regulated, accountable advice on a whole household's affairs is harder to automate than a model portfolio. That defence is credible for complex, wealthier clients. It is weaker at the simpler end of the market, where the fee for advice may come under the most pressure.
Geography also concentrates the bet. About 92% of PSG's FY2026 external income came from South Africa.7 Its fortunes are therefore tied to South African savers, South African markets and the rand, which is both a focus and a limitation. Ninety One's global reach gives it a different set of opportunities and risks; PSG's network, for now, is a domestic franchise with a small offshore wealth presence.
What would falsify even the narrower claim? A wave of adviser departures, net inflows turning negative in a weak market, falling fee rates as cheaper platforms and passive funds compete, or a prolonged spell of underperformance in PSG-managed funds. None of those has shown up in the published record so far. The question is how much of PSG's growth has come from that network, and how much from the deals it has done along the way.
VII. The Small Deals—and the R51 Million Exit
In 2015, PSG Konsult made a move that looked small on the page and revealing in practice. It bought 70% of DMH Associates, a wealth-advisory business in Mauritius, and turned it into PSG Wealth Mauritius.11 It was not a transformational deal. It was the adviser model exported: buy an established local practice with client relationships, plug it into the PSG platform, and let the network extend across a border.
The price the company paid for that 70% is not disclosed in the FY2016 results, and neither is the business's subsequent contribution to group earnings.11 That absence is typical of PSG's dealmaking, and it shapes what any outsider can conclude about it. The company has made a series of modest additions over the years, adviser practices folded into the network and books of business consolidated onto the platform, but rarely with enough disclosure to calculate what was paid relative to what was acquired.
That makes the honest verdict on acquisitions a narrow one. An investor cannot compute a purchase multiple for most of these deals, cannot track their post-deal returns and cannot say whether PSG overpaid. Nor can the deal record explain much of the long-run growth rate, because none of the disclosed transactions is large enough to account for it. The evidence points to selective expansion, not to an acquisition machine.
A decade after Mauritius, the more instructive transaction ran the other way. PSG sold Western Namibia, the Namibian arm of its insurance underwriter, to Santam Namibia for R51 million in cash.2 The disposal produced a gain of about R56.5 million in the FY2026 accounts.2 Because PSG treats such gains as non-recurring, the gain lifted reported earnings but was excluded from recurring headline earnings, the measure used throughout this story.2
Why sell? A small insurance book in a neighbouring country carries its own regulatory capital, its own systems and its own management attention, and an underwriter benefits from scale in a way an advice business does not. Selling it to Santam, one of the region's largest short-term insurers, at a price above book value is the sort of portfolio pruning that tidies the group without changing its character. The gain above book suggests a willing buyer valued the book more highly than PSG's accounts did, which is a modest point in management's favour.
The more consequential capital decisions sit closer to home. PSG has repeatedly said it prefers organic growth to acquisitions.7 Its deployment record in FY2026 supports that. The company spent about R297 million buying back and cancelling 12.3 million of its own shares during the year, after spending about R330 million on 19.1 million shares in FY2025.7 It continued paying dividends, and it kept investing in advisers and technology.7
The shift towards buybacks shows up in the dividend line too. For most of the past decade, cash dividends paid out ran at roughly 40% to 50% of net profit, with a median a little above 40%; in FY2026 the payout drifted to the low end of that range, about 40%, even as the rand amount of dividends rose.2 In other words, the extra profit of a boom year was returned partly through cancelled shares rather than larger cheques. That is a reasonable choice when management believes the shares are cheap. It becomes a harder one to defend when the share price sits at a premium to its own history.
Those buybacks are worth a moment of arithmetic. The FY2025 repurchases worked out at an average of about R17 a share, and the FY2026 repurchases at about R24.7 With the shares now trading at roughly R30, both sets of purchases look well-timed in hindsight. That is not proof of skill, since a rising share price flatters any buyback after the fact, but it does mean the cash returned through cancellations has so far bought earnings at prices below today's.
One possible confusion should be cleared up. PSG Treasury, a wholly owned subsidiary, issues debt instruments, and the name can make the group look more leveraged than it is.7 The FY2026 integrated report states that interest-bearing borrowings were nil in both FY2026 and FY2025; lease liabilities, mostly office rentals, were about R339 million.7 This is not a business funding its growth with borrowed money.
So the deal record tells a quieter story than the profit growth might suggest. If acquisitions did not drive the acceleration, and debt did not fund it, the next suspect is the one hinted at in the opening scene: the markets themselves.
VIII. The Year the Market Helped—and the Half-Year It Didn’t
In April 2026, PSG's annual results read like a victory lap. Recurring headline earnings per share had surged.2 Return on equity reached about 32%.2 Assets under management had pushed past R560 billion. Share buybacks had shrunk the share count. On the surface, everything was compounding at once.
Six months later the same machine had downshifted under lower performance fees, lower insurance investment income and storm claims.1 Group recurring earnings per share grew 5%.1 The question for any long-term investor is which year was the outlier, and how much of FY2026's acceleration a less helpful market would leave behind.
Start by reconciling the measures. PSG's preferred figure is recurring headline earnings, which strips out items such as disposal gains and other non-operating effects. Net profit attributable to shareholders, the conventional accounting figure, rose about 36% in FY2026 in rand terms and has grown at about 22% a year over three years.2 The two measures tell broadly the same direction, but recurring headline earnings is the better window into the operating business, because it excludes one-offs like the Western Namibia gain. That is the measure this story uses for the operating narrative.
Now peel off the market-sensitive layers one by one. The first is performance fees, which rose in FY2026 and fell sharply in the August 2026 half-year.21 In cents, the gap between FY2026's 135 cents and the 122.5 cents excluding performance fees is about 12.5 cents a share.2 That is the bonus PSG's fund managers earned in a strong year for their funds, and it is precisely the part that vanishes when relative returns cool.
The second layer is investment income and fair-value gains. In FY2026, investment income of about R437 million and net fair-value gains of about R277 million together came to roughly 27% of profit before tax of about R2.6 billion.7 A year earlier, the same two lines totalled about R500 million against profit before tax of about R1.9 billion, or roughly 26%.7 The share did not explode, but the fair-value gains jumped, mostly from unrealised gains on financial assets.7 Some of that income backs policyholder and client liabilities and is not entirely the shareholders' to keep, but it flows through reported profit and makes it move with markets.
Currency adds a thinner layer of its own. The rand is PSG's reporting currency, but clients hold offshore funds and policyholder investments, and PSG took no hedging cover on its foreign-currency balances in FY2026 or FY2025.7 Net foreign-exchange losses were small in both years, single-digit millions of rand, so this is a ripple rather than a wave.7 But a weaker rand lifts the rand value of offshore assets and the fees on them, so currency is one more way markets can flatter or deflate reported growth.
The third and biggest layer is the level of assets themselves. When markets rise, assets under management rise even if no new client walks through the door, and management fees rise with them. That is why the change in assets alone cannot settle the durability question. A billion rand added by market appreciation can be taken away by the next correction. A billion rand added by a client choosing PSG is stickier.
Here PSG offers some evidence of real growth. Wealth recorded about R24.9 billion of positive net inflows into managed assets in FY2026.2 Asset Management recorded about R4.9 billion of net inflows into its funds.2 Against Wealth's managed assets of about R481 billion, that inflow represents roughly 5% of opening assets arriving as new money, a respectable organic growth rate for a mature wealth business. It is the strongest single piece of evidence that the engine is doing more than riding the market.
Put the clues together. FY2026 had three tailwinds: unusually high performance fees, buoyant investment income and fair-value gains, and rising asset values. Underneath, there was genuine growth: earnings per share excluding performance fees up 26%, positive net inflows and a Wealth division that kept compounding into the next half-year. The August 2026 interim showed the reverse of the tailwinds with the core still intact, and earnings excluding performance fees still rose 11%.1
The most defensible conclusion is that PSG's underlying growth is real but slower than FY2026's headline, and more exposed to markets than the word "recurring" implies. A reasonable investor would treat something like the 11% interim figure, rather than the 34% annual figure, as the more honest read on the engine's current pace, while recognising that even that number is not free of market effects.
Management's explanation of the interim—that performance fees and insurance investment income were lower, and storms generated claims—is plausible and specific.1 It is also testable. If those were the true drivers, the next set of results should show Insure recovering as claims normalise, Asset Management earnings tracking market levels and fund performance, and Wealth continuing to grow with inflows. If Wealth's growth also slows, or net inflows turn negative, the explanation will look incomplete.
There is one more question hidden inside earnings growth, and it is less glamorous but just as important. Profit is an opinion; cash is a fact. In a group that handles so much of other people's money, what does cash generation actually mean?
IX. The Cash That Belongs to Clients
Open PSG's FY2026 cash-flow statement and the first number looks reassuring: net cash from operating activities of about R1.34 billion.7 Look one line higher and the picture becomes strange. Cash "utilised in operations" was negative, about R2.38 billion.7 For a company that just reported record earnings, that looks like a red flag. It is not, but understanding why is the key to reading this business correctly.
PSG's accounts mix two kinds of money. There is the group's own money, the fees it earns and the costs it pays. And there is money that belongs to clients and policyholders: cash in stockbroking accounts waiting to settle, balances in funds PSG consolidates because it controls them, and assets backing insurance policies. Because PSG's subsidiaries hold or control these balances, they sit on its balance sheet and flow through its cash-flow statement, even though they are not shareholders' money.
PSG helpfully splits the two. In FY2026, the group's own balances generated about R1.78 billion of cash from operations.7 Client-related balances used about R4.16 billion, mainly because of movements in stockbroking balances and consolidated funds.7 The year before, own balances generated about R1.97 billion while client-related balances used about R2.55 billion.7 The client swings are large and lumpy, and they say almost nothing about the health of the business; they say a lot about how busy clients were and when trades settled.
An analogy helps. Think of a busy conveyancing attorney who holds clients' deposits in a trust account while property deals settle. On the day a large sale closes, millions leave the trust account, and a naive reading of the bank statement would say the practice had a disastrous day. In fact the firm's own fee income was untouched; the money simply belonged to someone else and went where it was always going. PSG's stockbroking settlements and consolidated funds behave the same way, only at a much larger scale.
That is why conventional cash conversion ratios and free-cash-flow yields, the tools investors use to test whether an industrial company's profits are real, do not work as a standalone thesis here. A free-cash-flow yield calculated from group operating cash flow in one year would look very different from the next for reasons entirely unrelated to PSG's own profitability. Debtor days and working-capital measures suffer the same distortion: stockbroking receivables and client balances swamp the trade debtors of the operating business.
The own-balance figure is the better starting point, but it needs one adjustment of its own. The FY2026 own-balance operations figure includes about R424 million transferred into unit-linked investments, which are investments tied to policyholder products.7 So own-balance cash generation is not a pure cash-earnings figure either. It is closer, and it tells a broadly healthy story: own-balance cash generation in the region of the group's profits, sustained across two years, while the company paid dividends and bought back shares.
The balance sheet needs the same separation. At FY2026 year-end, the group held about R2.67 billion in cash and cash equivalents, of which about R2.51 billion was classified as own balances and about R159 million as client-related.7 Deposits had an average maturity of 30 days or less and were held with externally rated banks.7 But the group also held large amounts of debt securities and unit-linked investments, much of which backs client or policyholder liabilities.7 An investor who added all of it up and called it "cash" would grossly overstate what is available to shareholders.
Receivables follow the same pattern. Total receivables were about R3.49 billion at year-end, but about R2.94 billion of that consisted of amounts due from brokers, clearing houses and client accounts.7 PSG notes that JSE trades near year-end generally settle within three days, and fee receivables from related funds are mainly February fees settled within a week.7 Trade receivables proper were only about R302 million.7 PSG classifies its exposed receivables as high quality, but it does not publish a simple group-wide ageing table showing how much is overdue, so investors cannot track collection trends over time.
The lesson of this chapter is simple to state and easy to forget. In a business that handles client money, the first question about any cash figure is whose cash it is. On the evidence, PSG's own operations do throw off substantial cash, enough to fund dividends and buybacks without borrowing. Which turns the spotlight onto the people deciding where that cash goes.
X. Gouws’s Long Run, and the Incentives Around It
Francois Gouws has been chief executive of this business since 2013, and Mike Smith has been chief financial officer for the same span.7 That is more than a decade of continuity in a sector where executives often move on after a few years. When the company listed in 2014, Gouws was 49 and Smith 46; both were already running the business they still run today.5 Every decision in the standalone era, from the adviser share transaction to the buybacks, has been taken under the same leadership.
Long tenure cuts both ways. It means the people who designed the strategy are the ones accountable for it, and that the culture of the business has been stable through market cycles. It also means the board has a harder job: assessing whether the leadership that built the business is the right leadership for its next phase, and holding long-serving executives to account when results disappoint.
The pay numbers are the first thing an outside shareholder will notice. Gouws's total compensation rose to about R128 million in FY2026 from about R83 million in FY2025, an increase of about 54%.7 Smith's rose to about R42 million from about R28 million.7 Over the same year, recurring headline earnings per share rose 34%.2 Total compensation grew faster than the earnings it was supposed to reward.
Context tempers that comparison without erasing it. A large part of the CEO's pay is variable and share-linked, so it rises with the share price and with performance.7 His short-term compensation rose 26%, below the growth in earnings per share.7 The jump in total pay largely reflects long-term incentives vesting after a strong run in the share price. That is how share-linked pay is supposed to work: when shareholders do well, executives do too. But it also means a year like FY2026, flattered by performance fees and market gains, pays out generously, and shareholders should watch whether pay falls as readily in a weaker year.
Ownership is the second lens. Directors held about 22% of the shares at the end of FY2026, and management about 1%.7 Some of the directors' holding is linked to the Mouton family, whose trust owns 13.9% of the company.7 Those are not identical interests; a founding family trust and a salaried executive may have different horizons and different views on risk. But together they mean the people at the top of the company are, collectively, among its largest owners, which is a meaningful alignment mechanism.
The third lens is the shareholder vote. At the annual general meeting on 23 July 2026, all resolutions put to the vote passed, while one ordinary resolution was withdrawn.12 But 23.56% of votes cast opposed the reappointment of Patrick Burton to the audit committee.12 Burton has been on the board since at least the 2014 listing, when he was an independent non-executive director.5 Long tenure is a common reason institutional investors and proxy advisers question whether a director is still independent enough to sit on an audit committee. A quarter of votes against one director is a real signal. It is not a broad revolt; it is a specific governance concern that the board will have to address or explain.
The fourth lens is capital allocation. The record under this management team is steady rather than dramatic: a dividend paid every year, buybacks in recent years, modest acquisitions, a disposal at a gain, and continued investment in people and technology.27 Headcount rose only about 2% in FY2026, to about 3,370, even as income surged, which is the operating leverage of a shared platform showing up in the staff numbers.7
The audit record adds a quieter layer of reassurance. The auditor issued an unmodified opinion on the FY2026 financial statements, and the audit committee flagged the valuation of intangible assets, largely the value of acquired client books and businesses, as the significant judgement in the accounts.7 That is the right place for scrutiny in a company built partly from purchased adviser practices: if those books were bought too dearly, the evidence would eventually appear as impairments. PSG also disclosed ordinary-course litigation and letters of support to certain subsidiaries, but no pending or threatened legal matter that could materially affect the group's financial position.7 Board renewal has continued alongside the long executive tenures; Janine Johannes joined as an executive director after Prudential Authority approval in March 2024.7
The test of all this is per-share value. In FY2026, return on equity of about 32% comfortably exceeded any reasonable estimate of the cost of equity for a South African financial company, and buybacks reduced the share count while earnings per share grew faster than profit.2 Over the longer run, net profit has compounded at about 20% a year for five years.2 On the evidence, capital has been allocated in a way that grew value per share.
What remains unproven is how management behaves when the tailwind stops. The cleanest credibility test is not the language in the integrated report about long-term thinking. It is whether pay, buybacks and dividends adjust sensibly in a weaker year, and whether per-share earnings keep growing when markets do not. That test may already be beginning, and it is the right lens for weighing the investment case as a whole.
XI. Analysis & Bear vs. Bull Case
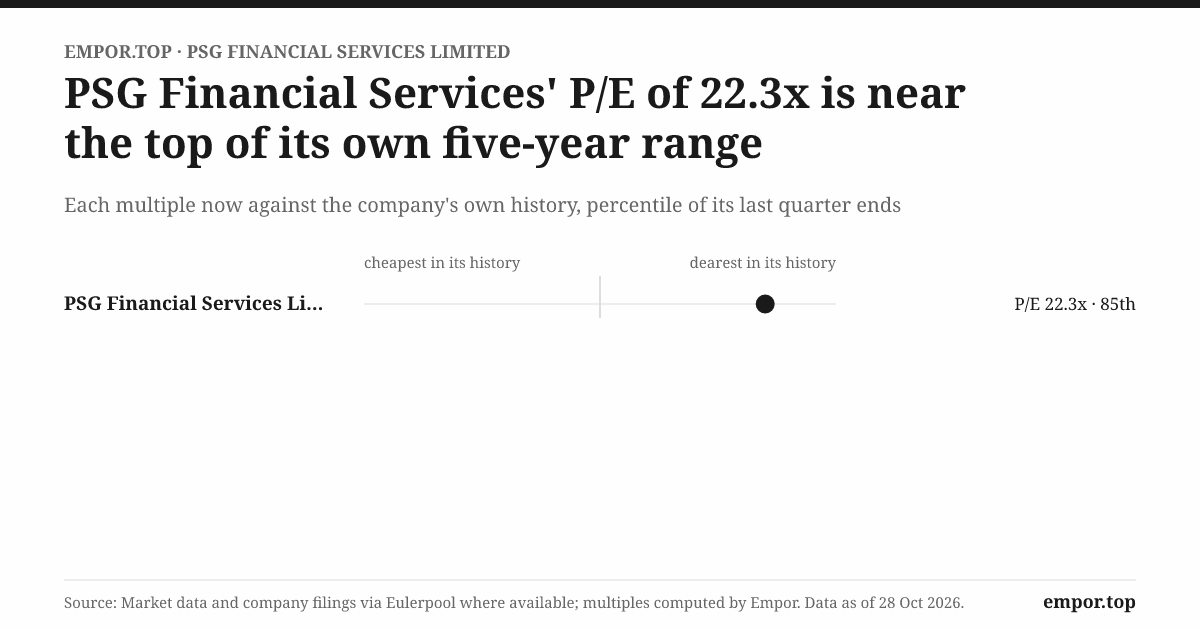
At around 22 times trailing earnings, PSG's shares sit above their own five-year median of about 19 times. Earnings per share over the twelve months to August 2026 were about R1.36, which implies a share price of roughly R30 and a market value of about R38 billion. Those figures rest on market data rather than company filings, and some data services report the company's US-dollar market value and enterprise value in ways that do not reconcile, including negative enterprise values that are impossible to square with a company carrying no interest-bearing debt.7 An investor should check a live share price before relying on any precise multiple. The broad picture is clear enough: the market is paying a premium to PSG's own history just as earnings growth slows from an exceptional year.
That premium is even starker against peers. Recent market data showed Coronation trading at about 9 times earnings, Ninety One at about 10 times and Sanlam at about 12 times.131415 Those observations are not all taken on the same date, so they are context rather than a precise screen. Still, PSG trades at roughly twice the multiple of the listed asset managers it competes with. The market is clearly treating it as something other than an asset manager: as a distribution franchise with steadier growth and a higher return on capital.
Is that justified? The question comes down to the moat, so it is worth running the argument through once, carefully.
Begin with the five forces that shape profitability in an industry. Buyer power is low at the level of individual clients, because PSG's half a million clients are fragmented and no single one generates even a tenth of income.7 But the real buyers of PSG's platform are, in a sense, its advisers, who choose where to place their practices and their clients' money. Advisers are the scarce resource in this industry, and they have alternatives. Supplier power shows up the same way: product providers, rival platforms and asset managers compete for both advisers and assets. The threat of new entrants is moderate; building a national adviser network takes many years, but digital platforms and robo-advisers can attack the simpler end of the market. Substitutes are real, including passive funds, direct investing apps and bank wealth products, each pressing on fees. And rivalry is intense in every one of PSG's three businesses.
Now the seven powers framework, which asks what structural advantage lets a company earn returns above its cost of capital for long periods. Scale economies are partially evidenced: costs are growing more slowly than income, which is what a shared platform should deliver.7 Switching costs exist in principle, because moving a portfolio, a retirement annuity or an insurance schedule is a hassle, and because advisers who hold PSG shares have something to lose by leaving. But PSG does not publish client or adviser retention, so the strength of that power cannot be measured. Branding counts for something in a trust-based business, but it is not obviously stronger than the brands of the larger insurers and managers. Network effects in the usual sense, where each additional user makes the product better for others, are weak. Counter-positioning, cornered resources and process power are not clearly evidenced. That leaves scale and switching costs as the two most plausible powers, and both are only partly proven.
The bull case, at its strongest, runs like this. PSG's nearly three-decade-old adviser network has reached substantial scale.7 It has recorded positive net inflows in Wealth and Asset Management.2 Return on equity was about 32% in FY2026, it carries no interest-bearing debt and its insurance arm held a capital cover ratio of about 260% against a 100% minimum.27 Credit agency GCR affirmed its rating at AA-(ZA) long term and A1+(ZA) short term, with a stable outlook, in July 2026, citing its expectation of sustainable growth in assets and performance through the cycle.16 Earnings excluding performance fees continued to grow in the weaker half-year.1 Advice-led businesses with this profile can compound for a long time.
The bear case, at its strongest, runs the other way. Market-sensitive income contributed to recent growth, and the performance fees and fair-value gains that flattered FY2026 have since reversed. Insure earnings fell in the latest half-year.1 PSG does not publish the metrics that would prove its moat: client retention, adviser retention, fee rates over time and net flows through weak markets. The fee pool faces constant pressure from cheaper products, and the multiple is at a premium to the company's own history and roughly double those of listed peers. A premium multiple on top of peak-cycle earnings is a double exposure.
A skeptical activist, sitting down with the annual report, would push on four points. The first is disclosure: a company that asks to be valued as a distribution franchise should publish the franchise metrics, adviser retention, client retention and fee rates, rather than leaving investors to infer them from headcounts. The second is related-fund dependence: with more than a billion rand of revenue coming from PSG's own unit trusts, the activist would want a regular split of in-house versus third-party assets and flows, so investors can see whether advisers steer clients to PSG products because they are best or because they are convenient.7 The third is pay: total CEO compensation rose faster than earnings in a year flattered by markets, and the activist would ask how much of that payout depended on performance fees that have since evaporated.7 The fourth is capital: with own-balance cash generation strong and no debt, the activist would ask whether buybacks at a premium multiple still beat higher dividends. None of these is a sign that something is wrong. Each is a place where better disclosure would let the market price the business with more confidence.
The credit rating deserves a careful place in this argument. It is evidence of financial strength, of a business unlikely to get into balance-sheet trouble. It is not evidence about the quality or durability of earnings growth, and it says nothing about whether the equity is fairly priced.
Weighing the two cases, the history narrows rather than rejects the bull thesis. PSG is clearly a strong, well-capitalised, high-return platform with a real distribution advantage. What the record does not yet show is that the advantage is durable enough to justify paying a premium for earnings in a year when markets did a lot of the work. The case would strengthen if PSG keeps growing earnings excluding performance fees at double-digit rates through a weaker market, and weaken if net inflows stall or advisers start to leave.
That brings the story to the KPIs that matter most. There are three. The first is recurring headline earnings per share excluding performance fees, which continued to grow in the August 2026 half-year after stronger growth in FY2026.12 The second is net inflows, which were positive in Wealth's managed assets for FY2026 and offer the cleanest read on organic growth.2 The third is divisional earnings, especially whether Asset Management and Insure recover from their latest half-year declines.1 Those three numbers will say more about the durability of PSG's engine than any amount of management commentary. And they point back to the lessons this company's history has to teach.
XII. Playbook: Business & Investing Lessons
Go back to 2014, to a moment that looks like administrative plumbing: PSG Konsult's adviser share deal.6 Twelve years later, the network had grown substantially.7 Between those two moments lie most of the lessons of this story.
The first lesson is that a financial platform grows one trusted relationship at a time, and that the platform's real job is to keep the people who own those relationships on side. PSG did not out-invent its competitors. It made its advisers co-owners, and it built a platform around them. The broader point for founders is that in any business where a person owns the customer relationship, from medical practices to wealth managers to architecture firms, the incentive design for that person is the strategy. Get it wrong and the platform is a landlord. Get it right and it is a partnership that compounds.
The second lesson is that a rising market can make a good engine look faster than it is. FY2026's 34% growth in recurring headline earnings per share was real, but performance fees later fell sharply.21 For investors, the discipline is to always ask what earnings look like with the market's contribution stripped out, and to price the business on that number, not the headline. A fund manager's best year is often the worst moment to pay up for it.
The third lesson is that cash has to be separated by whose cash it is. PSG's cash-flow swings reflected client balances, not just its own profitability.7 Any investor who applied a standard cash-conversion test without that separation would draw exactly the wrong conclusion. The wider principle applies to brokers, payment companies, insurers and marketplaces alike: before judging a cash figure, find out who owns the money.
The fourth lesson is that a buyback is only as good as the price and the earnings that follow. PSG's recent buybacks look sound so far.7 But the measure of a buyback is not the announcement. It is per-share earnings and value after the market turns, and whether the company keeps buying when its own shares trade at a premium multiple.
Put the four together and they amount to one compact idea: the people who own the relationships are the asset, the market is a tailwind that comes and goes, and value is measured per share, after separating what belongs to the company from what belongs to its clients. Which leaves only the question of what comes next.
XIII. Epilogue
Tonight, in late October 2026, PSG Financial Services stands at an interesting point. Its most recent half-year was its weakest growth period in some time, yet its share price still reflects confidence built during an exceptional year. The engine underneath is still running: Wealth earnings rose 14% in the half-year, and the group reached about R594 billion in assets under management by August.1 The tailwinds that flattered FY2026 have faded.
The next moment that matters is the full-year result for the year to February 2027, due around April. That report will show whether the August interim was a pause or the start of a slower phase. If recurring earnings per share excluding performance fees keep growing at around the 11% interim pace, the engine story holds, and the market's premium becomes easier to understand. If that figure slows towards single digits, the premium will be harder to justify.
Watch the net inflows separately from asset growth. If clients keep bringing new money to PSG while markets wobble, the distribution advantage is doing its job. If assets fall with markets and flows turn negative, it will become clear how much of the growth was the market's work, not the network's. The adviser count is worth watching too; a falling number of advisers would be the earliest warning sign of trouble in the network. Retention, if PSG ever chooses to disclose it, would settle the question more decisively than any other figure.
There are, broadly, three ways the next year could unfold. In the first, markets steady, performance fees return in part, Insure's claims normalise and Wealth keeps compounding; FY2027 then looks like a modest but healthy year, and FY2026 looks like a high-water mark rather than a mirage. In the second, markets drift sideways, performance fees stay low, and growth rests entirely on net inflows and cost discipline; the engine is then exposed in its purest form, and its pace becomes the number that matters. In the third, markets fall hard, assets shrink, and clients grow nervous; that is the scenario in which the adviser relationship either proves its worth by holding clients in place, or reveals that much of the past growth was borrowed from the market.
Watch the divisions. Asset Management needs fund performance good enough to restart performance fees and keep clients in PSG's funds. Insure needs to show that it can grow earnings without unusually benign claims or high investment returns; a calmer storm season would help, but the real test is underwriting discipline across a full cycle.
And watch the governance signals. The 2027 annual general meeting will show whether the board responds to the 23.56% vote against Patrick Burton's audit-committee reappointment.12 The next remuneration report will show whether executive pay falls in line with a softer year as readily as it rose in a strong one. Buybacks at a premium multiple would be a different decision from buybacks at R17.
The central tension remains exactly where the story began: whether PSG's credible distribution engine can carry a premium multiple through a weaker market. The next few results will start to answer that question.
XIV. Outro
Go back to the adviser's office, the one in a country town or a city suburb, where a client sits down to talk about retirement or the house or what to do with an inheritance. Nothing in that room looks like a stock-market story. But from that conversation, fees ripple out across a platform, a fund range and an insurance book, and they eventually show up as recurring headline earnings in a results release on the JSE news service.
That is what PSG Financial Services really is: a distribution business. Its 976 advisers serve more than half a million clients and help steer close to R600 billion of assets.71 For a year, the market did a lot of the work. Then, for six months, it offered less help. The durable part of the story was never the performance fee or the fair-value gain. It was the relationship that brought the client back.
The market can lift the assets; only the adviser can keep the client.
References
-
Unaudited Interim Results for Six Months Ended 31 August 2026 — PSG Financial Services, 2026-10-15 ↩↩↩↩↩↩↩↩↩↩↩↩↩↩↩↩↩↩↩↩↩
-
Reviewed Results for Year Ended 28 February 2026 — PSG Financial Services, 2026-04-16 ↩↩↩↩↩↩↩↩↩↩↩↩↩↩↩↩↩↩↩↩↩↩↩↩↩↩↩↩↩
-
Listing of PSG Konsult on the Main Board of the JSE Limited — PSG Konsult, 2014-06-09 ↩↩↩↩↩↩↩↩↩↩↩↩↩↩
-
Results for Six Months Ended 31 August 2014 — PSG Konsult, 2014-10-08 ↩↩↩↩
-
Integrated Report 2026 — PSG Financial Services, 2026-05-25 ↩↩↩↩↩↩↩↩↩↩↩↩↩↩↩↩↩↩↩↩↩↩↩↩↩↩↩↩↩↩↩↩↩↩↩↩↩↩↩↩↩↩↩↩↩↩↩↩↩↩↩↩↩↩↩↩↩↩↩↩↩↩↩↩↩↩↩↩↩↩↩↩↩
-
The Crown Club: PSG Financial Services — Coronation Fund Managers, 2026-10 ↩
-
Coronation Fund Managers Interim Results — Coronation Fund Managers, 2026 ↩
-
Reviewed Results for Year Ended 29 February 2016 — PSG Konsult, 2016-04-14 ↩↩
-
Results of the Annual General Meeting — PSG Financial Services, 2026-07-23 ↩↩↩
-
Credit Rating Affirmed with Stable Outlook — PSG Financial Services, 2026-07-28 ↩
 LinkedIn
 WhatsApp
 Reddit
 Hacker News
 Email
 Kindle
 RSS Feed
 Spotify
 Apple Podcasts
 Amazon Music
 Audible
 YouTube