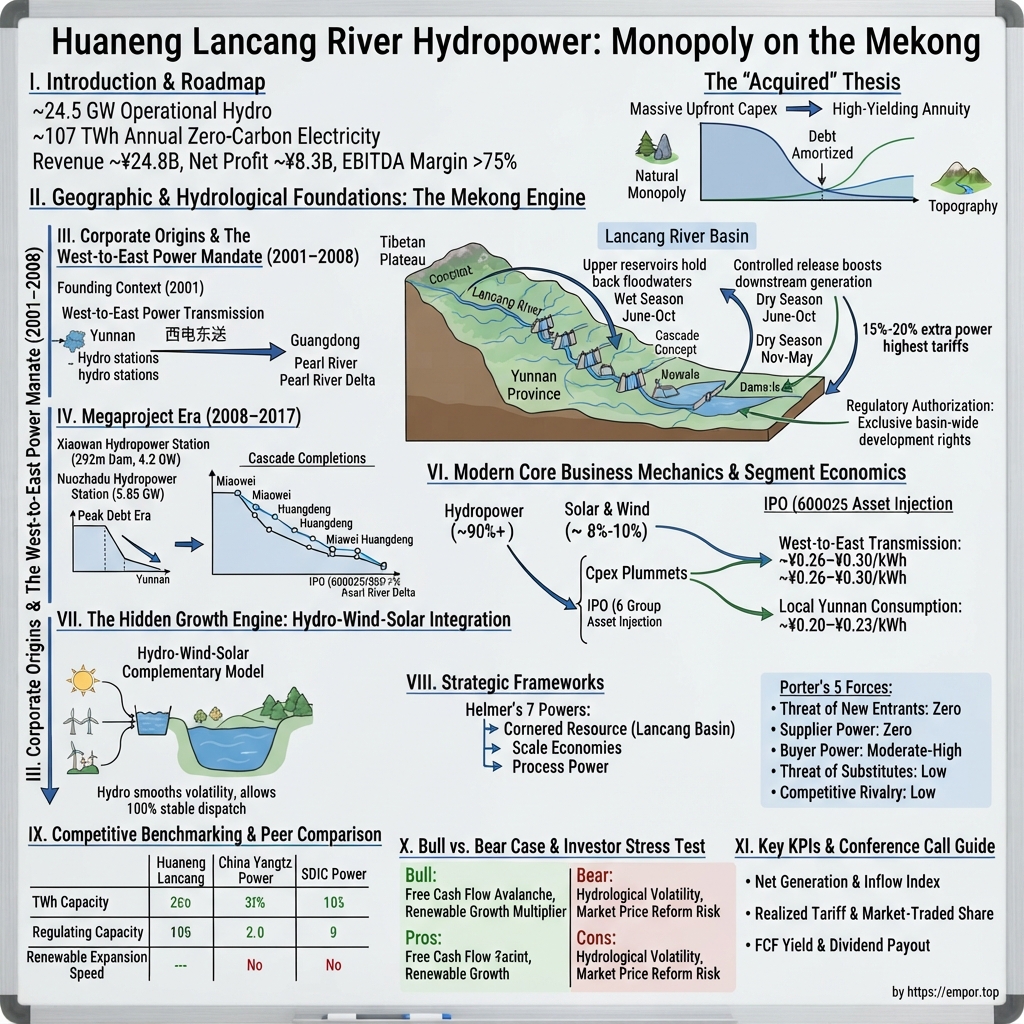
Huaneng Lancang River Hydropower: Monopoly on the Mekong
I. Introduction & Episode Roadmap
The Asset
Stand on the crest of the Xiaowan dam and the first thing you notice is that you cannot see the bottom. The concrete curves away beneath your feet for 294.5 meters — the world's first 300-meter-class double-curvature arch dam — pinched between two granite walls in a gorge so narrow that the Lancang River below looks like a green thread someone dropped. Behind the wall sits roughly 15 billion cubic meters of stored water, of which nearly 10 billion can be released and refilled within a single year. In front of you, that water falls through six turbines of 700 megawatts each and emerges as electricity that will travel more than a thousand kilometers east to power air conditioners in Guangzhou — and, closer to home, aluminum pot lines across Yunnan.12
This is the physical asset at the center of 华能澜沧江水电股份有限公司 Huaneng Lancang River Hydropower Inc. — ticker 600025.SS, listed on the 上海证券交易所 Shanghai Stock Exchange. And it is one of eight large reservoirs the company has strung down the Yunnan reach of the Lancang, the river that becomes the Mekong once it crosses into Laos.
The elevator pitch writes itself. A single Chinese state enterprise holds the development rights to an entire river basin. It has built a cascade of dams down that basin over twenty-five years. Water arrives for free, forever. Once the construction debt is paid, what remains is an annuity with a marginal cost close to zero. No competitor can build a dam upstream of yours, because there is no upstream left, and no regulator would license one if there were.
What the Numbers Say — and What They Don't
The numbers give that pitch teeth — and then complicate it. In FY2025, the company generated 126.93 TWh of electricity, up 13.32% year on year, on 34,208 MW of commissioned capacity, of which 28,116 MW was hydro and 6,092 MW was wind and solar.32 Revenue reached ¥26.60 billion, net profit attributable to shareholders ¥8.50 billion, and operating cash flow ¥19.05 billion — meaning the business converted more than seventy fen of every revenue yuan into operating cash.3 Return on equity was 12.93%, up 1.08 points.3 By the end of June 2026, commissioned capacity had reached 37,261 MW.4
Now the complication, and it is the spine of this story. Generation rose 13.32% in 2025. Revenue rose only 6.89%. Net profit rose 2.50%.3 In the first half of 2026, generation rose again — 3.98%, to a record 54.85 TWh for the period — while attributable net profit fell 5.05% to ¥4.38 billion.4 A business whose physical output keeps setting records is not converting that output into proportional profit.
Two things are happening. The first is price. The company's blended on-grid tariff in 2025 was ¥210.58 per MWh, against ¥222.60 the prior year — a decline of roughly 5%.2 The second is depreciation. New units commissioned in 2024 and 2025 began depreciating immediately while earning a market price that keeps falling. Management's own explanation for the interim decline named three causes: capacity expansion, drier inflow at the high-tariff upstream stations, and depreciation on newly commissioned units.4
That is the tension this article works through. Cascade hydropower on an exclusively held river really is one of the better asset structures in global equity markets. But "monopoly on the Mekong" describes control of a physical resource, not control of a price. The buyer is a state grid operating inside a provincial market that is being rapidly reformed toward spot pricing, in a province where wind and solar capacity is growing faster than demand.3 The company's own annual report says so, in language unusually blunt for a Chinese state-owned enterprise: Yunnan's supply-demand balance is "relatively loose," and whether the spot market will reward the reservoirs' seasonal storage function "remains to be verified."2
The Questions
Three questions organize what follows. Does the cornered resource — the river — translate into durable pricing power, or only into durable volume? Is the pivot into wind and solar, marketed as a synergy with the existing dams, actually accretive on the numbers the company reports? And can the balance sheet fund ¥87 billion of remaining committed spending on two upper-basin megaprojects — one of which does not generate a kilowatt-hour until 2033 — while raising the dividend, without going back to shareholders again?2
The story starts with the water.
 Subscribe on LinkedIn
II. Geographic & Hydrological Foundations: The Mekong Engine
Head, Not Volume
The Lancang begins as meltwater on the Tibetan Plateau at roughly 5,200 meters and, over about 2,100 kilometers inside China, falls almost all of that elevation before it exits into Laos. Most of the drop happens in a corridor of parallel gorges in western 云南省 Yunnan Province, where the Lancang, the Nu, and the Jinsha run within a hundred kilometers of one another, separated by mountain ranges, in trenches sometimes two kilometers deep. It is one of the most concentrated stores of gravitational potential energy on the planet, and geologically it is a nightmare: active fault zones, monsoon-driven landslides, gorges so steep that access roads had to be blasted before construction could begin.
The physics matter here, and they are simple enough to state without equations. The power a hydro station produces is the product of two things: how much water passes through the turbine per second, and how far that water falls before it gets there. Double the drop, double the power. This is why the Lancang matters disproportionately relative to its flow. The river carries far less water than the 长江 Yangtze River, but it drops much harder — so a dam on the Lancang extracts more energy per cubic meter than a comparable dam downstream on the Yangtze.
That is also the structural reason Huaneng Lancang will never be the largest hydro company in China. 中国长江电力股份有限公司 China Yangtze Power Co., Ltd. operates roughly 71.8 GW of hydro capacity, about 16% of the national total, anchored by the Three Gorges complex.5 Huaneng Lancang's 28.1 GW of hydro is a different animal: less water, more head, a much steeper river, and — critically — better storage relative to flow.
A Battery Made of Elevation
That last point is the whole business. Consider what a river without dams does: it floods from June to October, when the southwest monsoon dumps most of the year's rain on Yunnan, then runs low from November to May. A run-of-river power station on such a river spills enormous volumes it cannot use in the wet season and starves in the dry season. It produces its electricity precisely when electricity is least scarce.
A reservoir with multi-year regulating capacity inverts this. Xiaowan and 糯扎渡水电站 Nuozhadu Hydropower Station between them anchor a cascade whose eight reservoirs hold combined regulating storage above 23 billion cubic meters.6 They catch the flood, hold it — for months, and in Xiaowan's case across years — and release it in the dry season, when Yunnan's own demand is highest and the price of a kilowatt-hour is highest. Every cubic meter released from Xiaowan in February then passes through every downstream station in the cascade, generating again at each one. This is what the industry calls 梯级开发 cascade development, and its economics are genuinely different from those of a single dam.
Think of it as a battery whose storage medium is elevation, whose charging is done by weather, and whose round-trip efficiency, unlike a lithium battery, does not degrade. The company's own framing of its core competitive advantage names this first: the Xiaowan-Nuozhadu-anchored cascade possesses "the strongest medium- and long-term regulating capability in the entire southern region."2
Where the Physical Moat Stops
It is worth being precise about what that claim does and does not establish. It establishes a physical capability that competitors in the region cannot replicate — no one else can build a 15-billion-cubic-meter reservoir in Yunnan because the sites are taken and the river is spoken for. It does not, by itself, establish that the company captures the economic value of that capability. Whether it does depends entirely on how the electricity market is designed. In a planned dispatch regime where dry-season power carries an administratively higher tariff, the storage converts directly into revenue. In a spot market that clears on short-run marginal cost, where solar floods the midday hours at near-zero bid prices, the value of stored water depends on whether the market pays for the flexibility rather than just the energy.
Huaneng Lancang's own 2025 annual report flags exactly this uncertainty as a named risk: as dispatch shifts from planned scheduling to spot clearing, "whether long-cycle stable operation can be achieved and the regulating role of the main hydropower reservoirs in storing wet-season water to supplement the dry season can be effectively realized remains to be verified."2 That sentence is the most important disclosure in the document. It is management conceding that the physical moat and the economic moat are not the same thing, and that the bridge between them is being rebuilt while they stand on it.
Which brings us to the question of how one company came to own the whole river in the first place.
III. Corporate Origins & The West-to-East Power Mandate (2001–2008)
A Geography Problem
In the late 1990s, China had a geography problem that read like an accounting error. The country's electricity demand was concentrated on the eastern seaboard — the Pearl River Delta, the Yangtze Delta, the factories that were absorbing global manufacturing at a pace no one had modeled. The country's cheapest energy resource sat two thousand kilometers to the west, falling down mountainsides in provinces with barely any industry to consume it. Yunnan had rivers and no load. Guangdong had load and no rivers.
The state's answer was 西电东送 West-to-East Power Transmission — a national program to build generation in the west and ultra-high-voltage transmission corridors to move it east. It was less an infrastructure project than an act of internal colonization by kilowatt-hour: Yunnan would supply the power, Guangdong would supply the demand, and the state would build the wires and set the terms.
Huaneng Lancang was created to execute the Yunnan half. The company was founded on February 8, 2001 as 云南澜沧江水电开发有限公司 Yunnan Lancang River Hydropower Development Co., with the then-State Power Corporation and its Yunnan subsidiary holding a majority and Yunnan provincial investment vehicles holding the balance. Its institutional ancestor was a preparatory office set up in 1999 for one project: Xiaowan.
Two Restructurings and a Share Register
Then the ground shifted. In 2002 the State Council dismantled the State Power Corporation and split its generation assets among five new central power groups. The Lancang stake landed with 中国华能集团有限公司 China Huaneng Group Co., Ltd., and the company took the name it carries today. This piece of bureaucratic history matters more than it sounds: the 2002 restructuring is what converted a provincial development vehicle into a central-SOE subsidiary, which in turn is what gave it access to central-government project approvals, policy-bank credit, and the political weight to hold basin-wide rights against provincial and competing central interests.
The shareholder structure that resulted still defines the company. As of the end of 2025, China Huaneng Group held 48.69%, 云南省能源投资集团有限公司 Yunnan Energy Investment Group held 21.94%, and 云南合和(集团)股份有限公司 Yunnan Hehe (Group) held 11.74%.3 Add Yunnan Energy Investment's three acting-in-concert subsidiaries and the Yunnan provincial bloc controls roughly 28.4% — a meaningful minority, and the structural expression of a bargain: the central government gets its power corridor, the province gets equity, tax revenue, and a claim on the electricity that stays home.3
That bargain is not merely ceremonial. It is the reason a material share of the company's output is sold inside Yunnan rather than exported, and the reason provincial industrial policy — attracting aluminum smelters, silicon producers, and more recently data centers — bears directly on the company's realized price. When Yunnan's government decides to court an energy-intensive industry, it is deciding the demand curve that Huaneng Lancang sells into.
What a Granted Moat Is Worth
That bargain also had to be negotiated in kind, not just in equity. Hydropower in China distributes its costs and benefits asymmetrically: the reservoir floods farmland and villages in one county, the tax revenue accrues under rules negotiated between province and centre, and the electricity may leave the province entirely. Each of those three flows had to be settled before a dam could be built, and none of them was settled once and for all. The pattern is visible in the company's current commitments — the Rumei project alone is expected to contribute more than ¥1 billion a year in local taxes once operating, which is the price of local consent as much as it is a fiscal fact.7
The engineering during those first years was brutal and largely invisible to public markets, because there were none. Building Xiaowan meant excavating a foundation in a seismically active gorge, pouring one of the tallest arch dams ever attempted, and resettling communities from a valley that would become a reservoir. Resettlement in particular was — and remains — the least discussed and most politically loaded element of Chinese hydro development. It is handled by provincial governments with company funding, it does not appear as a line item investors can easily track, and it constitutes a standing social and regulatory obligation that does not expire when the dam is finished.
For investors, the origin story carries a specific lesson. The moat here was not earned through competitive victory. It was granted, by a state that decided a single operator should develop the basin because cascade coordination requires unified control. That makes it extraordinarily durable against commercial competition and precisely as durable as state intent against everything else. The same authority that granted exclusive development rights sets the tariff regime, designs the spot market, approves the next dam, and decides how much of Yunnan's power goes east versus stays home. A cornered resource held at the pleasure of a single counterparty is a different asset than a cornered resource held by property right — and the distinction shows up in the numbers, as the last decade demonstrates.
IV. Megaproject Era: Engineering Xiaowan & Nuozhadu (2008–2017)
Xiaowan: Turning a Seasonal River Into a Dispatchable One
On September 25, 2009, Xiaowan's first 700 MW unit synchronized to the grid. Provincial officials at the ceremony described it as a landmark of the western development programme and of West-to-East transmission, and noted that the station would add some 6.2 TWh a year to Yunnan's system while addressing the province's chronic pattern of wet-season surplus and dry-season shortage.1 By August 2010 all six units were running, and the company controlled 4,200 MW of capacity sitting behind a reservoir that could hold water not just across seasons but across years.
The engineering achievement was real. The financial achievement was subtler and more important: Xiaowan converted the Lancang from a seasonal river into a dispatchable one. Before it, the middle-Lancang stations at Manwan and Dachaoshan were hostages to the monsoon. After it, the water they received had already been smoothed by an upstream operator with an incentive to smooth it. Every downstream turbine got a more valuable input without anyone spending a yuan on the downstream turbines.
This is the compounding mechanism the term "cascade" is meant to convey, and it deserves to be stated carefully because it is frequently overstated. Regulating storage does not create water. It moves water in time. The gain comes from three sources: less spillage during floods that would otherwise pass unused, more generation in the dry season when downstream stations would otherwise run at low head, and the ability to shape output within the day to match demand peaks. What it does not do is increase total annual inflow — which is why a genuinely dry year still hurts, as 2023 demonstrated.
Nuozhadu and Total Flow Control
Nuozhadu, downstream, came next and came larger: 5,850 MW across nine 650 MW units, first unit in September 2012, all nine in service by June 30, 2014, with a design annual output of 23.9 TWh.68 Where Xiaowan is a thin arch of concrete wedged into a gorge, Nuozhadu is a core-wall rockfill dam — a vast engineered embankment with a clay core — rising 261.5 meters, then the tallest of its type in China, and impounding 23.7 billion cubic meters to a normal level of 812 meters.68 Its open spillway was built to the largest scale in Asia, a reminder that on a monsoon river the capacity to safely dump water matters as much as the capacity to store it.8 With Nuozhadu operating, Huaneng Lancang held the top and the bottom of the Yunnan cascade. Water released from Xiaowan could be re-regulated at Nuozhadu before leaving the country. The company acquired something close to complete control of flow timing on the Chinese Mekong.
It also acquired an enormous amount of debt. Mega-dams are the purest expression of front-loaded capital: eight to twelve years of spending, zero revenue, then a step-change in output and a fifty-year operating life. Through this period the company was, in balance-sheet terms, a leveraged construction project that happened to own some operating power plants.
How large was the strain? A useful proxy survives in today's accounts. The company still carried roughly ¥89.5 billion of long-term borrowings at mid-2026, a decade after the mega-dams were finished and after years of deliberate deleveraging.4 At the peak of the Nuozhadu build, with two multi-billion-dollar projects running simultaneously and neither yet earning, the leverage was materially worse and the company was not listed, so no public market repriced it. That is the quiet advantage of state ownership in capital-intensive infrastructure: the build phase, which would terrify a public shareholder base, happens off the public tape and is funded by policy banks whose lending decision is a policy decision.
Then came the middle and upper Yunnan cascade, filled in station by station through the 2010s: Gongguoqiao, Miaowei, Huangdeng, Dahuaqiao, Wunonglong, Lidi. These are smaller than the two anchors and, critically, sit above Gongguoqiao where regulating capability is weak — they are closer to run-of-river plants that take what the mountain gives them. Their tariffs are higher than the fleet average, because upstream Yunnan power feeds different contract structures, which means the fleet's blended price is disproportionately sensitive to inflow at the top of the basin. That sensitivity would show up sharply a decade later.
The 2023 Stress Test, and Why It Reads Differently Now
The 2023 water year is the honest test of the cascade thesis, and it should be looked at squarely rather than filed under "temporary." Lancang inflow in the first half of 2023 ran roughly 25% below normal. First-half generation fell 25.44%, revenue fell 16.20% to ¥9.33 billion, and attributable net profit fell 17.93% to ¥3.15 billion — a genuine shock, compounded by cascade reservoir storage having been low entering the year.9
Here is the interesting part. Full-year revenue came in at ¥23.46 billion and attributable net profit at ¥7.64 billion — profit for the year rose against 2022, because tariffs increased enough to offset the volume loss.3 The cascade did what it was designed to do: reservoir drawdown converted a catastrophic first half into a merely bad year, and price offset volume.
But note the mechanism, because it is the one that has since reversed. In 2023, scarcity raised prices. Yunnan was short of power, industrial users were curtailed, and the market cleared high. That is the natural hedge in a hydro business — dry years are expensive years. It works only as long as the market is tight. When Yunnan flips to surplus, as the company now says it has, the hedge inverts: wet years produce lots of cheap electricity and dry years produce less electricity at prices that no longer spike, because 41 GW of wind and solar are standing by to fill the gap.10 The 2023 result is evidence that the cascade smooths physical volume. It is weaker evidence than it appears for the proposition that the business is insulated from hydrology in the market structure now being built.
That structural shift is a 2020s problem. In 2017, the problem was capital.
V. The IPO, Debt Deleveraging, & Capital Allocation (2017–2021)
A Defensive Listing
By 2017 Huaneng Lancang had built most of a river and owed for most of it. On December 15, 2017, the company listed on the Shanghai Stock Exchange, having priced 1.8 billion new shares at ¥2.17 — raising ¥3.906 billion gross and ¥3.778 billion net, with proceeds earmarked for three stations still under construction: Miaowei, Wunonglong, and Lidi, together adding 2,810 MW.1112
Two features of that IPO are worth dwelling on. First, the float was roughly 10% of enlarged capital. This was never a privatization; it was a partial listing that imposed disclosure discipline and provided a currency, while leaving control emphatically with the state. Second, the timing was defensive. The offering came after a period of weak earnings and, per contemporaneous coverage of the listing process, a history of administrative penalties disclosed in the prospectus — the sort of detail that gets omitted from retrospective narratives about disciplined capital markets access.13
The Deleveraging Flywheel
What followed was, on the operating numbers, the good decade. The mega-dams were finished. Capital spending fell relative to cash generation. Every year the company amortized principal, interest expense declined, and net income expanded without a single kilowatt-hour of extra volume or a single fen of extra tariff. This is the deleveraging flywheel, and it is the most reliable value creation mechanism in infrastructure: you do not need the business to improve, you only need to stop paying for the debt.
The evidence is in the leverage ratios. Gearing fell to 61.13% at end-2025 from 63.11%, and interest coverage improved to 4.41 times from 3.84.3 Management told investors in May 2026 that the blended cost of funding had fallen to 2.43% in 2025.14 For a company with roughly ¥89.5 billion of long-term borrowings on the books at mid-2026, each hundred basis points of funding cost is worth close to ¥900 million pre-tax — an amount comparable to a tenth of net profit, achieved through refinancing rather than operations.4
The Sichuan Injection: Testing the Capital Allocation Record
The company also expanded by acquisition, and this is where the capital-allocation record deserves scrutiny rather than applause. In 2023, Huaneng Lancang agreed to buy 100% of 华能四川能源开发有限公司 Huaneng Sichuan Energy Development from its own controlling shareholder and affiliates for ¥8.579 billion — a valuation representing a 135.61% premium to the parent-company book value of net assets.15 The target held 20 operating hydro stations totaling 2,651 MW plus the 1,116 MW Yingliangbao station under construction on the Dadu River, with total assets of ¥18.75 billion at end-2022.16
A related-party purchase from the controlling shareholder at a 136% premium to book is exactly the transaction a skeptical investor should interrogate. The company's justification was that Huaneng Group was honoring a non-competition undertaking made at IPO — the parent could not indefinitely hold hydro assets that competed with its listed vehicle.16 That is a legitimate reason for the transaction to happen. It is not a reason for the price.
So test it against outcomes. In FY2025, the Sichuan subsidiary produced revenue of ¥3.119 billion and net profit of ¥870.7 million.2 Against ¥8.579 billion paid, that is roughly a 10% earnings yield — respectable, though it arrived only after Yingliangbao's units entered service, which is to say the buyer paid a premium partly for a construction project it then had to finish. Yingliangbao's own budget was ¥12.69 billion, and it reached full commissioning during 2025.2 The honest verdict: the deal has worked out acceptably on current numbers, the price was set by state-directed valuation convention rather than arm's-length negotiation, and minority shareholders had no practical ability to contest it. That is the governance reality of this share register, and it applies to every future injection.
The People Running It
Leadership through this period has been continuous but not personality-driven, and it would be dishonest to dress it up. Chairman 孙卫 Sun Wei, 56, took the role in April 2023 and is the company's legal representative; pre-tax compensation in 2025 was ¥1.60 million, the highest among directors and executives.2 The career is entirely internal: office roles at the Diandong electricity bureau, then a climb through the Lancang company as deputy general manager, board secretary and chief legal counsel, then general manager, then chairman — with a concurrent executive directorship at the upper-Lancang subsidiary that is building Rumei.2 尹述红 Yin Suhong, director and general manager, followed a parallel path: production technology at the Xiaowan plant, deputy plant manager at Longkaikou, head of marketing at the upper-Lancang subsidiary, then general manager of the listed company's marketing arm.214 赵虎 Zhao Hu serves as board secretary and chief accountant.2
That biography pattern is worth naming. This is not a management team assembled for capital allocation skill; it is a team assembled from dam construction and power marketing. The chairman's concurrent role at the upper-Lancang subsidiary is a fair signal of where institutional priority sits, and the general manager's marketing background is a fair signal of where the current battle is being fought. Neither is a criticism. Both are useful predictors of what this company will choose to do with its cash.
What can be said about their credibility is bounded by what is observable. The company has held an A-grade information disclosure rating from the Shanghai Stock Exchange for seven consecutive years, and its FY2025 accounts carried a standard unqualified opinion from 致同会计师事务所 Grant Thornton.32 The 2025 annual report also discloses that the company cooperated with a national audit and an on-site inspection by the Yunnan CSRC bureau during the year, with no adverse findings disclosed.2 Those are positive but weak signals: absence of disclosed problems is not evidence of excellence. The stronger test is whether guidance and outcomes match, and that test is best applied to the period the company is in now.
VI. Modern Core Business Mechanics & Segment Economics
Two Segments, Two Margins
Strip away the hydrology and the geopolitics and this is a two-segment business, one of which is very good and one of which is not yet proven.
Hydropower generated 120.81 TWh in 2025, up 11.94%, producing ¥24.81 billion of revenue against ¥10.27 billion of cost.2 That is a gross margin near 59% on a product whose input arrives by gravity. Solar generated 5.78 TWh, up 57.58%, on revenue of ¥1.45 billion against ¥1.02 billion of cost — a gross margin near 29%.2 Wind, still tiny at 0.34 TWh, actually contracted 18.29%.2
Sit with those two margins for a moment, because they falsify a claim that gets made loosely about this company. The pitch for hydro-solar integration is that the incumbent dam operator is the lowest-cost solar developer, because it already owns the land, the grid connection, and the balancing capability. On the company's own segment disclosure, solar earns roughly half the gross margin of hydro. It may still be a good business — a 29% gross margin on a growing asset base is not nothing, and the incremental capital is far smaller per project — but as new energy grows from 17.8% of capacity toward a larger share, it dilutes blended margin rather than enhancing it.3 Growth in this mix is margin-dilutive by construction. Any framing that treats renewables expansion as a pure enhancement of the hydro franchise is not supported by the segment numbers the company files.
Where the Price Comes From
The tariff structure explains where the money actually comes from. Hydro realized ¥207.78 per MWh in 2025 — about 20.8 fen per kilowatt-hour.2 Solar realized ¥253.12 per MWh and wind ¥483.33 per MWh, though wind's volume is too small to move the blend.2 Blended realization across the fleet was ¥210.58 per MWh.2
To calibrate: Yunnan's coal-fired benchmark price sits at ¥338.5 per MWh, and the province's clean energy market average transaction price was around ¥216.7 per MWh in 2024.17 Huaneng Lancang's hydro therefore clears meaningfully below thermal benchmark and roughly at the provincial clean-energy market average. This is the single most under-appreciated fact about the company. Owning a monopoly river does not mean charging monopoly prices. It means being the low-cost supplier into an administered market where the price is set by policy and, increasingly, by spot clearing — not by the seller.
Two channels absorb the output. 西电东送 West-to-East exports move power to 中国南方电网 China Southern Power Grid for delivery into Guangdong under long-term arrangements. Local Yunnan consumption goes largely to industrial users — electrolytic aluminum and industrial silicon smelters that migrated to the province in the late 2010s precisely because hydropower was cheap. Recent industry surveys put comprehensive industrial electricity costs in Yunnan at ¥0.42–0.44 per kWh all-in, which the surveyors noted no longer represents a meaningful discount to the national median.10 That is worth flagging: the province's core competitive pitch to energy-intensive industry has eroded, which bears on whether that demand base grows.
What the company does disclose, in a regulatory review response filed during its 2025 share placement, is unusually specific about how the export channel is priced. Under a July 2024 power purchase contract signed with Guangdong Power Grid, Yunnan Power Grid and China Southern Power Grid's ultra-high-voltage transmission arm, the entire commercial output of six upper-Lancang stations — Miaowei, Dahuaqiao, Huangdeng, Tuoba, Lidi and Wunonglong — was committed to Guangdong on a point-to-grid basis for 2024 and 2025. Within that arrangement, 20 TWh a year was designated priority generation at ¥0.30 per kWh, with the balance settled at a market price of ¥0.2588 per kWh.18
That single disclosure explains a great deal. It is why the upper-basin stations are described as the company's "high-tariff" plants, why their inflow matters disproportionately to blended price, and why a dry spring in the upper gorge translates directly into a weaker average tariff for the whole fleet. It also shows the shape of the trend: even the export channel now has a market-priced tranche sitting roughly fourteen percent below the administered one. The company does not publish a channel-by-channel revenue split, so the precise mix between Guangdong exports and Yunnan domestic sales is not disclosed.
The demand-side case for those exports is genuinely strong and worth stating fairly, because it is the strongest thing in the bull file. Guangdong consumed 912.1 TWh of electricity in 2024, up 7.3%, becoming the first Chinese province to pass 900 TWh, while generating only 695.5 TWh internally — a gap above 216 TWh that has to be imported.18 Roughly 70.7% of Guangdong's own generation was thermal, burning coal that is more than 90% sourced from outside the province.18 Guangdong's consumption compounded at about 5.1% a year from 2021 to 2024, driven partly by data centres and electrified transport.18 A province that structurally cannot generate what it consumes, and whose own generation is carbon-heavy and fuel-import-dependent, is a durable customer for zero-carbon power from the west. That is the demand pillar under the entire West-to-East programme, and it is not in doubt.
What is in doubt is who captures the value. Guangdong itself added 41.1 GW of solar and 18.0 GW of wind by end-2024, and the landed price of Lancang power is explicitly positioned as below Guangdong's average on-grid price — competitive against provincial thermal and nuclear precisely because it is cheaper.18 Being the low-cost supplier into a structurally short market is a good position. It is not the same as being able to raise price.
The bigger structural change is marketization. In 2025, market-traded electricity reached 92.45 TWh out of 125.86 TWh of on-grid volume — 73.46% of output, up from 61.95% a year earlier.2 In one year, more than eleven points of the company's output migrated from administered pricing to negotiated and spot pricing. That is the mechanism behind the 5% tariff decline, and it is not finished.
The Depreciation Problem
The unit economics remain formidable despite all this. Auxiliary power consumption ran at 0.77% of generation in 2025 — hydro plants consume almost nothing to run themselves.2 Average utilization across the whole fleet, including the new solar, was 3,749 hours.2 Cash operating cost per kilowatt-hour, once depreciation is stripped out, is a small fraction of the realized tariff. This is why operating cash flow of ¥19.05 billion so dramatically exceeds net profit of ¥8.50 billion: the gap is depreciation on assets that require no cash to sustain.3
And that gap is the crux of the accounting judgment investors must form. A dam has a useful economic life measured in a century or more; the Hoover Dam is ninety years old and running. Chinese accounting depreciates hydro assets over schedules far shorter than that. The result is that reported net income systematically understates the cash the assets produce — genuinely so, not as an argument. But the same convention means that every new unit brought online lands on the income statement as an immediate, rigid cost against a revenue stream that must be earned in a softening market. That is precisely what happened in the first half of 2026, and it is where the growth story collides with the cash story.
VII. The Hidden Growth Engine: Hydro-Wind-Solar Integration
Why Water and Sunlight Belong Together
In the first half of 2026, engineers at Xiaowan commissioned something that sounds mundane and is not: the first hydro-solar complementary project in China running entirely on a domestically developed station control system.4 The same period saw the Nuozhadu-area 1,890 MW hydro-solar clean energy base enter full construction, and the company's first virtual power plant reach profitability from the moment it entered the market.4
The logic behind 水风光一体化 hydro-wind-solar integration is the most genuinely interesting thing about this company's next decade, so it is worth explaining plainly.
Solar panels produce electricity when the sun is up and nothing when it is not. Wind turbines are worse — they produce when the wind blows, which correlates with nothing anyone cares about. Both are therefore worth less per kilowatt-hour than firm power, and both impose costs on the grid, which must hold reserves to cover their swings. A hydro turbine, by contrast, can go from standstill to full output in a few minutes and can be modulated continuously. Put a solar farm next to a hydro station and the hydro station can absorb the solar farm's volatility: when a cloud passes, water flows harder; when the sun is fierce at noon, water is held back and stored for the evening.
The result is that the pair, dispatched together, can deliver a flat, firm output profile over a transmission line that neither could deliver alone. And that is where the real economics live. Ultra-high-voltage transmission is enormously expensive and is priced on capacity, not energy — a line that runs at 40% utilization costs the same as one that runs at 90%. A standalone solar developer in Yunnan must either build new transmission or accept curtailment. Huaneng Lancang can bolt solar onto lines already paid for and already reserved, filling hours the dams would otherwise leave idle.
That is the thesis. Here is where it stands against the evidence.
What the Buildout Has Actually Earned
Management told investors in May 2026 that four demonstration projects — at Manwan, Dahuaqiao, Miaowei, and Xiaowan — were complete, totaling more than 2,000 MW, with a further 4,000-plus MW planned or under construction, focused on Nuozhadu.14 Total new energy capacity reached 6,092 MW at end-2025 after 2,390 MW of additions during the year, and the company added another 3,052 MW of clean energy capacity in the first half of 2026 alone.34 It secured 1,890 MW of photovoltaic resource allocation at Nuozhadu in December 2025 and had 2,640 MW of projects admitted to Yunnan's first 2026 construction list, which it describes as first in the region.4
So the buildout is real and fast. The question is what it earns. On the segment numbers already noted, solar's gross margin is roughly half of hydro's, and solar's realized tariff of ¥253.12 per MWh in 2025 came alongside a margin the company itself attributes partly to falling solar pricing.2 Meanwhile the depreciation from these assets is arriving immediately. In the first half of 2026, cost of sales rose 8.58% against revenue growth of 1.45%, and the company named depreciation on newly commissioned photovoltaic projects as the driver.4 Independent analysis of the interim result estimated that increased depreciation accounted for close to 90% of the profit decline — meaning that, adding depreciation back, earnings were roughly flat.19
The calibrated conclusion: the co-location advantage is real and mechanically sound, but on the disclosed evidence it has so far produced a lower-margin business that dilutes reported returns during its build phase. Whether it becomes accretive depends on two things investors can actually watch — whether new-energy gross margin converges toward the hydro fleet as scale builds and curtailment stays low, and whether Yunnan's absorption capacity keeps pace with a province that already had more than 41 GW of wind and solar by mid-2025 and is adding fast.10 The company's own risk disclosure says provincial demand and export absorption growth are limited while new energy capacity keeps growing quickly.2 It is unusual for a company to publish the bear case on its own growth vector. Investors should take it seriously.
The Upstream Bet
The upstream frontier is a different kind of bet, and a much larger one. 托巴水电站 Tuoba Hydropower Station, 1,400 MW, was built for ¥23.20 billion, with its four units entering service in June, July and September 2024 and January 2025.21820 Its feasibility study put average annual output near 6.0 TWh initially, rising toward 6.2 TWh once the stations above it are running — the cascade effect working in advance of the assets that create it.18 Its first full year is instructive. Against a committed benefit of ¥606.0 million disclosed in the placement documentation, Tuoba delivered ¥332.1 million in 2025 — approximately 45% short.2 That is a documented, near-term instance of a completed project underdelivering against the return the company told the market to expect, and it is the most relevant available evidence for how to treat forward promises about upper-basin economics.
Beyond Tuoba lie the two projects that will define the company's balance sheet into the 2030s. The Rumei station in the Tibet reach of the Lancang carries a budget of ¥58.38 billion for 2,600 MW and 11.28 TWh of average annual output; NDRC approval came in April 2023 with a 132-month construction schedule, financed roughly 30% equity and 70% policy-bank and commercial debt.7 At end-2025 it stood at 12.52% complete. The company's own disclosure states the diversion tunnel gates close for impoundment in 2031 and units begin generating in 2033; its regulatory filings describe the output as destined for the Greater Bay Area following commissioning around 2035, bundled with the wider upper-Lancang clean energy base over ultra-high-voltage direct current.218 Rumei is designed for 11.3 TWh of average annual output — roughly 9% of the company's entire 2025 generation, arriving in the middle of the next decade.18 A second upper-basin project, disclosed under the code "GS," carries a budget of ¥39.79 billion and was 8.67% complete.2
Add those two and roughly ¥87 billion of committed construction spending remains outstanding — against a company whose market capitalization is about ¥178.7 billion and whose annual net profit is ¥8.5 billion.21 Rumei alone will consume capital for another seven years before producing revenue. Management guided 2026 capital expenditure of approximately ¥21.1 billion, up from ¥17.14 billion in 2025, and stated that upper-Lancang base development is the capital priority for the 15th Five-Year Plan period.142
Green Certificates and Other Small Change
The scale of the commitment behind all of this was quantified for regulators rather than for the market, and the number is arresting. In its placement review response, the company set out planned capital spending for 2025 through 2027 of ¥76.82 billion — ¥40.0 billion on hydro projects, ¥33.1 billion on new energy, and ¥3.7 billion on pumped storage.18 Against that, it calculated a three-year funding gap of roughly ¥13.8 billion, and stated plainly that this gap "far exceeds" the ¥5.825 billion the placement would raise — before accounting for shareholder dividends, working capital, or debt repayment.18
That is the most important sentence the company has published about its own capital position, and it appears in a regulatory filing rather than in investor communications. It reframes the pumped storage line item too: ¥3.7 billion over three years is a real programme and a small one, roughly five percent of planned spending, appropriate to treat as a grid-services experiment rather than a second business.
There is a smaller, cleaner optionality worth noting without inflating it. Green certificates — tradable proof that a megawatt-hour was renewable — have become a real market, with the 2025 national average transaction price around ¥5.15 per certificate.22 The company says it sold its full tradable allocation in 2025 under a centralized procurement-and-sales model.2 Do the arithmetic honestly: one certificate represents one megawatt-hour, so a few yuan per certificate sits against a hydro tariff above ¥200 per megawatt-hour. Even full monetization of every eligible megawatt-hour would be worth low single-digit percentages of revenue. Real money, not a re-rating. The company also began earning from ancillary services, storage, and a 100 MW vanadium flow battery project at Eryuan admitted to Yunnan's construction list.4 These are early-stage and should be treated as such: certification and pilot status are not commercialization, and this company's own Tuoba experience shows the gap between a commissioned asset and its promised return.
Which raises the question of what, exactly, the moat protects.
VIII. Strategic Frameworks: Helmer's 7 Powers & Porter's 5 Forces
Frameworks are only useful if they are allowed to return uncomfortable answers. Applied honestly here, they return a consistent one: the barriers around this business are close to absolute on the supply side and close to absent on the demand side.
Seven Powers, Honestly Applied
Cornered Resource. This is the primary power, and it is genuine. No other entity can develop hydropower on the Yunnan Lancang. The sites are physically finite, legally assigned, and already built out. A competitor with unlimited capital cannot enter. But Hamilton Helmer's own definition requires that the resource be obtained at attractive terms and produce a differentiated benefit — and the benefit here is a low-cost commodity sold into a market whose price the owner does not set. The resource is cornered. The rent is not fully captured. The correct statement is narrower than the popular one: Huaneng Lancang has a cornered volume franchise with contested pricing.
Scale Economies. Real but modest. Centralized dispatch, a single hydrological modeling team, and shared maintenance amortize across 126 TWh of output — the company reports 0.77% auxiliary consumption and a "zero unplanned outage" record on hydro units, with 82 unit overhauls in the first half of 2026 at a stated quality rate above 93%.24 These are operational excellence indicators, not sources of pricing power.
Process Power. The strongest non-obvious advantage, and it is worth taking seriously. Optimizing water releases across eight interlinked reservoirs, forecasting inflow weeks ahead, and now co-dispatching several gigawatts of intermittent solar is a genuinely hard control problem that accumulates value with data. The company has built AI-based inflow and power forecasting, participates as the sole power enterprise in a national key research program on ultra-large hydropower data fusion, and reported 289 granted invention patents in 2025.24 Process power is difficult to verify from outside — patents and awards are inputs, not proof — but the cascade's ability to lift 2025 generation 13.32% in a year when Nuozhadu-section inflow was only 15% above average is at least consistent with the claim.2
Counter-Positioning. Absent, as the outline correctly anticipates. This is an incumbent asset-heavy natural monopoly. There is no new business model here that an incumbent cannot copy — and, uncomfortably, the counter-positioning risk runs the other way. Distributed solar plus batteries, sold behind the meter to the very aluminum smelters that are Huaneng Lancang's local customers, is a business model that erodes the incumbent's volume without needing to beat it on the wholesale market.
Branding, Network Economies, Switching Costs. None. Electrons are fungible. A smelter buying power does not know or care which dam it came from, except insofar as green attributes carry a certificate premium.
Five Forces
Porter's forces sharpen the same picture.
Threat of new entrants is effectively zero — capital, geography, and licensing all bar the door.
Supplier power is close to zero on fuel, since the input is rain. But note the two suppliers that do have power: the state, which supplies the development rights, and the construction and equipment complex that supplies the dams. And note a third that appears nowhere in the standard framework — the atmosphere. In the first four months of 2026, Lancang inflow ran approximately 25% below the multi-year average; management's forecast for May through November called for rainfall 10–20% above average, implying a full-year outcome roughly at the multi-year mean at the Wunonglong section and about 10% below at Nuozhadu.14 No supplier negotiation can fix a dry spring.
Buyer power is the force that actually binds. China Southern Power Grid and the Yunnan provincial energy authorities are not one customer among many; they are the market. They set export allocations, approve the market design, and — through the spot market now running on long-cycle operation — determine the clearing price. The company's disclosed 2025 result of 73.46% marketized volume with a 5% blended tariff decline is what buyer power looks like when it is exercised through market design rather than negotiation.2 A skeptic should note that the company reports the spot average price ran 9 fen above the mid-to-long-term market in the first half of 2026 — evidence that the marketing operation is extracting value within the rules, and simultaneously evidence of how much price dispersion the new regime creates.4
Threat of substitutes is where the classical analysis has aged badly. The traditional answer — thermal has fuel costs, renewables lack firmness — was right for two decades. It is now weakening. Yunnan added enough wind and solar to make it the province's second-largest power source, and the company's own risk disclosure identifies clean-energy absorption pressure as a live issue for both its hydro and its new energy.210 Solar does not substitute for hydro's firmness, but it substitutes for hydro's energy in the middle of the day at a bid price near zero, which is quite sufficient to compress the price hydro receives.
Competitive rivalry remains low in the conventional sense: Yangtze Power has the Yangtze, SDIC has the Yalong, Huaneng Lancang has the Lancang. None can enter another's basin. But rivalry has migrated from the basin to the market. Every hydro operator in the southern grid competes for the same industrial load and the same export allocation, and increasingly bids into the same spot clearing.
The synthesis matters more than the boxes. The powers protecting the asset are near-permanent. The powers protecting the earnings are conditional on regulatory design, provincial demand, and the pace of renewable buildout — none of which the company controls. An investor who treats "monopoly on the Mekong" as though it implies pricing power has confused the two.
IX. Competitive Benchmarking & Peer Comparison
The Comparables
Set the three big Chinese hydro platforms side by side and the differences are structural, not incremental.
中国长江电力股份有限公司 China Yangtze Power Co., Ltd. (600900.SH) is the benchmark and the ceiling. It reported FY2025 revenue of ¥86.24 billion, up 2.07%, and net profit of ¥34.50 billion, up 6.17%, on roughly 71.8 GW of hydro capacity — around 16% of all Chinese hydro.5 Its market capitalization sits near ¥681.7 billion.21 Yangtze Power's advantages over Huaneng Lancang are threefold: far greater scale, a portfolio where the great majority of construction is behind it, and a Yangtze basin whose downstream demand centers pay more. Its disadvantage is that its growth is essentially arithmetic — it has fewer sites left to build and its optionality lies mostly in overseas assets and pumped storage rather than in an unbuilt half of a river.
国投电力控股股份有限公司 SDIC Power Holdings Co., Ltd. (600886.SH) is the closest structural analogue and the more revealing comparison. It reported FY2025 revenue of ¥53.01 billion, down 8.31%, and attributable net profit of ¥7.39 billion, up 11.30%, on 21,305 MW of controlled hydro capacity — the third-largest listed hydro fleet in China — with clean energy at 72.12% of its capacity mix and gearing of 60.52%.23 Its majority-held Yalong River subsidiary is the core asset, and SDIC is running the same hydro-plus-solar co-location playbook in Sichuan that Huaneng Lancang runs in Yunnan. Market capitalization is about ¥113.3 billion.21
Read those two side by side and something instructive emerges. SDIC generated twice Huaneng Lancang's revenue and less attributable net profit — ¥7.39 billion against ¥8.50 billion — because a large share of SDIC's revenue comes from thermal generation and from subsidiaries where minorities take a cut. Huaneng Lancang's structure is purer: it consolidates almost everything it owns, and its revenue carries a far higher margin. That purity is the reason its equity trades at a premium to SDIC's on a per-unit-of-profit basis, and it is also the reason it has nowhere to hide when hydro prices fall.
四川川投能源股份有限公司 Sichuan Chuantou Energy Co., Ltd. (600674.SH), capitalized near ¥76.8 billion, is essentially a holding vehicle for a 48% stake in the same Yalong River asset — a cleaner but more passive expression of the identical basin.21 中国核电 China National Nuclear Power Co., Ltd. (601985.SH) competes for the same investor: a state-owned, capital-intensive, zero-carbon baseload generator with a long build cycle and a regulated-ish price.
What the Valuation Implies
One operational benchmark is worth putting beside the financial ones, because it corrects a common assumption. In 2024, Huaneng Lancang's large hydro stations ran 4,147 utilization hours. The comparable figures the company filed alongside its own were 5,003 hours at Xiluodu, 5,750 at Xiangjiaba, 6,280 at Gezhouba, against 3,794 at the Three Gorges, 3,882 at Wudongde and 3,771 at Baihetan — a peer average of 4,661 hours.18 Huaneng Lancang runs below the large-hydro average and well below the best-sited Yangtze cascade stations. Its two upper-basin projects under construction are designed for 4,300 to 4,500 hours.18
This is not a failure of operations; it is a property of the river. Utilization hours are set by how much water arrives relative to how much turbine capacity was installed, and the Lancang's designers deliberately installed generous capacity to capture flood-season flow and to provide peaking flexibility. But it means the popular benchmark of 5,000-plus hours does not apply here, and any model built on it will overstate output.
On the valuation arithmetic that an investor would actually run: Huaneng Lancang trades at an enterprise value near ¥315.4 billion against a market capitalization of ¥178.7 billion — meaning net debt is roughly three-quarters again the equity value.21 That produces an EV/EBITDA multiple around 17 times and net debt to EBITDA of roughly 7.4 times.21 The dividend of ¥0.205 per share against a share price of ¥9.59 yields about 2.1%.2124
Those figures deserve interpretation rather than recitation. First, the leverage is high in absolute terms, which is normal for hydro and is exactly why the funding cost reduction to 2.43% matters so much.14 Second, a 2.1% yield is thin for a business that is marketed to income investors and thinner than the payout ratio implies, which tells you the market is already capitalizing future dividend growth rather than current distributions. Third, the free cash flow yield sits far below the earnings yield, because capital spending consumes most of the cash the plants produce: ¥17.14 billion of capital expenditure against ¥19.05 billion of operating cash flow in 2025, and an investing outflow of ¥7.08 billion against ¥9.09 billion of operating inflow in the first half of 2026.234 This is not a cash cow today. It is a cash cow in ten years with a very large construction bill in between.
Where Huaneng Lancang genuinely differentiates from Yangtze Power is growth vector: an unbuilt upper basin, a fast-growing co-located renewables portfolio, and a provincial market that, if Yunnan succeeds in attracting computing and industrial load, could tighten. Where it is genuinely worse is balance-sheet position, tariff level, and the proportion of its story that remains unbuilt. An investor choosing between them is choosing between a completed annuity at a full price and a half-completed annuity at a discount with a construction risk attached.
X. Bull vs. Bear Case & Investor Stress Test
The Bull Case, Tested
The bull case has three legs, and each survives contact with the evidence in a modified form.
The free cash flow avalanche. The claim is that as construction winds down, cash conversion approaches unity and dividends rise sharply. The mechanism is sound and partly proven — operating cash flow of ¥19.05 billion against net profit of ¥8.50 billion in 2025 demonstrates it.3 But the timing is the whole question, and the company's own capital plan pushes it out. Guided 2026 capital expenditure of about ¥21.1 billion exceeds 2025 operating cash flow's growth by a wide margin, and Rumei does not generate until 2033.142 The claim survives, but narrowed: the avalanche is real and it is at least seven years away, with the 15th Five-Year Plan period explicitly designated as an upper-Lancang investment phase.
The renewable growth multiplier. Adding gigawatts of solar onto existing transmission does increase volume with modest incremental fixed cost. It also, on 2025 segment economics, adds it at roughly half the gross margin of hydro and with immediate depreciation.2 The claim survives narrowed to this: renewables expansion grows revenue and asset base, and it is dilutive to margin and to near-term earnings. Whether it is value-accretive depends on returns that will not be visible for several years.
Power price resilience. Management's case, given directly to fifty-odd institutions in May 2026, rests on Yunnan's 15th Five-Year Plan policies to attract computing power and electrolytic aluminum, and on new clean-energy absorption policies spanning provinces and grid regions.14 Test it against the record. Yunnan's industrial power cost advantage has already eroded to near the national median.10 Provincial new energy capacity passed 41 GW by mid-2025.10 The company's realized tariff fell about 5% in 2025 and its own H1 2026 disclosure attributes further blended-price decline to the mix shift away from high-tariff upstream stations.24 This claim does not survive intact. Management is bullish on provincial prices; two consecutive reporting periods of falling realized tariff, plus its own risk disclosure describing supply-demand as loose, point the other way. The honest statement is that management's price thesis is a forecast contradicted by recent trend, and the burden of proof sits with them.
The Bear Case
Now the bear case, and the stress test a skeptical investor would actually run.
Hydrology remains the first-order risk and it is not diversifiable. The 2023 episode showed a 25% first-half inflow shortfall translating into a 25% generation decline.9 What made 2023 tolerable was that scarcity lifted price. In a surplus market with 41 GW of provincial renewables standing by, that offset weakens. A dry year in the new market structure is a volume loss without the price compensation. The 2026 year to date offers a live test: inflow ran 25% below average through April, and management's full-year expectation depends on a forecast of above-normal rainfall from May.14 Its interim report separately warned that a very strong El Niño event was expected to form in the summer and autumn of 2026, adding to inflow extremity and complexity.4 That is a company telling shareholders, in a regulatory filing, that the weather is getting harder to predict.
The market reform risk is the one management itself will not underwrite. The disclosure is worth restating in its own terms: under short-cycle, cost-optimal spot clearing, whether the main reservoirs' wet-to-dry storage function can be effectively realized "remains to be verified."2 Every valuation of this company implicitly assumes stored water gets paid for. The company will not assert that it does.
The capital expenditure drag is quantified and long. Roughly ¥87 billion of budgeted construction remains outstanding across the two upper-basin projects, on top of continuing renewables spending, against ¥8.5 billion of annual net profit.2 Rumei was 12.52% complete after more than two years of construction.2 The capitalized-interest disclosure adds a subtlety worth noting: the company had cumulatively capitalized ¥3.58 billion of interest into construction in progress, including ¥1.82 billion on Tuoba — interest that becomes depreciation rather than an expense, flattering reported earnings during the build and burdening them afterward.2 This is standard, permitted accounting, and it is a real judgment investors should adjust for.
The activist's questions. A skeptical long-short investor would press on five points. First, dividend integrity: the FY2025 distribution of ¥3.819 billion equals 44.9% of attributable net profit, while the articles of association require at least 50% of distributable profit be paid in cash.3 Management's answer, given in May 2026, is that recent execution against the charter's own measure — parent-company distributable profit — has run at 58–60%, which complies.14 That may well be correct as a legal matter. It is also a reminder that the widely cited "50% payout" refers to a denominator most investors are not looking at. Second, the funding of that dividend: asked directly how a rising dividend coexists with heavy construction, management said the shortfall would be met "through financing."14 Paying dividends from borrowings during a capital expenditure peak is a choice, not a law of nature, and it is one an activist would challenge. Third, the equity record: the company completed its first refinancing since listing in September 2025, issuing 631,094,257 shares at ¥9.23 to raise ¥5.825 billion — reduced from an originally planned ¥6.0 billion.252 Cumulative equity raised since IPO is ¥9.725 billion against cumulative dividends of ¥26.1 billion including the 2026 payment, a ratio management cites as 2.7 times.14 That is a genuinely favorable ratio. It is also no longer true that the company has never returned to the equity market, and future upper-basin funding gaps make further issuance a live possibility rather than a theoretical one.
Fourth, related-party dependence: the controlling shareholder is also the counterparty in asset injections, the source of executive appointments, and the ultimate arbiter of strategy. The Sichuan purchase at a 136% premium to book was justified on non-competition grounds and has performed adequately, but minorities had no mechanism to test the price.152 Fifth, the record on abandoned projects — small in amount, useful as signal. The FY2025 accounts disclose impairments against construction in progress for the Tuoluo station preliminary costs of ¥5.53 million, written off because "external project conditions and policies changed making it difficult to advance"; ¥25.99 million on a station coded "YL" that "cannot be continued"; and ¥13.17 million on Sichuan Huaneng Baoxing River following provincial policy restricting small hydro.2 These are rounding errors financially. They are evidence that policy can kill a project after money is spent, which matters when ¥87 billion of policy-dependent construction lies ahead.
Working capital and liquidity. One more item a credit analyst would flag: the company funds itself substantially through short-term instruments and carries current liabilities well in excess of current assets. At mid-2026 short-term borrowings stood at ¥12.72 billion, current maturities of non-current liabilities at ¥9.27 billion and other current liabilities — largely ultra-short-term commercial paper — at ¥9.44 billion, against cash of ¥5.77 billion and receivables of ¥4.75 billion.4 The FY2025 bond schedule lists a long roster of green medium-term notes, rural-revitalisation notes and science-and-technology innovation paper, many maturing within twelve months.3 In a low-rate environment with policy-bank support this is cheap and rational; the 2.43% blended cost proves it.14 It is also a structural refinancing exposure that would become expensive quickly if credit conditions in China tightened. No rating actions on the company or its bonds were disclosed during 2025.3
Trust and communication patterns. On the evidence available, management explains misses with specificity rather than deflection. The interim report named three causes for the profit decline and quantified the inflow shortfall by river section.4 The annual report published a risk section that undercuts its own growth narrative.2 The investor record answers capex and dividend questions with numbers.14 That is better disclosure behavior than the sector average. The countervailing observation is that where management does make a forward claim — Yunnan tariff strength through the 15th Five-Year Plan — it is asserted from policy intentions rather than from contracted evidence, and the recent trend runs against it.
The Risk Outside the Filings
The Mekong overhang. One risk sits outside financial disclosure entirely. The Lancang cascade controls flow timing on a river that supports agriculture and fisheries for tens of millions of people in Laos, Myanmar, Thailand, Cambodia and Vietnam, and the environmental consequences of mainstream damming have been the subject of sustained international research.26 Nothing in current disclosure suggests a near-term financial impact, and the company's filings do not quantify any transboundary obligation. But an operator whose reservoirs help determine downstream dry-season flow in five foreign countries carries a category of political risk that does not appear in a discounted cash flow model until it does.
Myth vs Reality
Three consensus statements about this company deserve direct correction.
Myth: the payout ratio is above 50% and heading to 70%. Reality: the FY2025 cash dividend equalled 44.9% of consolidated attributable net profit. The 50% figure in the articles of association is measured against parent-company distributable profit, a different and smaller denominator; on that basis management says execution has run at 58–60%.314 Both statements can be true simultaneously. Investors should know which one they are quoting.
Myth: hydro capacity of this quality runs 5,000-plus hours a year. Reality: 4,147 hours in 2024 for the company's large hydro, below the large-hydro peer average.18
Myth: capital spending is winding down as the dams are finished. Reality: guided 2026 spending is roughly ¥21.1 billion, above 2025's ¥17.14 billion, and the three-year plan filed with regulators runs to ¥76.8 billion.14218 The company is entering a build cycle, not exiting one.
XI. Key KPIs & Conference Call Guide for Investors
Most companies deserve a long dashboard. This one deserves a short one, because three numbers explain nearly everything.
First: annual generation, read against inflow. Generation is the physical output — 126.93 TWh in 2025, a record.3 But generation alone misleads, because it rises whenever new capacity is added regardless of whether the water showed up. The number to pair it with is inflow relative to the multi-year average at the two sections management reports: Wunonglong at the top of the Yunnan cascade, and Nuozhadu at the bottom.14 The reason to watch both is that they behave differently and price differently. Upstream stations are higher-tariff and have weak regulating capacity; downstream stations are lower-tariff and buffered by Xiaowan and Nuozhadu storage. Management explicitly attributed the H1 2026 blended-tariff decline to upstream inflow being 13% below the prior year, which cut generation at six high-tariff plants.4 A year with strong total generation but weak upstream inflow will produce disappointing revenue, and only this pairing reveals it in advance.
Second: blended realized tariff, alongside the marketized share. The 2025 figures were ¥210.58 per MWh blended and 73.46% of on-grid volume traded on the market.2 This pair is the single best measure of whether the moat converts into money. If the marketized share keeps climbing while realized tariff falls, the cornered-resource thesis is being repriced in real time regardless of how much water flows. If tariff stabilizes as marketization approaches saturation, management's price thesis gains credibility. The company publishes both annually, and the quarterly generation announcements give a volume read in between.
Third: free cash flow after capital expenditure, and the payout ratio measured on attributable net profit. Operating cash flow is already large and predictable. The variable is what the company spends. Guided 2026 capital expenditure of roughly ¥21.1 billion against 2025 operating cash flow of ¥19.05 billion means the business is currently outspending its cash generation.143 The payout ratio matters as a discipline signal, and it should be measured on the consolidated attributable figure — 44.9% in FY2025 — rather than the parent-company distributable-profit basis management cites, because the former is what a shareholder's dividend actually competes with.3
Anything else is second-order. Utilization hours, auxiliary consumption, gearing, and green certificate revenue all move within narrow bands and none will change an investment thesis on its own.
Where to Read the Primary Evidence
For those reading primary materials, three documents carry most of the signal.
The FY2025 annual report, published April 2026, contains the segment tariff and cost tables that reveal the hydro-versus-solar margin gap, the construction-in-progress schedule with budgets and completion percentages for Rumei and the second upper-basin project, the impairment note on abandoned preliminary works, and the risk section quoted throughout this article.2 It is the most informative single document the company produces, and the parts that matter are the tables rather than the narrative.
The May 21, 2026 investor relations record, filed after a meeting attended by the chairman, general manager, board secretary, three independent directors and roughly fifty institutions including CITIC Securities, JPMorgan, BofA Securities and Huatai, is the closest thing to an earnings call transcript this company produces.14 Five questions were asked; the answers on financing costs, inflow expectations, the dividend policy and the ¥21.1 billion capital budget are more direct than anything in the annual report. The tell is question five, where an investor essentially asked how the dividend and the construction program can coexist, and management answered that the gap gets financed. That is a candid answer, and it is the answer that should shape expectations.
The H1 2026 interim report, filed August 26, 2026, is the document where the growth story and the earnings story visibly diverge — record generation, falling profit, and a named depreciation cause.4 Reading it against the FY2025 report shows an unusual consistency of language on risk: the same three market risks and the same inflow risk appear in both, with the 2026 version adding the El Niño warning. Consistency of risk language across periods is a modest but genuine credibility marker; it is the companies that quietly delete last year's risk paragraph that deserve suspicion.
XII. Epilogue & Playbook Lessons
There is a version of this story that is very simple. A company owns a river. Rivers do not stop. Therefore the company compounds forever.
The version supported by the filings is more interesting. Huaneng Lancang does own the river, in every sense that matters — legally, physically, and permanently. Nobody will ever build a competing dam on the Yunnan Lancang. The 28 GW of hydro already standing will produce electricity long after everyone reading this is gone, at a marginal cost near zero, from an input that falls out of the sky.
What the company does not own is the price. And in the five years covered by its recent disclosures, that distinction has moved from academic to arithmetic: three-quarters of its output now clears through markets, its realized tariff has been falling, its most recent half-year saw record volume and lower profit, and its own risk section describes a provincial market where supply is loosening and the value of stored water "remains to be verified."24
Meanwhile the company is spending. It has roughly ¥87 billion of construction budget outstanding on two upper-basin projects, one of which generates nothing until 2033, and it has told investors plainly that the gap between dividends and capital needs will be financed.214 This is not a criticism. It is a description of where the business is in its cycle: mid-build, not post-build. The distinction determines almost everything about how the equity behaves over the next decade.
The Playbook
Three lessons generalize beyond this company.
Front-loaded capital, back-loaded cash. Infrastructure looks worst precisely when it is being created — leverage peaks, depreciation lands before revenue matures, and reported returns understate economics. The mirror image is that infrastructure looks best just before someone decides to build the next thing. Huaneng Lancang has been in the attractive phase and has chosen to re-enter the unattractive one, deliberately, because the upper basin is the last unbuilt piece of the resource. Whether that is discipline or empire-building will be visible in 2033, which is an uncomfortably long feedback loop.
System control beats asset ownership. The cascade is worth more than the sum of its dams because upstream storage improves the input to every station below it. That is the genuine, non-obvious source of advantage here, and it is why the state assigned the whole basin to one operator. The same logic is now being extended to solar and wind bolted onto existing reservoirs and transmission — plausible in mechanism, unproven in margin.
A cornered resource is not the same as pricing power. This is the lesson with the widest application. Exclusive control of a physical asset guarantees that nobody takes your volume. It guarantees nothing about what you are paid for it — particularly where the buyer is the state, the market design is being rewritten, and a competing technology is being installed nearby at a rate that outpaces demand growth. The evidence to watch is not whether the river keeps flowing. It is whether the blended tariff stops falling.
References
-
华能澜沧江水电股份有限公司 2025 年年度报告 — 上海证券交易所, 2026-04-29 ↩↩↩↩↩↩↩↩↩↩↩↩↩↩↩↩↩↩↩↩↩↩↩↩↩↩↩↩↩↩↩↩↩↩↩↩↩↩↩↩↩↩↩↩↩↩↩↩↩↩↩↩↩↩
-
华能澜沧江水电股份有限公司 2025 年年度报告摘要 — 巨潮资讯网, 2026-04-29 ↩↩↩↩↩↩↩↩↩↩↩↩↩↩↩↩↩↩↩↩↩↩
-
华能澜沧江水电股份有限公司 2026 年半年度报告 — 巨潮资讯网, 2026-08-26 ↩↩↩↩↩↩↩↩↩↩↩↩↩↩↩↩↩↩↩↩↩↩
-
长江电力(600900.SH):2025年年报净利润为345.03亿元、同比上涨6.17% — 新浪财经, 2026-04-30 ↩↩
-
华能澜沧江水电股份有限公司投资者关系活动记录表 — 巨潮资讯网, 2026-05-21 ↩↩↩↩↩↩↩↩↩↩↩↩↩↩↩↩↩↩↩↩
-
标的资产总额达187.5亿 为解决同业竞争,华能水电拟收购控股股东旗下部分水电资产 — 每日经济新闻, 2023-05-10 ↩↩
-
关于华能澜沧江水电股份有限公司向特定对象发行A股股票申请文件的审核问询函的回复报告 — 保荐人中信证券, 2025-06-10 ↩↩↩↩↩↩↩↩↩↩↩↩↩↩↩
-
SSE:600025 Huaneng Lancang River Hydropower — Stock Chart and Key Financials — TradingView ↩↩↩↩↩↩↩
-
华能澜沧江水电股份有限公司 2024 年度向特定对象发行A股股票上市公告书 — 上海证券交易所, 2025-10-17 ↩
-
Environmental consequences of damming the mainstream Lancang-Mekong River: A review — Earth-Science Reviews / ScienceDirect, 2015 ↩
 LinkedIn
 WhatsApp
 Reddit
 Hacker News
 Email
Email Kindle
 RSS Feed
 Spotify
 Apple Podcasts
 Amazon Music
 Audible
 YouTube